

Abstract
In order to understand the origin of the huge quasielastic magnetic scattering observed previously with a back-scattering neutron spectrometer, we have re-investigated the low energy excitations in HoCrO3 by inelastic neutron scattering in a much wider energy range with time-of-flight neutron spectrometers. The inelastic signals are due to the excitations between the ground state doublet of the Ho ion. The quasielastic signal is due to the fluctuation of the disordered Ho moments. At low temperature the intensity of quasielastic scattering is small. It starts increasing as the temperature increases above 30 K. At the same temperature, the elastic intensity due to Ho moment ordering decreases in a similar way. This observation strengthens the hypothesis that the quasielastic scattering is due the fluctuations of the disordered Ho moments. The time scale of fluctuations has been determine from the quasielastic scattering and was found to vary from about 22 ps at  K to about 2.5 ps at
  K. The stretched exponential line shape indicates a distribution of decay rates at low temperatures.
Export citation and abstract BibTeX RIS
Introduction
The structure and properties of transition metal oxides ABO3 (A = rare earth R or Y, B = Ti, V, Cr, Mn, Fe, Co, Ni and Cu) with distorted perovskite structures and their layered variants have been investigated quite intensively for more than half a century. The discovery of high-Tc superconductivity in 1986 in doped layered-variant cuprate perovskite materials gave a big boost to this research [1–3]. This was then followed by the discovery of colossal magnetoresistive manganites [4] and subsequently several multiferroic [5, 6] materials suitable for potential applications in magnetic and spintronic devices. Apart from potential industrial applications the research revealed a wealth of complex phenomena arising due to the interplay among charge, orbital, spin and lattice degrees of freedom. Among all these transition metal compounds the chromites RCrO3 are relatively less investigated probably because of the difficulty of their synthesis and especially their crystal growth. However, in recent years there have been some reports of possible multiferroic behavior [7–17]. The presence of two magnetic sublattices also give rise to several interesting phenomena like weak ferromagnetism and spin reorientation transitions. Here we have investigated low energy magnetic excitations in HoCrO3 by inelastic neutron scattering with the time-of-flight neutron spectroscopy. The initial impetus of this work was our previous study of hyperfine interaction [18] by high-resolution back-scattering neutron spectroscopy that revealed the existence of hyperfine signals at about ±22 μeV at low temperature. However, while studying its temperature dependence we observed the appearance of huge quasielastic scattering at higher temperature in which the relatively weak hyperfine signals at about ±22 μeV were completely buried and could not be studied further. The hyperfine study was done with a spectrometer energy window of about ± μeV and therefore the evolution of the quasielastic scattering could not be studied at higher temperatures at which its width became larger than the energy window and therefore the most of the signal went outside the window. In order to understand the origin of the observed quasielastic scattering in HoCrO3 we have carried out the present investigation with two time-of-flight neutron spectrometers with somewhat reduced energy resolution but with a much larger energy window. This has allowed us to investigate the origin of the quasielastic scattering.
HoCrO3 crystallizes with the orthorhombically distorted perovskite structure in the space group  and has four formula units per unit cell. The magnetic properties of HoCrO3 have been studied by magnetization and neutron diffraction in the second half of the last century. The exchange coupling between nearest-neighbor
  ions is predominantly antiferromagnetic and these ions order magnetically [19–21] below
  K. Below this temperature HoCrO3 exhibits weak ferromagnetic moment [21]. The magnetic structure of the Cr sublattice [21] is
  in the notation of Koehler et al [22] and Bertaut [23]. At lower temperature Ho ions order and also due to strong interaction between Cr and Ho moments, spin canting phenomena take place [24–26]. The recent interest [7, 27–30] in HoCrO3 and other rare-earth chromites is due to the possibility of coupling between the magnetic and ferroelectric properties leading to multiferroic behavior and potential device applications. There have been several reports of the ferroelectric polarization in HoCrO3 and other rare earth chromites [14, 16, 17]
Experimental methods
Polycrystalline HoCrO3 samples were synthesized by the solid state reaction of Ho2O3(3N) and Cr2O3(4N) in stoichiometric ratio [25]. The precursors were mixed intimately and subsequently heat treated at 1100 °C for 48 h. The resulting material was then reground and annealed again at 1200 °C for 24 h. The phase purity of the synthesized powder sample was then confirmed by powder x-ray diffraction with CuKα ( Å) radiation, using a Huber x-ray diffractometer (Huber G670) in transmission Guinier geometry. Specific heat, magnetization and also neutron diffraction measurements showed that the sample orders below
  K.
K.
Inelastic and quasielastic neutron scattering
Inelastic and quasielastic neutron scattering investigations were done on the cold neutron chopper spectrometer [31] (CNCS) at the spallation neutron source of the oak ridge national laboratory, oak ridge, Tennessee, USA and also on the OSIRIS spectrometer [32, 33] of the ISIS Facility at Chilton, Didcot, UK. Incoming energies  and 12 meV were used for the measurements on CNCS. The runs on the indirect time of flight backscattering spectrometer OSIRIS utilized an end energy of 1.845 meV and the elastic energy resolution was 25 μeV and the inelastic one at 1.4 meV energy transfer was about 28 μeV.
Figure 1 shows the inelastic spectra of HoCrO3 at  and 200 K measured on the CNCS spectrometer with
  meV on both energy loss and gain sides. We see clearly the presence of inelastic peaks on the energy loss and energy gain sides at ±
 meV. The inelastic peaks are due to the transitions from the ground state doublet of the
  . With the present resolution of the spectrometer we of course do not see the hyperfine peaks at
  μeV previously observed by us [18] on the back-scattering neutron spectrometer BASIS. These inelastic signals are here inside the central quasielastic peak. The spectra were fitted by convoluting instrumental resolution function
  determined from vanadium with one delta function
  for the elastic peak and with two Lorentzians Lins for the two inelastic peaks and a Lorentzian function Lqe for the quasielastic scattering. We have fitted the spectra measured on CNCS spectrometer by the equation
where delta function  represents the elastic peak. The Lorentzian function Lqe represents the quasielastic component and the
  Lorentzian function represents the inelastic peaks. The above mentioned terms are all convoluted numerically with the experimentally determined resolution function,
  . B is the flat background term and
  are scaling factors. The delta function for the elastic peak and the two Lorentzian functions for the inelastic peaks when convoluted with the experimentally determined instrumental resolution function reproduces these three peaks quite well. We have also included the Lorentzian function to take into account for any quasielastic scattering. We note that increasingly strong quasielastic scattering does arise at higher temperatures.

Figure 1. Inelastic spectra of HoCrO3 at  and 200 K measured on the CNCS spectrometer at both energy loss and gain sides fitted by convoluting instrumental resolution function
  determined from vanadium with one delta function
  for the elastic peak, two Lorentzian functions,
  for the two inelastic peaks and a Lorentzian function Lqe for the quasielastic scattering. These components are shown by continuous curves of different colors indicated by the legends. The data have been averaged over the Q-range from
  Å
Å to
to  Å
Å .
.
Download figure:
Standard image High-resolution imageFigure 2(a) shows the inelastic spectra from HoCrO3 obtained on the OSIRIS spectrometer at different temperatures. The OSIRIS data have been fitted by a model comprising a sum of a elastic delta function and two Lorentzian function plus the background. One Lorentzian for the inelastic contribution and one for the emerging quasielastic intensity. A linear background was taken into account. The whole model was then numerically convoluted with the resolution function. Within the Levenberg-Marquardt fit all three intensity parameters, the peak position of the excitation and the line widths of the two Lorentzians have been varied. Figure 2(b) shows the temperature dependence of the inelastic peak obtained by the fits shown in figure 2(a). The energy of the inelastic peak is  meV at
  K. It increases at first with temperature to about
  meV. The energy then decreases continuously with temperature to about
  . It was not possible to fit the inelastic peak at higher temperatures due to the large width of the signal of the inelastic peak. The optical absorption Zeeman spectroscopy [34] shows that the energy eventually becomes about
  meV at
  K and remains constant at higher temperature. These three steps in the temperature variation of energy can be understood by assuming that the constant value of energy attained at
  is the energy of splitting of the ground doublet due to the crystal field alone. At lower temperature the splitting increases with decreasing temperature down to about 40 K due to increase of the field by ordered Cr ions on the Ho site. Below
  K the Ho ions become polarized and put on Ho ion an effective field that decreases somewhat with lowering temperature. The continuous red curves shown in figure 2(a) and also its inset are just guides to the eye.
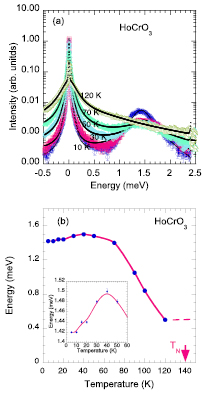
Figure 2. (a) Inelastic spectra from HoCrO3 measured on the OSIRIS spectrometer at different temperatures. The black continuous curves are the fit to the data with the convolution of the instrumental resolution function with a delta function and a Lorentzian for the elastic and the quasielastic peak plus a Lorentzian for the inelastic peak. The data have been averaged over the Q range from 0.3 to 1.1 Å . (b)Temperature variation of the energy of the excitations due to transition between the accidental doublet of the crystal field levels of the
  ions in HoCrO3. In the inset the low temperature part is shown. The continuous red curves are only guides to the eye.
Download figure:
Standard image High-resolution imageThe above results referred to Q-integrated intensities. We have also investigated the Q dependence of the energy integrated intensities of the quasielastic and inelastic excitations. Figure 3 shows the Q dependence of these intensities. The Q dependence of the square of the  form factor [35] is also shown by the continuous line in the figure. Both these intensities decrease strongly with increasing Q showing that these scatterings are of magnetic origin. We expect these intensities decrease as a function Q following the square of the
  form factor. Both these intensities do decrease with increasing Q but the dependences do not follow exactly the form factor. The reason for this deviation may perhaps be explained by the uncertainty in the evaluation process but may have more fundamental reasons as well. For making more definite conclusion one needs further detailed studies. We also show a typical
  map of HoCrO3 at
  K in figure 4 obtained from the OSIRIS spectrometer. It clearly indicated the magnetic origin of the inelastic excitation due to the decay in intensity. Furthermore it does not show any evidence for a dispersion of the excitation with Q.
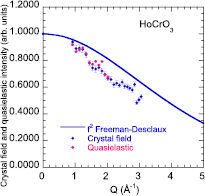
Figure 3. Q dependence of the energy integrated intensity of the inelastic (crystal field) and quasielastic peaks of HoCrO3 measured on the OSIRIS spectrometer of the ISIS Facility. The intensity of the inelastic peak was measured at  K and the quasielastic intensity was measured at 160 K in order to avoid disturbance of magnetic peaks in the covered Q-range. The continuous line is the square of the form factor [35] of
  . In order to compare with the
  form factor, the crystal field and quasielastic intensities are scaled to give the value 1 at
  .
.
Download figure:
Standard image High-resolution image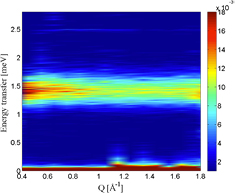
Figure 4. Typical  plot of HoCrO3 measured at
  K on the OSIRIS spectrometer of the ISIS Facility. The results indicate the magnetic origin of the inelastic excitation.
Download figure:
Standard image High-resolution imageFigure 5 shows the temperature variation of the Q-integrated (Q in the range from 0.3 to 1.1  )intensity of the elastic, quasielastic and the inelastic signals from HoCrO3 and their sums as measured on the OSIRIS spectrometer of the ISIS Facility. We note that although the individual intensities vary considerably with temperature their sum remains more or less constant. Most spectacular is the temperature variation of the elastic and quasielastic intensities that have just opposite tendencies. As the temperature is raised above 30 K the elastic intensity decreases whereas the quasielastic intensity shoots up dramatically at the same time. The elastic intensity decreases due to the disordering of Ho moments and quasielastic scattering increases due to the fluctuations of disordered Ho moments. It is known from the diffraction experiments [24, 25] that the intensities of the 100, 011 and 101 reflections grow immensely below about 30 K due to the ordering of the Ho moments. So the origin of the huge quasielastic scattering in HoCrO3 at higher temperature is in fact scattering due to the disordered fluctuating Ho moments. The inelastic scattering due to the crystal field excitations is much smaller compared to the elastic and quasielastic intensities. We also note an increase in intensity of the inelastic peak above about 80 K. We do not consider this small increase to be real but is perhaps due to the increasing difficulties of the least squares fit procedure when the inelastic peak energy became very small and almost merge to the central elastic peak.
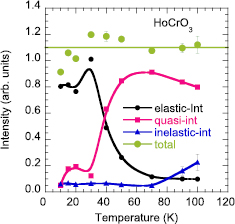
Figure 5. Temperature variation of the Q-integrated (Q in the range from 0.3 to 1.1  ) intensity of the elastic, quasielastic and the inelastic signals from HoCrO3 and their sum as measured on the OSIRIS spectrometer of the ISIS Facility. The lines are only guides to the eye.
Download figure:
Standard image High-resolution imageIn order to get the time scale of fluctuations of the disordered Ho moments we Fourier-transformed the quasielastic data and fitted the intensity by a stretched exponential function

where B is the background and τ and β are the relaxation time and power of the stretched exponential function. Figure 6 shows the fit of these data at different temperatures. The resulting temperature dependences of the parameters τ and β are shown in figure 7. We note that time scale of fluctuations of the disordered Ho magnetic moment varies from about 22 ps at  K to about 2.5 ps at
  K. The power of stretched exponential function β varies from 0.6 at
  K to about 1.0 at
  K. The stretched exponential line shape indicates a distribution of decay rates at low temperatures. However, at high temperatures the decay transforms to a pure exponential decay.
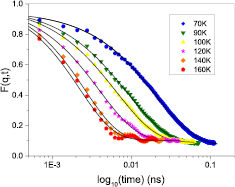
Figure 6. Fourier transformed quasielastic data and their fit with a stretched exponential function (line) at different temperatures.
Download figure:
Standard image High-resolution image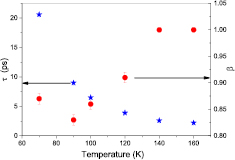
Figure 7. Temperature dependence of the power of stretched exponential function β and the relaxation time τ.
Download figure:
Standard image High-resolution imageDiscussions
We discuss first the origin of the inelastic peak at  meV observed at about 5 K and shown in figures 1 and 2 The two lowest crystal field states of the free ion term
  are singlets, split by an energy of about
  meV in paramagnetic state of HoCrO3, are well below the next excited crystal field state [25, 26, 34, 36] which has an energy of 10 meV and is much higher than
  meV. Thus the two lowest energy singlet states can be treated as an accidental ground doublet or just doublet for brevity. This is because the doublet splitting energy is small and is of the order of magnetic exchange interaction the ground doublet may be described in an effective spin formalism with
  . The energy of the excitations increases continuously as the temperature is decreased in the ordered magnetic state because of the increasing magnetic field of ordered Cr ions at lower temperature. At
  K the splitting decreases due to the magnetic field of the polarized
  ions.
ions.
We consider next the quasielastic scattering under the elastic peak which develops as the temperature is increased above about 30 K. The increase in quasielastic scattering is accompanied by the decrease of elastic intensity as shown clearly in figure 5. The elastic peak is mostly due to the ordering of  ions. The elastic intensity increases with decreasing temperature due to the ordering of Ho magnetic moments and it decreases above about 30 K. The temperature dependence of quasielastic intensity is just the opposite as shown in figure 5. The increasing quasielastic intensity above about 30 K is due to the fluctuations of the disordered moments. The time scale of these fluctuations is determined to be about 8–20 ps in the temperature range investigated as shown in figure 7.
We note that in the Fourier transformed quasielastic data shown in figure 6 shows oscillations in the background for time higher than 15 ps for  and 160 K. This is shown in a more favorable scale in figure 8. The continuous line shows just the interpolation of the data and not any fit. The oscillation period is about 8 ps which corresponds to an energy of about 0.5 meV. This is exactly the energy of the crystal field levels at about
  K and also at higher temperatures. In order to make sure that this oscillation has nothing to do with the truncation error of Fourier transformation we analyzed the Fourier transformed data at
  K and we found again oscillation corresponding to the energy
  meV of the inelastic peak at this temperature.

Figure 8. Oscillations in the background of the Fourier transformed quasielastic data at  K. The period of the oscillations is about 8 ps corresponding to the energy
  meV.
meV.
Download figure:
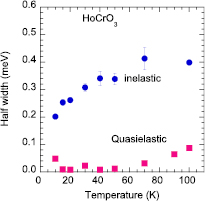
Standard image High-resolution imageFinally we wish to discuss the large width of the inelastic peak shown in figure 2. Also figure 9 shows the temperature variation of the widths of inelastic and quasielastic peaks determined from the data from OSIRIS spectrometer. The width of the inelastic peak at all temperatures is much larger that the instrumental energy resolution [37] which is  eV. There may be several reasons for the broadening for the inelastic peak. There may be coupling of phonon with the crystal field or some other similar coupling processes. To be certain we need detailed investigation on single crystals.
Figure 9. Temperature dependence of the half-width at half-maximum of the inelastic and quasielastic peaks.
Download figure:
Standard image High-resolution image
Conclusion
In conclusion we point out that the huge quasielastic scattering, which was observed in HoCrO3 in our previous study [18] of the hyperfine structure at temperatures above about 30 K, is due to the fluctuations of increasingly disordered Ho moments. We also concluded the same in the previous study [18]. However, at higher temperatures the quasielastic scattering went beyond the dynamic window of the backscattering BASIS spectrometer and therefore could not be investigated in detail properly. In the present investigation with the CNCS and OSIRIS spectrometers with somewhat lower resolution but with much higher dynamic ranges, we could investigate the temperature dependence of the quasielastic scattering in detail more accurately. We have also studied in addition the temperature evolution of low energy crystal-field excitations between accidental ground doublet of  ion. The energy width of the crystal-field excitation is much larger than the instrumental resolution function. The increased width can be due to the coupling of phonons with the crystal field or due to other similar coupling processes. This is still an open issue and needs further detailed single crystal investigations.
Acknowledgments
This work was partly supported by the Science and Technology Facilities Council, STFC. This research used resources at the Spallation Neutron Source, a DOE Office of Science User Facility operated by the Oak Ridge National Laboratory.