

Abstract
The synthesis, crystal structures and magnetic properties of Ba2La2MW2O12 (M = Mn, Co, Ni, Zn) were investigated. They crystallize in the 12-layer polytype of the perovskite structure with a regular cation defect in the B-site. The results of neutron diffraction measurements reveal that they adopt a rhombohedral structure with a space group R − 3 and have a cation ordering between Ba and La ions in the A-site. In these compounds, the magnetic M ions form the 2D triangular lattice. From the results of magnetic measurements, the ferromagnetic ordering of M2+ ions for M = Co (TC = 1.3 K) and Ni (6.2 K) and the paramagnetic behavior (T > 1.8 K) with an antiferromagnetic interaction for M = Mn are observed. From the DFT calculation, their band structures and magnetic interactions are discussed.
Export citation and abstract BibTeX RIS
Introduction
Low-dimensional magnetic materials have attracted a great deal of interest because of their anomalous magnetic properties at low temperatures. In particular, the antiferromagnetism on the 2D triangular lattice have been extensively studied from the aspects of geometrical frustration [1, 2] and quantum spin liquid [3, 4]. In order to find further interesting magnetic behaviors, it is absolutely essential to explore new compounds with a triangular arrangement of magnetic ions.
For such a purpose, we have previously investigated the crystal structures and magnetic properties of 6L-Ba3MSb2O9 (M = Mn, Co, Ni) [5]. They have polymorphic crystal structures of perovskite [6, 7], in which there exist 2D layers containing a triangle array of M ions and each layer is magnetically separated by the diamagnetic layers containing Sb5+ ions. Reflecting these features, the 6L-Ba3MSb2O9 (6H-A phase) behave as 2D antiferromagnets at low temperatures [5]. In recent years, magnetic studies of related compounds have been extensively spread [8, 9], and the spin liquid state was found in the related 6H-B phases with a different stacking sequence of triangular lattices along the c-axis [10, 11].
In this study, we have focused our attention on the B-site defected 12L-perovskites  (A = Ba, Sr, La; M = transition metal, lanthanide etc; M' = W, Re) [12–27]. This crystal structure can be understood by replacing one M' ion with vacancy from a perovskite polymorph 12L-perovskite
  such as
  (Ln = lanthanides; M' = Ru, Ir) [28–30]. This crystal structure has a triangular lattice of M ions similar to 6L-Ba3MSb2O9 (6H-A and 6H-B) [5, 11] but with a different stacking sequence. In addition, the shorter M–M distance (a ~ 5.7 Å < a ~ 5.9 Å) and longer interlayer distance (c/3 ~ 9.1 Å > c/2 ~ 7.2 Å) than 6L-Ba3MSb2O9 are considered to be more adequate for the 2D magnet. However, the investigation on the magnetic properties of
  have been quite limited except for Ba2La2MnW2O12 [24] and
  (A = Ba, Sr, La; M = Co, Ni, Mn; M' = W, Re) [27]. On the other hand, some different structural models (the symmetry, A-site ordering/disordering, and tilting in the connection between MO6 and M'O6 octahedra, etc) have been reported for the
  compounds [12–27].
In order to elucidate the detailed crystal structures and magnetic properties of 12L-perovskites  , we selected the Ba2La2MW2O12 (M = Co, Mn, Ni, Zn) [17, 18, 24, 25, 27] containing magnetic M cations and two kinds of A cations (Ba and La). Some results about magnetic measurements are common to a recent work by Rawl et al [27]; thus, in this paper, we will mainly report the crystal structure determined by the neutron diffraction (ND) measurements, and results of additional analysis of magnetic data and DFT calculations in detail.
Experimental
Sample preparation
The title compounds Ba2La2MW2O12 were prepared as polycrystalline samples by the solid-state reaction. For M = Co, Ni, Zn samples, BaCO3, La2O3 (dried at 900 °C, 12 h), CoO, NiO, ZnO and WO3 were used as starting materials. The mixture with the stoichiometric metal ratio was pressed into pellets, and heated at 900 °C 12 h, 1100 °C 12 h, and 1200 °C 12 h × 2–3 with intermediate grindings and pelletizings. For M = Mn sample, BaO, La2O3 (dried), MnO, and WO3 were mixed and enclosed in a platinum tube in the glove box filled with Ar gas, and then it was sealed in an evacuated silica ampoule. This ampoule was heated at 1200 °C 3 h and then quenched by the liquid nitrogen. These samples contain small amounts (M = Mn:2.8 wt%; Co:1.2; Ni:0.4; Zn:0.2) of impurity phase (BaWO4).
Powder x-ray and ND measurements
The powder x-ray diffraction (XRD) measurements were performed at room temperature in the range 10° ⩽ 2θ ⩽ 120° using a 2θ step size of 0.02° with Cu-Kα radiation on a Rigaku MultiFlex diffractometer. In addition, powder ND profiles were collected at room temperature. For M = Ni, the ND measurement (the neutron wavelength λ = 1.848 43 Å) was performed by HERMES [31], installed at the JRR-3M reactor in Japan Atomic Energy Agency (JAEA), Tokai. For M = Zn, the time-of flight neutron diffraction (TOF-ND) by Super HRPD (BL08), installed at the Material and Life Science Experimental Facility (MLF) of the Japan Proton Accelerator Research Complex (J-PARC). All the data were analyzed by the Rietveld technique by using the program RIETAN-FP [32] for both XRD and ND, and the Z-code program package [33, 34] for the TOF-ND. The crystal and magnetic structures were drawn by the VESTA program [35].
Magnetic susceptibility and specific heat measurements
Magnetic measurements were carried out by a SQUID magnetometer (Quantum Design, MPMS-5S). The temperature dependence (1.8–400 K) of magnetic susceptibility was performed in both zero-field-cooled (ZFC) and field-cooled (FC) conditions, and the field dependence (0–9 T) of magnetization was also measured at 1.8 K.
The specific heat measurements were carried out in the temperature range 1.8–300 K by using a relaxation technique with a commercial physical property measurement system (Quantum Design, PPMS) in an applied field of 0 or 5 T. The sintered sample in the form of a pellet was mounted on a thin alumina plate with Apiezon N grease for better thermal contact.
DFT calculation and UV–vis diffuse reflectance spectra
Calculations of the electronic structure and the density of states (DOS) were performed using the WIEN2k program package [36]. This program employs the full-potential linearized augmented plane wave + local orbitals (FP-LAPW + lo) method based on density functional theory (DFT). We used the modified Becke–Johnson (mBJ) exchange potential + local density approximation (LDA)-correlation [37]. In the calculations, the convergence parameter was set to be RMTkmax = 7.0, and the muffin–tin (MT) spheres are RMT (in unit of bohr) = 2.39–2.50 (for Ba), 2.41–2.50 (La), 2.20 (Mn), 1.98 (Ni), 2.11 (Zn), 1.77–1.86 (W), and = 1.52–1.60 (O). We used 10 × 10 × 10 meshes with 170 k points in the first Brillouin zone. Some illustrations for the spin density distribution are drawn by the VESTA program [35]. In order to compare calculated and optical band gaps, UV–vis diffuse reflectance spectra were measured with a V–570 instrument (JASCO).
Results and discussion
Synthesis and crystal structure
The Ba2La2MW2O12 (M = Mn, Co, Ni, and Zn) compounds were prepared as the perovskite-related phase. The XRD profiles are shown in figure 1 (M = Ni and Zn) and figure S1 (stacks.iop.org/JPhysCM/29/365802/mmedia) (Mn and Co). They are well indexed by a hexagonal unit cell (a = ~5.7 Å, c = ~27.4 Å) with a rhombohedral symmetry, and corresponding to earlier reports for Ba2La2MW2O12 compounds [17, 18, 24, 25, 27]. In these reports, the space group R − 3m (No. 166) was applied for the structural analysis (table S1). The Rietveld analysis of XRD data using this R − 3m model apparently gives a good result; however, we have used a different model with the space group R − 3 (No. 148) based on the results of ND measurements as will be described below. The refined parameters determined by XRD are listed in table S2.

Figure 1. Powder XRD profiles for (a) Ba2La2NiW2O12 and (b) Ba2La2ZnW2O12. Upper and lower vertical marks mean the Bragg peak positions of main and impurity (BaWO4) phases, respectively.
Download figure:
Standard image High-resolution imageIn order to obtain more detailed structural information of Ba2La2MW2O12 such as the space group, ordered/disordered arrangement of Ba/La ions, and possibility of oxygen ion defects, we have performed the ND measurements for M = Ni and Zn compounds. Figure 2 shows the ND profile of Ba2La2NiW2O12 at room temperature. We first tried to analyze the data by using the R − 3m space group as a starting structural model; however, this trial ended in failure because of the significant disagreement between observed and calculated peak intensities although each calculated Bragg peaks were appropriately located at observed peak positions. This result indicates that Ba2La2NiW2O12 has a different symmetry or atomic positions. From this aspect, we tested the subgroups of R − 3m for the structural analysis and finally found that the space group R − 3 (No. 148) is adequate. The calculated profile of the R − 3 model is plotted in figure 2 and shows a good agreement with the observed profile. The refined structural parameters are listed in table 1. This model is also used for the analysis of isostructural 12L-perovskites A3LaNb3O12 (A = Sr, Ba) [38] and Sr3NdNb3 – xTixO12 – δ [39]. The specific difference between these two models is that anions (O1 and O2) occupy different crystallographic sites. In contrast, those of metal sites are almost unchanged (see tables 1 and S2). Figure 3 shows the comparison of these models for XRD and ND calculated profiles. For the XRD measurements, both models bring about similar calculation profiles since the atomic scattering factor of oxygen ion is much smaller than those of metal ions in Ba2La2MW2O12. The R − 3 model is well supported by the TOF-ND measurement for M = Zn shown in figure 4. From the Rietveld analysis of both ND and TOF-ND data, the Ba2+ and La3+ ions adopt fully ordered arrangement unlike some earlier reports [18, 25, 27] (see figure S2) and there are no oxygen defects within the standard deviation. The structural parameters for Ni and Zn compounds are summarized in table 1.
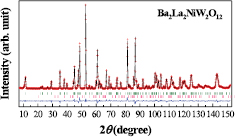
Figure 2. Powder ND profile for Ba2La2NiW2O12. Upper and lower vertical marks mean the Bragg peak positions of main and impurity (BaWO4) phases, respectively.
Download figure:
Standard image High-resolution imageTable 1. Structural parameters for Ba2La2NiW2O12 and Ba2La2ZnW2O12 determined by the powder ND measurement.
| Atom | Site | x | y | z | B/Å2 |
|---|---|---|---|---|---|
| Ba2La2NiW2O12 at room temperature, space group R − 3; a = 5.6595(3) Å, c = 27.3387(13) Å, Rwp = 5.74%, Rp = 4.56%, Re = 3.21%, RB = 1.15%, RF = 0.55% | |||||
| Ba | 6c | 0 | 0 | 0.132 91(13) | 0.36(8) |
| La | 6c | 0 | 0 | 0.293 46(9) | 0.50(6) |
| Ni | 3a | 0 | 0 | 0 | 0.44(7) |
| W | 6c | 0 | 0 | 0.418 89(14) | 0.40(8) |
| O1 | 18f | 0.4644(4) | 0.4705(5) | 0.118 09(6) | 0.75(5) |
| O2 | 18f | 0.4319(4) | 0.4559(5) | 0.294 79(8) | 0.72(6) |
| Ba2La2ZnW2O12 At room temperature, space group R − 3; a = 5.686 87(1) Å, c = 27.390 90(4) Å, Rwp = 6.82%, Rp = 5.55%, Re = 4.13%, RB = 3.06%, RF = 10.2% | |||||
| Ba | 6c | 0 | 0 | 0.133 31(3) | 0.44(2) |
| La | 6c | 0 | 0 | 0.292 90(2) | 0.53(1) |
| Zn | 3a | 0 | 0 | 0 | 0.50(2) |
| W | 6c | 0 | 0 | 0.419 03(3) | 0.25(1) |
| O1 | 18f | 0.461 99(9) | 0.469 68(10) | 0.118 13(1) | 0.75(1) |
| O2 | 18f | 0.425 48(8) | 0.451 25(10) | 0.294 46(2) | 0.81(1) |
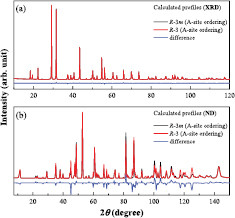
Figure 3. (a) XRD and (b) ND profiles calculated for Ba2La2NiW2O12. Black and red lines represent the profiles calculated by the space group R − 3 m and R − 3 with an ordered A-site arrangement, respectively, and blue line means the difference between them.
Download figure:
Standard image High-resolution image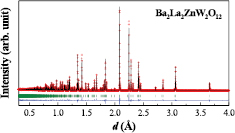
Figure 4. Time-of-flight powder ND profile for Ba2La2ZnW2O12. Vertical marks mean the Bragg peak positions.
Download figure:
Standard image High-resolution imageFigure 5(a) illustrates the schematic crystal structure of Ba2La2MW2O12. In this structure, M and W ions occupy different octahedral sites, and these octahedra connect with each other by sharing the corner oxygen ion. They construct a perovskite (or a double-perovskite like) block in ab plane. The La and Ba ions locate in this block and between blocks, respectively. The connection of MO6 and WO6 is slightly tilted due to the loss of mirror planes in the R − 3 structure shown in figure 5. In the view of magnetism, the magnetic M ions form a triangular lattice in ab plane. This lattice stacks along the c axis with a translational operation (+2/3, +1/3, +1/3) reflecting a rhombohedral symmetry.
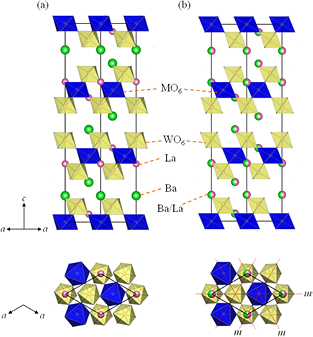
Figure 5. Schematic crystal structures of Ba2La2MW2O12 and the comparison between two structural models: (a) space group R − 3 with an ordered A-site arrangement in this study and (b) R − 3 m with a disordered one in earlier reports. In lower illustrations, only one perovskite block (z = 0.54–0.79) is drawn, and the red lines mean the mirror (m) planes.
Download figure:
Standard image High-resolution imageThe bond lengths calculated by the obtained structural parameters are summarized in table 2. The bond valence sums (BVSs) are also calculated and shown in this table. The BVS values suggest that the valence states of cations are represented as 
Table 2. Selected bond lengths (Å) and BVSs for Ba2La2NiW2O12.
| Ba2La2NiW2O12 ND, RT | Ba2La2ZnW2O12 TOF-ND, RT | Ba2La2MnW2O12 XRD, RT | Ba2La2CoW2O12 XRD, RT | |
|---|---|---|---|---|
| Ba–O1 × 3 | 2.677(2) | 2.6819(5) | 2.722(18) | 2.697(14) |
| Ba–O1 × 3 | 2.805(3) | 2.8090(8) | 2.843(10) | 2.818(8) |
| Ba–O1 × 3 | 3.041(2) | 3.0663(5) | 3.082(19) | 3.048(14) |
| Ba–O2 × 3 | 3.134(4) | 3.1530(8) | 3.146(10) | 3.187(8) |
| Average Ba–O | 2.914(3) | 2.9275(6) | 2.948(14) | 2.937(11) |
| BVS(Ba) | 2.17 | 2.12 | 1.93 | 2.08 |
| La–O2 × 3 | 2.515(2) | 2.4965(4) | 2.454(12) | 2.453(10) |
| La–O2 × 3 | 2.645(3) | 2.6713(6) | 2.682(10) | 2.610(8) |
| La–O2 × 3 | 2.716(3) | 2.7181(6) | 2.741(11) | 2.689(8) |
| La–O1 × 3 | 3.150(2) | 3.1968(6) | 3.279(12) | 3.240(10) |
| Average La–O | 2.756(2) | 2.7707(6) | 2.789(11) | 2.753(9) |
| BVS(La) | 2.71 | 2.71 | 2.80 | 3.02 |
| M–O2 × 6 | 2.068(2) | 2.0939(5) | 2.175(10) | 2.145(8) |
| BVS(M) | 1.96 | 2.09 | 2.12 | 1.77 |
| W–O1 × 3 | 1.843(3) | 1.8437(7) | 1.822(10) | 1.850(8) |
| W–O2 × 3 | 2.013(3) | 2.0155(8) | 1.976(10) | 1.984(8) |
| Average W–O | 1.928(3) | 1.9296(7) | 1.899(10) | 1.917(8) |
| BVS(W) | 5.98 | 5.96 | 6.43 | 6.11 |
Magnetic properties
Magnetic susceptibilities of Ba2La2MW2O12 (M = Mn, Co, Ni).
Figure 6 shows the temperature dependence of the inverse magnetic susceptibilities ( ) for Ba2La2MW2O12 (M = Mn, Co, Ni). The ZFC data above 150 K were fitted by the Curie–Weiss law, and obtained effective magnetic moments (µeff) and Weiss constants (θ) are listed in table 3. The µeff values for M = Mn and Ni compounds are close to the spin only values of M2+ ion (
 ). On the other hand, for M = Co the µeff is much larger than
  = 3.87 µB (3d7; S = 3/2) which is attributed to the orbital angular momentum derived from the degeneracy of t2g orbital [40]. The Weiss constants (θLT) were also calculated by using lower temperature data below 30 K (table 3), which is for excluding the influence from the slight curvature of
  versus T plot due to the magnetic excited state and crystal field effect, etc. The negative (M = Mn) and positive (Co and Ni) θLT values suggest that the dominant magnetic interaction between M2+ ions are antiferromagnetic and ferromagnetic, respectively.
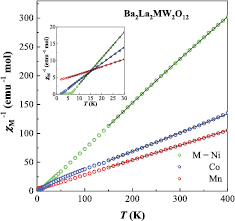
Figure 6. Temperature dependence of the inverse magnetic susceptibility for Ba2La2MW2O12 (M = Mn, Co, Ni, Zn). Solid lines mean the fitting curves by the Curie–Weiss law.
Download figure:
Standard image High-resolution imageTable 3. Effective magnetic moment(µeff), Weiss constant(θ) and transition temperature (TN, TC) for Ba2La2MW2O12.
| M | µeff/µB |  /µB /µB |
θ/K | θLT/K | TN, TC/K |
Ref. |
|---|---|---|---|---|---|---|
| Mn | 5.75(1) | 5.92 | −17.2(8) | −17.6(2) | <1.8 (AF) | This study |
| 6.05 | 5.92 | −16.6 | [24] | |||
| 5.73 | 5.92 | −10.7 | 1.7 (AF) | [27] | ||
| Co | 5.08(1) | 3.87 | −17.1(9) | 1.25(11) | 1.3 (F) | This study |
| 5.19 | 3.87 | −22.6 | 1.6 | 1.28 (F) | [27] | |
| Ni | 3.06(1) | 2.83 | 13.1(3) | 6.04(2) | 6.2 (F) | This study |
| 3.19 | 2.83 | 25.5 | 6.2 (F) | [27] | ||
aMagnetic moments of M2+ (spin-only values). bAF: antiferromagnetic, F: ferromagnetic.
Magnetic transition of Ba2La2MnW2O12.
The temperature dependence of specific heat and the field dependence of magnetization at 1.8 K for Ba2La2MnW2O12 are plotted in figures 7 and 8, respectively. In this compound, the magnetic transition was not observed down to 1.8 K. The specific heat divided by temperature (Cp/T) shows an upturn with decreasing temperature in contrast to the data of diamagnetic Ba2La2ZnW2O12. This result suggests an onset of magnetic transition occurs at lower temperatures. The magnetization at 1.8 K varies linearly against the magnetic field and does not saturate even at 5 T, which indicates that the magnetic ground state is antiferromagnetic. These results are corresponding to an antiferromagnetic transition at 1.7 K determined by Rawl et al [27].
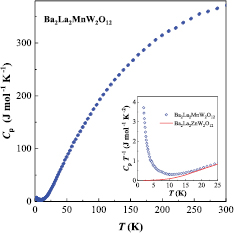
Figure 7. Temperature dependence of the specific heat (Cp) for Ba2La2MnW2O12. Inset shows the specific heat divided by temperature (Cp/T) for Ba2La2MnW2O12 (blue open circle) and Ba2La2ZnW2O12 (red line) at low temperatures.
Download figure:
Standard image High-resolution image
Figure 8. Field dependence of the magnetization (M) at 1.8 K for Ba2La2MnW2O12 (M = Mn, Co, Ni).
Download figure:
Standard image High-resolution imageMagnetic transition of Ba2La2CoW2O12.
Figure 9 represents the temperature dependence of specific heat for the Co compound in an applied field of 0 and 5 T. A sharp anomaly is observed at 1.3 K indicating the occurrence of long-range magnetic ordering, and this anomaly is broadened and shifted to 5 K by applying the magnetic field. This result suggests that the observed anomaly is attributed to not an antiferromagnetic transition but a ferromagnetic one. In fact, the field dependence of magnetization (figure 8) shows a rapid increasing in a small magnetic field region and a saturation behavior (2.2 µB) above ~2 T. In order to obtain further information of this transition, the temperature dependence of magnetic entropy (Smag) is calculated and plotted in figure 9. Here, the Smag is obtained by  in which the Clat means the lattice contribution of specific heat and the specific heat data of Ba2La2ZnW2O12 are used for this contribution. Above ~5 K the Smag is converged to 5.5 J mol−1 K−1, which is close to R ln 2 = 5.76 J mol−1 K−1 (R: gas constant). This result indicates that the ground doublet state of Co2+ ion brings about this ferromagnetic transition.
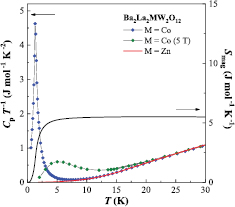
Figure 9. Temperature dependence of the specific heat divided by temperature (Cp/T) and magnetic entropy (Smag) for Ba2La2CoW2O12.
Download figure:
Standard image High-resolution imageMagnetic transition of Ba2La2NiW2O12.
The temperature dependence of specific heat for Ni compound is plotted in figure 10, and an anomaly is found at 6.2 K. This anomaly agrees with the magnetic transition observed in the inverse magnetic susceptibility (inset in figure 6). Thus, the ferromagnetic ordering of Ni2+ ions occurs below TC = 6.2 K. From the magnetization measurement (figure 8), it is found that this compound shows a magnetic hysteresis loop with a residual magnetization of 1.25 µB and gradual increasing toward 2 µB. The temperature dependence of Smag is calculated by the same way as Co compound and is also plotted in figure 10. The change of Smag due to this ferromagnetic transition is determined to be 8.90 J mol−1 K−1. This value is close to R ln 3 = 9.13 J mol−1 K−1 expected from the S = 1 ion with a spin degeneracy 2S + 1; therefore the magnetic moments of Ni2+ ions are fully ordered at 1.8 K. The characteristic shape of M–H curve and smaller residual magnetization than 2 µB may be due to the single-ion anisotropy of Ni2+ ion by using a polycrystalline sample.
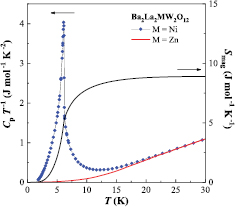
Figure 10. Temperature dependence of the specific heat divided by temperature (Cp/T) and magnetic entropy (Smag) for Ba2La2NiW2O12.
Download figure:
Standard image High-resolution imageUV–vis diffuse reflectance spectra
Figure 11 shows the UV–vis diffuse reflectance spectra of Ba2La2ZnW2O12 and Ba2La2NiW2O12. The absorption values were calculated from the reflectance data using the Kubelka Munk function given by

where R∞ is the reflectance [41]. The energy of the optical band gap was determined using the Tauc plot [42]. In these compounds, the photon energy (hν) is proportional to (F(R∞)hν)2 near the bottom of the conduction band. The optical band gaps for M = Zn and Ni compounds were determined to be 3.75 and 2.25 eV, respectively. For the latter compound, two additional peaks were observed around 3 eV in the Tauc plot.

Figure 11. Diffuse reflectance spectrum for (a) Ba2La2ZnW2O12 and (b) Ba2La2NiW2O12. The Tauc plots are shown.
Download figure:
Standard image High-resolution imageDFT calculation
Ba2La2ZnW2O12.
In order to verify the electronic structure of Ba2La2MW2O12 (M = Mn, Ni, Zn), we carried out the mBJ + LDA calculations. Figure 12 displays the energy dispersions and the total and partial densities of states (DOSs) for Ba2La2ZnW2O12. The occupied and unoccupied bands form a band gap of 3.0 eV around the Fermi level (EF). This value is smaller than the optical band gap of the UV–vis spectra, and this underestimation is generally shown in the DFT calculation.

Figure 12. (a) Energy dispersions and (b) the total and partial DOS for Ba2La2ZnW2O12. The zero energy is placed at the highest occupied state.
Download figure:
Standard image High-resolution imageThe valence bands (VBs) of Ba2La2ZnW2O12 demonstrates the hybridization between Zn 3d and O2 2p states over the broad range from −3.7 eV to EF. Below them, there exist further VBs dominated by the O 2p states; but the bonding orbital-like W 5d states are also situated in the same VBs indicating the W 5d–O 2p hybridization. Such bonding orbital-like 5d states are often found in hexavalent W oxides [43–45]. On the other hand, the bottom of conduction bands (CBs) in the narrow range from 3.0 to 3.8 eV mainly consists of W 5d and O1, O2 2p states. The dispersions reveal that the bottoms of CBs and the tops of VBs are located at the same points (L and F). This matching suggests that the ligand to metal charge transfer (LMCT)-type direct allowed transition (L → L and/or F → F) is predominant for the optical band gap observed in the UV–vis spectra.
Ba2La2MnW2O12.
Figure 13 displays the total DOS and the partial DOSs of total electrons of Ba, La, Mn, W, and O for Ba2La2MnW2O12. The rigid and narrow VBs are formed from Mn spin-up 3d states from −1.4 eV to EF and the CBs mainly consist of the W 5d and O1, O2 2p states between 0.8 to 1.9 eV; thus, the band gap is estimated to be 0.8 eV. Below the VBs of Mn spin-up states, there exist VBs consisting of O2 2p states between −5.8 and −2.6 eV and those consisting of W 5d and O 2p states between −6.1 and −8.3 eV.
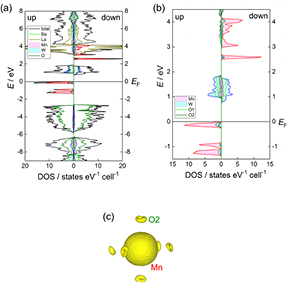
Figure 13. (a) The total and partial DOS for Ba2La2MnW2O12. (b) Enlargement plot for the partial DOS of Mn, W, O1, and O2. The zero energy is placed at the highest occupied state. (c) Spin density distributions in the central Mn ion and its ligands.
Download figure:
Standard image High-resolution imageThe results of DOSs reveal that the Mn ion is in the divalent state with the high-spin configuration because all the Mn spin-up 3d states are located below EF and the spin-down 3d states exist above 2.5 eV. The spin-polarized Mn 3d states and the O2 2p states hybridize with each other, and this hybridization yields very small spin polarizations of O2 2p states and W 5d states via O2, resulting in the reduction of Mn moments (4.2 µB). The spin density distribution around the central Mn ion and its ligands O2 is depicted in figure 13(c). The spin distribution for Mn 3d is isotropic and has spherical symmetry originated from the half-filled 3d states.
Ba2La2NiW2O12.
Figure 14 displays the total DOS and the partial DOSs of total electrons of Ba, La, Ni, W, and O for Ba2La2NiW2O12. The energy dispersions are shown in figure S3. The VBs consist of the Ni 3d sates from −1.3 eV to EF and the CBs are mainly formed from the W 5 d and O1, O2 2p states between 1.5 to 2.5 eV. These bands form a band gap of 1.5 eV around the Fermi level. This value is smaller than the optical band gap (2.25 eV) obtained from the UV–vis spectrum as with the case of Ba2La2ZnW2O12. The gap arises from the LMCT-type direct transition at the L and/or F points (figure S3).
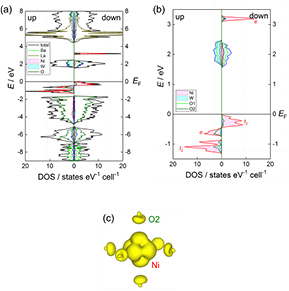
Figure 14. (a) The total and partial DOS for Ba2La2NiW2O12. (b) Enlargement plot for the partial DOS of Ni, W, O1, and O2. The zero energy is placed at the highest occupied state. (c) Spin density distributions in the central Ni ion and its ligands.
Download figure:
Standard image High-resolution imageBelow the narrow VBs (Ni 3d states) from −1.3 eV to EF, the bands consisting of O2 2p states are located from −4.8 to −1.6 eV. The forbidden bandwidth (0.3 eV) between them significantly decreases as compared to that for Ba2La2MnW2O12 (1.2 eV). This decreasing causes an enhancement of hybridization between the M 3d states and O 2p states and broadens 3d bands. The 3d bands for Ba2La2NiW2O12 below EF are slightly broader as compared with those of 3d bands for Ba2La2MnW2O12, and the contribution of O 2p states to the DOSs increase.
The partial DOSs in figure 14(b) show that all the spin-up 3d states and the t2-like spin-down 3d states exist below the EF level, and that the remaining e-like spin-down 3d states locate at around 3.2 eV. In fact, two peaks around 3 eV are observed in the UV–vis spectrum (figure 11), and they are considered to correspond with the Ni d–d transition from the t2 to e bands. These results also reveal that the Ni ion is in the divalent state. This compound has the magnetic moments of 1.8 µB per Ni atom and the magnetic moment is slightly smaller than the theoretical one because of the same reason for Ba2La2MnW2O12. The spin density distribution around the central Ni ion and its ligands O2 is depicted in figure 14(c) and the distribution for Ni 3d expands toward O2 sites, indicating that the spin density consists of the spin-up 3dx2−y2 and 3d3r2−z2 states.
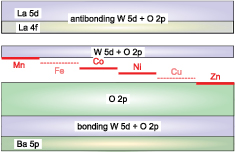
Summary of band structures of Ba2La2MW2O12.
The band structures of Ba2La2MW2O12 are summarized as follows. In general, the energy difference between M 3d and O 2p bands decreases with increasing the atomic number of M with the same valence. The energy schemes are depicted in figure 15. The M 3d bands are split by the effect of crystalline field and d–d coulombic repulsion. The hybridization between M 3d and O 2p states broaden the M 3d bands, and the hybridization increases in the order of Mn, Co, Ni, and Zn.
Figure 15. Schematic diagram of the band structure of Ba2La2MW2O12.
Download figure:
Standard image High-resolution image
Discussion about magnetic interaction in Ba2La2MW2O12 (M = Mn, Co, Ni)
The magnetic transition temperature of Ba2La2NiW2O12 is higher than that of Ba2La2MnW2O12, and the inversion of sigh of the magnetic interaction (J) occurs. In general, the superexchange interaction strongly depends on S (magnetic moment), U (d–d coulombic repulsion energy), Δ (charge transfer energy), and t (ligand p-metal d hybridization strength). For the 180° superexchange interaction pathway, the super exchange integral (J) is represented by the following equation [46],
This Zaanen–Sawatzky model is in good agreement with the experimental results for NaCl-type MO (M = Mn, Fe, Co, Ni). For the more general pathway, the exchange integral is given by J = (±)bond(t/SΔ)2Jp-d/2, where (±)bond and Jp-d are the sign depending on the orthogonality for the p-d bonding and the transfer integral between p and d states, respectively [47]. In the case of Ba2La2MW2O12, the complicated crystal structure and the contribution of W 5d states to J makes this discussion difficult; however, at least the difference in the orthogonality of superexchange and super-superexchange pathways will be correlated with the inversion of sigh of J. For Ba2La2MnW2O12, the pdσ bonding between Mn e states and O 2p states should play a key role in these magnetic interactions, while the pdπ bonding between Ni t2 states and O 2p states is important for Ba2La2NiW2O12. Furthermore, because J is proportional to t to the 4th power, the increase in t is considered to be attributable to the enhancement of J and the magnetic ordering temperature for Ba2La2NiW2O12. In the case of Ba2La2CoW2O12, the magnetic interaction between Co ions will be in the competed states between those of the Mn and Ni compounds.
Conclusions
The B-site defected 12L-perovskites Ba2La2MW2O12 (M = Mn, Co, Ni, Zn) having the 2D triangular lattice of M ions were synthesized, and their crystal structures were refined by XRD and ND measurements. These results revealed that they adopt a structural model with a space group R − 3, which is different from that in many earlier reports. The main differences between them are the layered cation ordering of A-site cations (Ba and La) and atomic positions of oxygen ions resulting in a small tilting of MO6 and WO6 octahedra along the c-axis. The M = Co and Ni compounds show a ferromagnetic ordering at 1.3 and 6.2 K, respectively, while the Mn compound are paramagnetic (T > 1.8 K) with an antiferromagnetic interaction. The DFT calculations were carried out using the structural model (R − 3), and the calculated band gaps are comparable to the results of the UV–vis spectra. From the band structures, the magnetic interaction between M ions is varied by the hybridization between M 3d and O 2p states.
Acknowledgment
This research was supported by Grant-in-aid for Scientific Research (C) (No. 15K05441, 16K05712) from the Japan Society for the Promotion of Science (JSPS). In addition, the ND experiment was approved by the Neutron Science Proposal Review Committee of J-PARC/MLF (Proposal No. 2016B0005) and supported by the Inter-University Research Program on Neutron Scattering of IMSS, KEK.