

Abstract
The β−-decay half-lives of extremely neutron-rich nuclei are important for understanding nucleosynthesis in the rapid neutron capture process (r-process). However, most of their half-lives are unknown or very uncertain, leading to the need for reliable calculations. In this study, we updated the coefficients in recent semi-empirical formulae using the newly updated mass (AME2020) and half-life (NUBASE2020) databases to improve the accuracy of the half-life prediction. In particular, we developed a new empirical model for better calculations of the β−-decay half-lives of isotopes ranging in Z = 10–80 and N = 15–130. We examined the β−-decay half-lives of the extremely neutron-rich isotopes at and around the neutron magic numbers of N = 50, 82, and 126 using either five different semi-empirical models or finite-range droplet model and quasi-particle random phase approximation method. The β−-decay rates derived from the estimated half-lives were used in calculations to evaluate the impact of the half-life uncertainties of the investigated nuclei on the abundance of the r-process. The results show that the half-lives mostly range in 0.001 < T1/2 < 100 s for the nuclei with a ratio of N/Z < 1.9; however, they differ significantly for those with the ratio of N/Z > 1.9. The half-life differences among the models were found to range from a few factors (for N/Z < 1.9 nuclei) to four orders of magnitude (for N/Z > 1.9). These discrepancies lead to a large uncertainty, which is up to four orders of magnitude, in the r-process abundance of isotopes. We also found that the multiple-reflection time-of-flight technique is preferable for precise mass measurements because its measuring timescale applies to the half-lives of the investigated nuclei. Finally, the results of this study are useful for studies on the β-decay of unstable isotopes and astrophysical simulations.
Export citation and abstract BibTeX RIS
1. Introduction
Heavy nuclei beyond iron are believed to be mainly produced via the rapid neutron capture process (r-process) [1, 2]. In this process, the (n, γ) and (γ, n) reactions produce extremely neutron-rich nuclei that are far away from the beta stability line, whereas the β decays shift the reaction flow back to the beta stability and synthesize heavier elements. The neutron capture can be impeded by the (n, γ)–(γ, n) equilibrium [3–5]. Under equilibrium conditions, nucleosynthesis is obstructed and awaits the β− decays at the relatively long-lived isotopes, which are referred to as waiting points [6–8], leading to large contributions of these so-called waiting points in the r-process isotopic abundance. This mechanism is believed to form the first, second, and third peaks at approximately A ≈ 90, 130, and 195 corresponding to the neutron magic numbers of N = 50, 82, and 126, respectively, in the Solar System [9–16]. Together with the (n, γ) and (γ, n) reaction rates, the half-lives of extremely neutron-rich nuclei, especially for the waiting points, would provide better insights into the astrophysical scenarios of the r-process. For instance, Niu et al [17] found that the nucleosynthesis in the region of 20Ca–50Sn can be expanded up to 14 neutrons if the β-decay half-lives based on the RHFB + QRPA (relativistic Hartree–Fock–Bogolyubov combined with quasiparticle random-phase approximation) model [18, 19] are used in the r-process calculations, whereas the reaction flows are extended up to only four neutrons when the half-lives in references [20, 21] were used in the simulations. In another study, Mumpower et al indicated that the abundance of 140Te is decreased by a factor of eight if the β−-decay rate of 140Te is increased by a factor of 10 [22]. The final abundance of isotopes at approximately A ≈ 130 was also found to be decrease by approximately 35% owing to the decrease in the β−-decay rate of 128Ru [23].
Although the r-process calculations are very sensitive to nuclear inputs, the nuclear mass and β−-decay half-lives of unstable isotopes far from the beta stability are still unknown and/or uncertain. The fundamental properties of exotic nuclei have been accessed using modern radioactive-ion beam facilities [24–30]. For example, the half-lives of 55 extremely neutron-rich isotopes from  to
to  were measured by Wu et al at the Radioactive Isotope Beam Factory, RIKEN [28]; Benzoni et al [29] measured the half-lives of the 219Bi and 211–213Tl isotopes at GSI [30]. Using the same facility for bismuth and thallium, the half-lives of 22 isotopes from
  to
to  were measured by Ameil et al [31]. However, large uncertainties exist, up to 70%, as observed in references [28, 29, 31], in the experimental data owing to difficulties (that is, large statistical and system errors) in measurements. Additionally, owing to the short lifetimes of isotopes compared to measuring timescales, small production cross sections, challenges in radioactive-ion beam production, etc, the number of measurements is very limited, although numerous isotopes are required for the calculations of the astrophysical network. This leads to the need for reliable theories for half-life predictions of exotic isotopes, especially for isotopes close to the proton and neutron drip lines.
Since the weak interaction was first developed by Fermi in the 1930s, many attempts have been made to improve the accuracy of half-life predictions. For instance, the gross theory was proposed to calculate the β-decay strength functions and half-lives of the nuclei from 8Li to 280Fm, where the giant resonance effect and both allowed and first forbidden transitions are considered [32–34]. Recently, the quasiparticle random-phase approximation (QRPA) [35–38] has emerged as a good microscopic approach for the estimation of half-lives. In this approach, the β-decay strength function is calculated using the folded-Yukawa single-particle potential based on the Gamow–Teller strength and nucleon–nucleon interaction. It should be emphasized that both the gross and QRPA theories and other theoretical calculations are very complicated, model dependent, and time consuming. However, large discrepancies still exist, which are up to 3–4 orders of magnitude, compared to the measured half-lives [32, 39, 40]. Hence, many semi-empirical models have been developed as alternative methods for estimating the half-lives of nuclei far from the beta stability. Recently, various models have been proposed by Surman et al [41], Zhang et al [42, 43], and Zhou et al [44], which are based on the power function of the β-decay energy, originating from the Sargent law [45]. These models are simple in calculations; however, they strongly depend on the β-decay Q-values of isotopes. Additionally, because the coefficients in the semi-empirical models are determined by fitting the formulae to well-known experimental data, their values can be changed using the updated measured data. For instance, among the mentioned semi-empirical approaches, the power function proposed by Surman et al is the simplest formalism for the estimation of half-lives but the coefficient values were determined mostly two decades ago, which may have caused a large uncertainty in the prediction. Hence, it is necessary to re-examine the coefficients of the formulae.
In the present study, we examined the coefficients of the aforementioned semi-empirical formulae using newly updated half-life (NUBASE2020 [46]) and mass (AME2020 [47]) databases to improve the half-life calculations. We also developed a new semi-empirical model for better half-life prediction. The reliability of these approaches was evaluated by comparing their results with the new QRPA calculation in reference [40] and experimental data where available. Together with the newly developed formula, the recent models proposed by Surman et al, Zhang et al, and Zhou et al with the new coefficients were employed to predict the β−-decay half-lives of the extremely neutron-rich nuclei around the magic neutron numbers of N = 50, 82, and 126. Finally, we evaluated the impact of the β−-decay rate uncertainties of the investigated neutron-magic nuclei on the final r-process abundance using the estimated half-lives. Here we only investigate the effect of the β−-decay rates. The influence of other factors such as nuclear mass, neutron capture cross section, β-delayed neutron emission, and so on will be studied in future works.
The remainder of this paper is organized as follows. The theoretical framework for the semi-empirical formulae and isotopic abundance calculations are described in section 2. The results of the updated and newly developed formulae, half-lives of the considered isotopes, and final r-process abundance are discussed in section 3. Finally, a summary of this study is provided in section 4.
2. Theoretical framework
2.1. β−-decay half-life
Based on the Sargent law [45], the β-decay half-lives (T1/2) are proportional to the fifth power of the β-decay Q-values (Qβ
) as  . Using this law, several semi-empirical formulae [42–44] have been developed by fitting experimental data to the known isotopes detected in modern radioactive-ion beam accelerator facilities. Among them, a simple power function of the difference in binding energies, Eb(Z + 1, A − 1) and Eb(Z, A), between the daughter and mother isotopes was proposed more than 20 years ago by Surman et al as [41]

where a and α are the fitting parameters, which were determined by the best fit of the available experimental half-lives to the known isotopes.
The β−-decay energy, Qβ , was calculated in terms of the binding energies as [40]

The half-life in equation (1) can be calculated in terms of the β−-decay energy as

where ΔnH = (Mn − MH)c2 ≈ 0.782 27 MeV is the difference in the masses of the neutron (Mn) and hydrogen atom (MH). The coefficients a = 250 and α = −3.80 were determined by fitting available experimental half-lives in 1997 to well-measured isotopes [41].
In a previous study conducted by Zhang et al [43], the β−-decay half-life was proposed as a function of the atomic (Z) and neutron (N) numbers, which is given by

where a1 = 2.65 × 10⁻⁴, a2 = −0.2275, a3 = 0.3652, and a4 = −0.8852 were obtained based on the measured data of 351 isotopes far from the beta stability [43].
Because the nuclear structure of isotopes also impacts decay properties of nuclei [48, 49], the half-life calculation was developed by adding the shell correction into the F1 formula to obtain [43]

where the shell correction is given by
with a1 = 3.37 × 10⁻⁴, a2 = −0.2588, a3 = 0.4028, a4 = −1.01, a5 = 0.9039, and a6 = 7.7139 [43]. Notice that the numbers (29, 50, ...) in the Gaussian functions of equation (6) were proposed by Zhang et al [43] as the centers, which locate in the vicinity of the closed-shells at N (or Z) = 28, 50, 82, and 126, of the Gaussian distribution of the difference (log( )) between the calculated half-lives and experimental data.
Recently, Zhou et al [44] improved the half-life prediction by taking both the pairing effect and Q-value dependence in the calculation as

where Z, N, and A are the atomic, neutron, and mass numbers of the β emitters, respectively; δ = (−1)Z + (−1)N is the even–odd staggering which reflects the pairing effects on the β-decay half-lives against the Q-values; α = 1/137 denotes the fine structure constant; and S(Z, N) is the shell correction energy of the mother nucleus, which is given by
The parameters ai (i = 1, 2, 3, ..., 9) = 3.016, 3.879, 1.322, 6.030, 1.669, 11.09, 1.07, −0.935, and −5.398 in the equations above were deduced by fitting all the available experimental half-lives to nuclei far from the stability line [44]. Again, the numbers in the Gaussian functions are related to the closed-(sub)shells of protons (Z) or neutrons (N) at which the difference between the theoretical results and experimental data becomes maximum [44].
Because the coefficients in the aforementioned formulae were determined a long time ago, they must be updated for better β−-decay half-life prediction. Hence, in this study we used the measured half-lives and β−-decay Q-values of neutron-rich isotopes, whose atomic and mass numbers range in Z = 10–80 and A = 25–210 taken from the newly updated lifetime and mass databases, NUBASE2020 [46] and AME2020 [47], respectively, to update the new values of these coefficients. To validate the new parameter sets of the semi-empirical formulae, we considered the standard deviation (root-mean-square, rms, in decimal logarithm) between the calculated (T1/2i
) using equation (3) and experimental ( ) half-lives. The deviation is defined as

where n is the number of isotopes investigated.
By using the new values of the coefficients in the aforementioned semi-empirical formulae, we predicted the unmeasured half-lives of the neutron-rich nuclei at N = 50, 82, and 126, which are considered to be the waiting points related to the first, second, and third peaks in the r-process isotopic abundance.
2.2. Astrophysical implication
The simulations for the r-process depend on both the nuclear property inputs and astrophysical conditions [50]. The β−-decay rate of isotopes far from the β-stable line is one of the most important inputs that significantly affect the final abundance of isotopes [22, 50, 51]. The astrophysical conditions of the simulations depend on the sites of the r-process. Presently, although many sites are considered to be appropriate for describing the r-process, concluding the best astrophysical site is still ambiguous owing to complications in the r-process mechanism [5, 52]. However, neutrino-driven winds under high entropy conditions, namely high entropy winds (HEWs), surrounding proto-neutron stars born in type II supernovae are considered to be a popular environment for the main r-process [53–59]. Under such a scenario, an adiabatic expansion of the HEW bubble occurs, leading to changes in temperature, neutron densities, seed nuclei abundance, matter density, etc.
The main nuclear processes important in the r-process are (n, γ) and (γ, n) reactions, β decays, and β-delayed neutron emission [22, 50]. Hence, these processes are considered in the calculations of the change in the abundance of an isotope (Z, A) in the full network of the r-process. The change in the isotopic abundance, Y(Z, A), of the (Z, A) isotope is given by [22]
where λnγ , λγn , λβn , and λβxn are the rates of neutron capture (n, γ), photodisintegration (γ, n), β decay, and β decay followed by emission of x(=1, 2, 3) neutron(s), respectively.
As the nuclear inputs for the r-process simulations, the astrophysical rates of the (n, γ) and (γ, n) reactions were calculated based on the statistical Hauser–Feshbach model [60] using the TALYS code [61]. The rates of the β decays of exotic isotopes, except for the investigated nuclei in the present study, and β-delayed neutron emission (up to three neutrons) were taken from reference [62]. The initial conditions (i.e., neutron-to-seed ratio, mass density, temperature, etc) of the HEW were obtained from the results of the study by Farouqi et al [63]. To examine the impact of the β-decay rates of extremely neutron-rich isotopes on the r-process abundance, the half-lives calculated using the semi-empirical approaches mentioned above were used in the calculations.
3. Results and discussion
3.1. Update of the coefficients of the semi-empirical formulae
To examine the reliability of the formulae, we employed the experimental data of the half-lives (NUBASE2020 [46]) and β−-decay energies (AME2020 [47]) of 362 neutron-rich isotopes ranging in Z = 10–80 and N = 15–130, including 85 even–even, 85 even–odd, 95 odd–even, and 97 odd–odd nuclei. For the Surman model (equation (3)), the updated fitting coefficients (a and α) and standard deviations between the calculated and measured half-lives are presented in table 1. The deviations are approximately 0.392 and 0.615 for 85 even–even and 97 odd–odd nuclei, respectively. The deviations are almost the same (0.430 and 0.451) for the 85 odd–even and 95 even–odd nuclei but larger (or smaller) than those for the even–even (or odd–odd) isotopes. That is, the difference between the half-lives determined by predictions and measurements for even–even nuclei is smaller than that for the odd–odd isotopes. The differences in the deviations between the even–even, odd–even, even–odd, and odd–odd isotopic groups can be understood by the pairing effect on the β−-decay half-life, which was addressed in previous studies [40, 64–66]. Because the pairing correction is not considered in the present semi-empirical model, the more significant effect of the nuclear pairing on the odd–odd nuclei should result in a larger deviation between the estimated and measured half-lives compared to the case of even–even nuclei.
Table 1. Coefficients of a and α in equation (3) determined by fitting measured half-lives and β−-decay Q-values taken from the NUBASE2020 [46] and AME2020 [47] databases of 362 isotopes. The deviations (rms, in logarithmic scale) between the calculated and measured half-lives are deduced using equation (4).
| Z–N | n | a | α | rms |
|---|---|---|---|---|
| Even–even | 85 | 228.031 ± 74.793 | −3.508 ± 0.106 | 0.392 |
| Odd–even | 85 | 2464.948 ± 296.432 | −4.202 ± 0.194 | 0.430 |
| Even–odd | 95 | 4370.095 ± 187.806 | −4.349 ± 0.313 | 0.451 |
| Odd–odd | 97 | 1219.860 ± 282.239 | −3.252 ± 0.280 | 0.615 |
| All nuclei | 362 | 570.974 ± 93.722 | −3.288 ± 0.106 | 0.601 |
In figure 1, we compare the predicted half-lives to those measured in laboratories. As seen in panel (a), the calculated half-lives based on the new values of the a (570.974) and α (−3.288) coefficients are mostly less than one order of magnitude different from the measured data for all 362 isotopes. In contrast, the predicted half-lives based on the old values of the coefficients (a = 250 and α = −3.8) differ by up to three orders of magnitude from those obtained in the experiments. With the present coefficients of a and α, the deviations between the estimated and measured half-lives can be achieved as rms = 0.601, which is drastically improved as compared to that of rms = 0.950 based on the old values of a and α in reference [41] (table 3). Additionally, the differences between the calculations based on the FS formula and measured half-lives are less than one order of magnitude for the specific even–even (panel (b)), odd–A (panel (c)), and odd–odd (panel (c)) isotopic groups. These results indicate that the semi-empirical formula in equation (3) with the updated values of the coefficients can better reproduce the experimental data as compared to results based on the previous values determined by Surman et al in reference [41].

Figure 1. The ratio (in logarithmic scale) of the calculated half-lives to those measured in laboratories for all the investigated (panel (a)), even–even (panel (b)), even–odd or odd–odd (panel (c)), and odd–odd (panel (d)) nuclei. The filled circle and opened triangle symbols show the results based on the new set of coefficients in table 1. The opened square symbols are shown for the ratios based on the 'old' values of a = 250 and α = −3.8 in reference [41].
Download figure:
Standard image High-resolution imageFor the F1, F2, and F3 models, by fitting the same set of Qβ and half-lives of 362 isotopes taken from AME2020 and NUBASE2020 as for FS, we determined the new coefficients as presented in table 2. To examine the reliability of the FS, F1, F2, and F3 formulae and the microscopic–macroscopic approach known as finite-range droplet model and quasi-particle random phase approximation (FRDM + QRPA) model [40], we compared the standard deviations (rms) between the calculated half-lives and the experimental data in NUBASE2020. Table 3 presents the standard deviations between the theoretically calculated half-lives and the experimental data reported in the NUBASE2020 database [46].
Table 2. New values of the coefficients in the F1, F2, and F3 determined by fitting measured half-lives and β−-decay Q-values taken from the NUBASE2020 [46] and AME2020 [47] databases of 362 isotopes. The deviations (rms, in logarithmic scale) between the calculated and measured half-lives are deduced using equation (4).
| Coefficients | Model F1 | Model F2 | Model F3 |
|---|---|---|---|
| a1 | 0.000 28 | 0.000 38 | 3.6557 |
| a2 | −0.211 82 | −0.235 59 | 3.7281 |
| a3 | 0.319 11 | 0.350 67 | 0.8697 |
| a4 | 0.048 83 | −0.239 57 | 5.2747 |
| a5 | — | 0.918 46 | 0.9310 |
| a6 | — | 7.933 83 | 10.5573 |
| a7 | — | — | 0.4315 |
| a8 | — | — | −0.4827 |
| a9 | — | — | −3.1909 |
Table 3. Standard deviations determined by comparing the half-lives of 362 nuclei predicted using the semi-empirical and FRDM + QRPA [40] models to the experimental data in the NUBASE2020 database [46].
| Model | Previous works | This study |
|---|---|---|
| Formula FS | 0.950 | 0.601 |
| Formula F1 | 0.644 | 0.555 |
| Formula F2 | 0.581 | 0.472 |
| Formula F3 | 0.578 | 0.413 |
| FRDM + QRPA | 0.597 | — |
| New model FD | — | 0.392 |
The rms deviations based on the new values of the coefficients were found to be 0.555, 0.472, and 0.413 for the F1, F2, and F3 models, respectively. These deviations are much improved compared to those of 0.644, 0.581, and 0.578, which are based on the old values presented in the previous studies [43, 44] as presented in section 2. The results indicate that the new values of the coefficients in this study drastically enhance the accuracy in the β−-decay half-life predictions based on the semi-empirical models. As can be seen in figure 2, the uncertainty (log( )) distribution mostly ranges from −1 to 1. In other words, the theoretical half-lives differ by one order of magnitude from the experimental data. The half-lives based on the FS formula of the present study (rms = 0.601, panel (A)) are almost similar to those deduced using the FRDM + QRPA [40] (rms = 597, panel (E)); however, much worst than the calculations using the other formulae. Regardless of the new developed semi-empirical (FD, panel (F)), which is mentioned in the next section, the F3 formula (panel (D)) generates the smallest deviation. Among the semi-empirical models, only the Q-value (or Z, N dependence) was considered in the FS (or F1) model, whereas both of Q-value, asymmetry parameter (N − Z)/(N + Z), odd–even effect, and shell effect were taken in the F3 formula. Although the shell correction in the F2 model can improve the β−-decay half-life prediction (panel (C)), its results are still not good as those based on the F3 formula. The better prediction of the F3 formula reflects that not only the Q-value and shell effect but also the charge-asymmetry and odd–even effect strongly impact the β-decay half-life. On the other hand, the significant discrepancy between the theoretical calculation based on the macroscopic–microscopic FRDM + QRPA approach [40] and F2 and F3 results can be understood mainly due to the difference in modeling and β−-decay Q-value. Notice that the FRDM mass estimation differs by about 0.5 MeV from the measured data [40]. This deviation should result in a large deviation in the β−-decay half-life, which non-linearly depends on the Q-value [40, 45].

Figure 2. A 2D plot for the difference (right axis, in decimal logarithmic scale) between the calculated half-lives based on the FS (panel (A)), F1 (panel (B)), F2 (panel (C)), F3 (panel (D)), FRDM + QRPA (panel (E)), and FD (panel (F), which is mentioned in the next section) with new values of the coefficients and those measured in laboratories for all the investigated 362 nuclei. The statistical graphs on the right sides of each panel show the uncertainty distributions. The red curves are to guide the eyes for the Gaussian shape of the distributions.
Download figure:
Standard image High-resolution image3.2. Developed semi-empirical formula for β−-decay half-life
As discussed in the previous section, the best half-life prediction of the recent models differs from measurements by the smallest standard deviation of rms = 0.413 (in logarithmic scale) for the F3 formula. To reduce this discrepancy, we developed a novel semi-empirical formula, named as FD, which is based on the Surman and F3 models. Notice that these models exhibit the strong dependence of the half-life on the Q-value (FS model), shell effect, odd–even effect, and asymmetry (F3 model). In general, the experimental (or expected) data (ln T1/2) can be better reproduced by adding a correction factor (s) to the calculation results ( ) as
) as

When the calculation is based on the FS model in equation (3), equation (11) becomes

It is clearly shown in figure 1 that the values of  are drastically increased at and/or in the vicinity of the neutron (sub)shell-closures N = 28, 50, 82, and 110. Notice that the same phenomenon is also observed for the proton (sub)shell-closures Z = 20, 38, 50, 58, and 70. This is the evidence for significant impact of the shell closure on the half-life. Therefore, the shell effect (S(Z, N)) must be considered for the correction factor as s = S(Z, N). Because the trend of the change in the uncertainty mostly in a Gaussian distribution in the vicinity of the shell closures, the shell effect in terms of the Gaussian functions, which is similar to equation (8), is adopted in this development.
As analyzed in the previous section, the odd–even property influences the accuracy of the FS model, as shown in figure 1. Additionally, together with the Q-value, the odd–even effect in F3 reflects the paring of nucleons strongly impacts the half-life of nuclei. Hence, we considered the factor of δ = (−1)Z
+ (−1)N
in the second term of equation (12) as  . On the other hand, the discussed above and previous work [44] show that the charge-asymmetry I = (N − Z)/(N + Z) plays an important role in the β−-decay half-life. By comparing to the second term of the F3 model in equation (7), we can put α = a7
I so that the half-life depends on the charge-asymmetry, Q-value, and odd–even effect as
. On the other hand, the discussed above and previous work [44] show that the charge-asymmetry I = (N − Z)/(N + Z) plays an important role in the β−-decay half-life. By comparing to the second term of the F3 model in equation (7), we can put α = a7
I so that the half-life depends on the charge-asymmetry, Q-value, and odd–even effect as  . Taking this factor together with the shell effect correction into equation (12) and parameterizing the coefficients, a new semi-empirical formula can be developed as

where the form of S(Z, N) is given in equation (8) with five coefficients a1, a2, a3, a4, and a5; Qβ is in MeV; and T1/2 is in s. By fitting the same data set of the Q-value (in AME2020) and half-life (in NUBASE2020) to 362 well-measured isotopes as done in the previous section, eight coefficients of the proposed formula were determined as follows:


By using the developed model FD, the deviation between the calculated and measured half-lives was significantly reduced up to rms = 0.392, which is much better than that rms = 0.413 in the prediction of the F3 formula. The uncertainty,  , is mostly less than 0.75, as can be seen in the panel (F) of figure 2. This formula is valid for the isotopes in the same range of Z = 10–80 and N = 15–130 as for the aforementioned models. Moreover, although most of main impact factors of charge-asymmetry, Q-value, odd–even effect, and shell effect were taken into the calculation, the new model has a simpler formalism and less coefficients as compared to the F3 model. Hence, the FD formula emerges as a useful tool for the β−-decay half-life prediction.
3.3. β−-decay half-lives of neutron-rich nuclei in the vicinity of N = 50, 82, and 126
Because the β-decay rates of the extremely neutron-rich nuclei with N = 50 (Ca–Cu), 82 (Se–Ag), and 126 (Nd–Ir) are important for a better understanding of the r-process freeze-out phase, (n, γ)–(γ, n) equilibrium, r-process abundance, and unbound structure, we employed FS, F1, F2, F3, and FD to calculate the half-lives of the aforementioned isotopes. Tables 4–6 present the half-lives predicted using the five semi-empirical formulae. These results are compared to those obtained from the FRDM + QRPA calculation [40] and NUBASE2020 database, if available. We realized that half-lives are mostly less than 200 ms for the N = 50 and 82 isotopes and their neighbors, whereas they are less than 50 s for the N = 126 isotopic group.
Table 4. The β−-decay half-lives (in millisecond) of the N = 50 isotopes and their neighbors calculated using the FS, F1, F2, F3, and FD formulae are compared to those based on the FRDM + QRPA approach in reference [40] and experimental data in the NUBASE2020 database [46]. Notice that the Q-values (in MeV) are obtained from AME2020 [47] if available, otherwise they are obtained from the FRDM calculation [40]. (*) marks denote the extrapolated half-lives based on experimental data obtained from NUBASE2020.
| ID | Z | N | A | Qβ | FS | F1 | F2 | F3 | FD | Ref. [40] | Exp. |
|---|---|---|---|---|---|---|---|---|---|---|---|
| 1 | 20 | 50 | 70 | 23.51 | 4.0 | 1.3 × 10⁻¹ | 2.0 × 10⁻¹ | 1.6 | 1.2 × 10⁻² | 9.0 × 10⁻¹ | |
| 2 | 21 | 50 | 71 | 25.72 | 3.3 | 2.8 × 10⁻¹ | 4.6 × 10⁻¹ | 1.2 | 1.7 × 10⁻² | 9.0 × 10⁻¹ | |
| 3 | 22 | 50 | 72 | 20.24 | 6.8 | 6.1 × 10⁻¹ | 1.1 | 3.4 | 1.0 × 10⁻¹ | 2.0 | |
| 4 | 23 | 50 | 73 | 22.29 | 6.2 | 1.3 | 2.5 | 2.7 | 1.4 × 10⁻¹ | 1.9 | |
| 5 | 24 | 50 | 74 | 17.39 | 1.2 × 101 | 2.8 | 5.9 | 7.4 | 7.5 × 10⁻¹ | 5.9 | |
| 6 | 25 | 51 | 76 | 23.11 | 5.0 × 101 | 3.8 | 7.8 | 2.9 | 3.4 × 10⁻¹ | 2.9 | |
| 7 | 25 | 50 | 75 | 19.11 | 1.2 × 101 | 6.1 | 1.4 × 101 | 6.2 | 9.8 × 10⁻¹ | 4.4 | |
| 8 | 26 | 52 | 78 | 17.10 | 1.3 × 101 | 5.1 | 9.2 | 8.5 | 1.6 | 1.4 × 101 | |
| 9 | 26 | 51 | 77 | 18.58 | 1.4 × 101 | 8.2 | 1.8 × 101 | 7.5 | 1.5 | 1.2 × 101 | |
| 10 | 27 | 52 | 79 | 18.62 | 1.4 × 101 | 1.1 × 101 | 2.2 × 101 | 8.0 | 2.2 | 8.1 | |
| 11 | 26 | 50 | 76 | 15.07 | 2.0 × 101 | 1.3 × 101 | 3.2 × 101 | 1.6 × 101 | 4.6 | 2.1 × 101 | 3* |
| 12 | 27 | 51 | 78 | 19.56 | 8.8 × 101 | 1.8 × 101 | 4.3 × 101 | 8.2 | 2.5 | 5.9 | 11* |
| 13 | 28 | 52 | 80 | 13.44 | 3.1 × 101 | 2.4 × 101 | 5.1 × 101 | 3.3 × 101 | 1.4 × 101 | 5.6 × 101 | 30 ± 22 |
| 14 | 27 | 50 | 77 | 15.44 | 3.1 × 101 | 2.8 × 101 | 7.6 × 101 | 2.2 × 101 | 7.9 | 1.1 × 101 | 15 ± 6 |
| 15 | 28 | 51 | 79 | 14.25 | 4.4 × 101 | 3.8 × 101 | 1.0 × 10² | 3.7 × 101 | 1.5 × 101 | 5.9 × 101 | 44 ± 8 |
| 16 | 29 | 52 | 81 | 14.29 | 4.4 × 101 | 5.1 × 101 | 1.2 × 10² | 4.2 × 101 | 2.2 × 101 | 8.9 × 101 | 73.2 ± 6.8 |
| 17 | 28 | 50 | 78 | 9.91 | 9.7 × 101 | 6.1 × 101 | 1.8 × 10² | 1.5 × 10² | 6.6 × 101 | 1.4 × 10² | 122.2 ± 5.1 |
| 18 | 29 | 51 | 80 | 14.97 | 2.2 × 10² | 8.2 × 101 | 2.3 × 10² | 4.9 × 101 | 2.5 × 101 | 8.8 × 101 | 113.3 ± 6.4 |
| 19 | 29 | 50 | 79 | 11.02 | 1.4 × 10² | 1.3 × 10² | 4.2 × 10² | 1.7 × 10² | 8.9 × 101 | 2.1 × 10² | 241.3 ± 2.1 |
Table 5. Similar to table 4, but for N = 82 and their neighbors.
| ID | Z | N | A | Qβ | FS | F1 | F2 | F3 | FD | Ref. [40] | Exp. |
|---|---|---|---|---|---|---|---|---|---|---|---|
| 1 | 34 | 82 | 116 | 22.34 | 4.8 | 2.0 × 10⁻³ | 5.8 × 10⁻⁴ | 1.6 | 2.7 × 10⁻² | 6.0 × 10⁻¹ | |
| 2 | 35 | 82 | 117 | 23.54 | 4.9 | 4.5 × 10⁻³ | 1.4 × 10⁻³ | 1.5 | 3.3 × 10⁻² | 9.0 × 10⁻¹ | |
| 3 | 36 | 82 | 118 | 19.82 | 7.4 | 9.9 × 10⁻³ | 3.4 × 10⁻³ | 2.9 | 1.1 × 10⁻¹ | 1.2 | |
| 4 | 37 | 82 | 119 | 21.28 | 7.6 | 2.2 × 10⁻² | 8.1 × 10⁻³ | 2.5 | 1.2 × 10⁻¹ | 1.4 | |
| 5 | 38 | 82 | 120 | 17.34 | 1.2 × 101 | 4.8 × 10⁻² | 1.9 × 10⁻² | 5.5 | 4.4 × 10⁻¹ | 2.1 | |
| 6 | 39 | 82 | 121 | 18.96 | 1.3 × 101 | 1.0 × 10⁻¹ | 4.7 × 10⁻² | 4.6 | 4.4 × 10⁻¹ | 3.2 | |
| 7 | 40 | 82 | 122 | 15.01 | 2.1 × 101 | 2.3 × 10⁻¹ | 1.1 × 10⁻¹ | 1.1 × 101 | 1.7 | 4.5 | |
| 8 | 41 | 82 | 123 | 16.96 | 2.1 × 101 | 5.1 × 10⁻¹ | 2.7 × 10⁻¹ | 8.0 | 1.5 | 4.5 | |
| 9 | 42 | 82 | 124 | 12.93 | 3.6 × 101 | 1.1 | 6.6 × 10⁻¹ | 2.2 × 101 | 5.8 | 9.9 | |
| 10 | 44 | 84 | 128 | 14.26 | 2.5 × 101 | 2.1 | 4.2 | 1.4 × 101 | 5.7 | 2.2 × 101 | |
| 11 | 43 | 82 | 125 | 14.93 | 3.6 × 101 | 2.4 | 1.6 | 1.5 × 101 | 4.8 | 9.7 | |
| 12 | 44 | 83 | 127 | 15.71 | 2.9 × 101 | 3.4 | 4.1 | 1.2 × 101 | 4.8 | 7.6 | |
| 13 | 45 | 84 | 129 | 16.17 | 2.5 × 101 | 4.7 | 1.0 × 101 | 1.1 × 101 | 5.3 | 1.5 × 101 | |
| 14 | 44 | 82 | 126 | 10.94 | 6.7 × 101 | 5.4 | 3.8 | 4.9 × 101 | 2.1 × 101 | 3.3 × 101 | |
| 15 | 46 | 85 | 131 | 15.01 | 3.5 × 101 | 6.6 | 1.9 × 101 | 1.6 × 101 | 8.2 | 5.5 × 101 | 20* |
| 16 | 45 | 83 | 128 | 17.05 | 1.4 × 10² | 7.5 | 9.9 | 1.2 × 101 | 5.3 | 8.4 | 8* |
| 17 | 46 | 84 | 130 | 13.17 | 3.3 × 101 | 1.0 × 101 | 2.5 × 101 | 2.4 × 101 | 1.6 × 101 | 6.9 × 101 | 27* |
| 18 | 45 | 82 | 127 | 13.15 | 6.3 × 101 | 1.2 × 101 | 9.2 | 3.2 × 101 | 1.6 × 101 | 2.2 × 101 | 28 ± 14 |
| 19 | 47 | 85 | 132 | 16.07 | 1.7 × 10² | 1.4 × 101 | 4.5 × 101 | 1.7 × 101 | 9.8 | 2.8 × 101 | 30 ± 14 |
| 20 | 46 | 83 | 129 | 13.99 | 4.8 × 101 | 1.6 × 101 | 2.4 × 101 | 2.6 × 101 | 1.6 × 101 | 5.5 × 101 | 31 ± 7 |
| 21 | 47 | 84 | 131 | 14.35 | 4.3 × 101 | 2.3 × 101 | 5.9 × 101 | 2.5 × 101 | 1.9 × 101 | 3.3 × 101 | 35 ± 8 |
| 22 | 46 | 82 | 128 | 10.13 | 9.0 × 101 | 2.6 × 101 | 2.2 × 101 | 8.6 × 101 | 5.6 × 101 | 9.0 × 101 | 35 ± 3 |
| 23 | 47 | 82 | 129 | 11.08 | 1.4 × 10² | 5.7 × 101 | 5.3 × 101 | 1.0 × 10² | 6.6 × 101 | 3.4 × 101 | 49.9 ± 3.5 |
Table 6. Similar to table 4, but for N = 126 and their neighbors.
| ID | Z | N | A | Qβ | FS | F1 | F2 | F3 | FD | Ref. [40] | Exp. |
|---|---|---|---|---|---|---|---|---|---|---|---|
| 1 | 60 | 126 | 186 | 14.50 | 2.3 × 101 | 4.2 × 10⁻³ | 9.8 × 10⁻⁴ | 1.1 × 101 | 1.9 | 2.6 | |
| 2 | 61 | 126 | 187 | 15.96 | 2.7 × 101 | 9.5 × 10⁻³ | 2.4 × 10⁻³ | 9.9 | 1.7 | 3.4 | |
| 3 | 62 | 126 | 188 | 13.01 | 3.5 × 101 | 2.1 × 10⁻² | 6.1 × 10⁻³ | 1.9 × 101 | 4.9 | 4.7 | |
| 4 | 63 | 126 | 189 | 14.46 | 4.2 × 101 | 4.9 × 10⁻² | 1.5 × 10⁻² | 1.7 × 101 | 4.1 | 6.8 | |
| 5 | 64 | 126 | 190 | 11.49 | 5.6 × 101 | 1.1 × 10⁻¹ | 3.8 × 10⁻² | 3.5 × 101 | 1.2 × 101 | 9.3 | |
| 6 | 65 | 126 | 191 | 13.16 | 6.3 × 101 | 2.5 × 10⁻¹ | 9.6 × 10⁻² | 2.7 × 101 | 9.3 | 1.0 × 101 | |
| 7 | 66 | 126 | 192 | 10.15 | 8.9 × 101 | 5.6 × 10⁻¹ | 2.4 × 10⁻¹ | 6.1 × 101 | 3.0 × 101 | 1.9 × 101 | |
| 8 | 67 | 126 | 193 | 11.87 | 1.0 × 10² | 1.3 | 6.0 × 10⁻¹ | 4.4 × 101 | 2.1 × 101 | 2.0 × 101 | |
| 9 | 68 | 126 | 194 | 8.88 | 1.5 × 10² | 2.9 | 1.5 | 1.1 × 10² | 7.1 × 101 | 5.0 × 101 | |
| 10 | 69 | 126 | 195 | 10.45 | 1.8 × 10² | 6.5 | 3.8 | 8.2 × 101 | 4.9 × 101 | 4.4 × 101 | |
| 11 | 70 | 126 | 196 | 7.43 | 3.0 × 10² | 1.5 × 101 | 9.4 | 2.4 × 10² | 1.8 × 10² | 1.9 × 10² | |
| 12 | 71 | 126 | 197 | 9.09 | 3.4 × 10² | 3.3 × 101 | 2.4 × 101 | 1.6 × 10² | 1.1 × 10² | 1.0 × 10² | |
| 13 | 72 | 126 | 198 | 6.12 | 6.4 × 10² | 7.5 × 101 | 5.9 × 101 | 5.2 × 10² | 4.6 × 10² | 1.7 × 10³ | |
| 14 | 74 | 128 | 202 | 6.81 | 4.2 × 10² | 1.6 × 10² | 1.6 × 10² | 3.0 × 10² | 3.2 × 10² | 2.3 × 10³ | |
| 15 | 73 | 126 | 199 | 7.76 | 7.0 × 10² | 1.7 × 10² | 1.5 × 10² | 3.3 × 10² | 2.5 × 10² | 3.8 × 10² | |
| 16 | 74 | 127 | 201 | 7.88 | 6.5 × 10² | 2.5 × 10² | 2.3 × 10² | 2.9 × 10² | 2.3 × 10² | 2.5 × 10³ | |
| 17 | 75 | 128 | 203 | 8.58 | 4.4 × 10² | 3.6 × 10² | 4.0 × 10² | 1.8 × 10² | 1.8 × 10² | 5.5 × 10² | |
| 18 | 74 | 126 | 200 | 4.64 | 2.0 × 10³ | 3.8 × 10² | 3.7 × 10² | 1.6 × 10³ | 1.4 × 10³ | 1.3 × 10⁴ | |
| 19 | 75 | 127 | 202 | 9.65 | 1.0 × 10³ | 5.6 × 10² | 5.8 × 10² | 1.8 × 10² | 1.4 × 10² | 4.5 × 10² | |
| 20 | 75 | 126 | 201 | 6.47 | 1.7 × 10³ | 8.7 × 10² | 9.3 × 10² | 7.6 × 10² | 5.6 × 10² | 1.2 × 10³ | |
| 21 | 76 | 127 | 203 | 7.10 | 1.1 × 10³ | 1.3 × 10³ | 1.5 × 10³ | 4.6 × 10² | 4.2 × 10² | 6.6 × 10³ | 300* |
| 22 | 77 | 128 | 205 | 7.22 | 9.9 × 10² | 1.8 × 10³ | 2.5 × 10³ | 4.0 × 10² | 3.9 × 10² | 6.3 × 10³ | 1000* |
| 23 | 76 | 126 | 202 | 3.69 | 5.4 × 10³ | 2.0 × 10³ | 2.3 × 10³ | 3.6 × 10³ | 3.2 × 10³ | 5.1 × 10⁴ | 2000* |
| 24 | 77 | 127 | 204 | 8.05 | 1.9 × 10³ | 2.9 × 10³ | 3.7 × 10³ | 4.5 × 10² | 3.3 × 10² | 7.0 × 10³ | 2000* |
| 25 | 77 | 126 | 203 | 4.94 | 6.2 × 10³ | 4.4 × 10³ | 5.8 × 10³ | 2.6 × 10³ | 1.5 × 10³ | 4.3 × 10⁴ | 7000* |
As seen in figure 3, the half-lives of all isotopes with the ratios of N/Z ⩽ 1.9 range from a few milliseconds to tens of seconds for all the theoretical calculations. The five semi-empirical formulae are mostly consistent with each other and with the macro–microscopic FRDM + QRPA approach. The difference between their predictions are mostly less than one order of magnitude when N/Z < 1.9. The predicted half-lives are close to the available extrapolated and/or measured values obtained in the NUBASE2020 database, as shown in panels (A1), (B1), and (C1). Besides, the uncertainties in the predicted half-lives are comparable with those in the measured data, which are up to 50% in many cases of extremely exotic nuclei [46]. The excellent agreement among the calculations and measurements can be understood by the updated coefficients in the semi-empirical models. On the other hand, the results show that the FS, F3, FD, and FRDM + QRPA calculations are close to each other but differ from those using the F1 and F2 methods by one to four orders of magnitude for the nuclei in the range of N/Z = 1.9–2.2, especially for the nuclei in the vicinity of N = 82 and 126, as can be seen in the panels (B2) and (C2). This discrepancy is mainly due to the difference in the calculation models. The β-decay Q-value, odd–even effect, and charge-asymmetry are taken into all these four models, whereas only Z and N are considered in the F1 and F2 approaches. Additionally, with the improvement in modeling, the shorter half-lives of FD for the extremely neutron-rich isotopes in the vicinity of N = 50, as shown in the panels (A1) and (B1), clearly reflect the difference in the rms values between FD (with the smallest deviation from measured data) from the others. By taking the panels (A2), (B2), and (C2) all together, we found that the Qβ -dependent models (FS, F3, FD, and FRDM + QRPA) are more separated from the others (F1 and F2), which do not depend on the Q-value, when the ratios N/Z decrease or isotopes are closer to the stability line. This phenomenon is mainly due to the less (or more) sensitivity of the half-life to the β−-decay Q-values of the isotopes far (or close) to the beta stability [43]. On the other hand, although large discrepancies exist among the predicted half-lives owing to the differences among the models and the smallest deviation from measured half-lives of FD, it is difficult to confirm which model is the best for the isotopes in the region of N/Z > 1.9 because the lack of experimental data. Thus, we strongly suggest these isotopes for measurements to overcome this limitation.
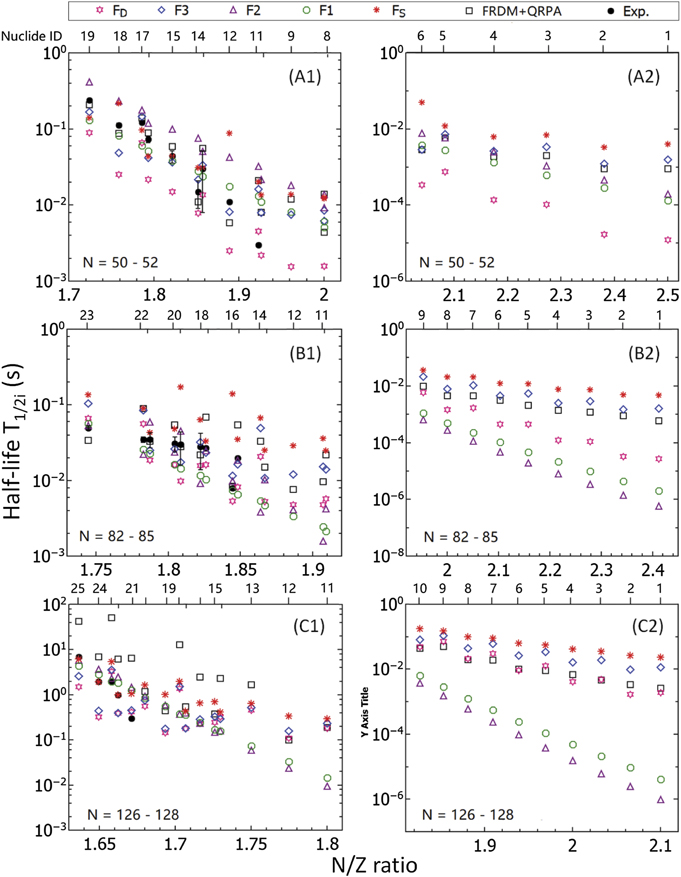
Figure 3. The half-lives (in second, logarithmic scale) of the N = 50 (panels (A1) and (A2)), 82 (panels (B1) and (B2)), and 126 (panels (C1) and (C2)) isotopes and their neighbors versus the N/Z ratios. The numbers on the top axis of each panel denote the ID of the isotopes in tables 4–6.
Download figure:
Standard image High-resolution imageThe results in figure 3 also show that the half-lives of the investigated neutron-rich isotopes having N/Z ⩽ 1.9 in the N = 50, 82, and 126 groups are comparable with the typical timescale of the neutron capture, which is approximately 100 ms [67]. In contrast, the half-lives are much shorter than 100 ms, especially for 1.9 < N/Z < 2.1 isotopes, leading to the dominance of the β− decay over the neutron capture if the F1 and F2 models are considered. Additionally, the discrepancies among the models become larger when the neutron number much exceeds the proton number (i.e., N/Z > 2.1). In the other words, the half-life predictions become more uncertain when isotopes shift toward the neutron drip line. The recent uncertainty in the β−-decay half-lives (or β−-decay rates) makes it difficult to determine the dominance between the β− decay and neutron capture in the r-process [67]. Hence, the precise half-lives of the extremely neutron-rich isotopes, especially for the N/Z > 2.1 isotopes, are necessary to improve both the investigated semi-empirical models and astrophysical estimations.
3.4. The impact of β−-decay half-life uncertainty on the r-process calculation
To consider the impacts of the uncertainty in the β−-decay rates of the waiting points at N = 50, 82, and 126 on the r-process abundance, we performed a full network calculation with 8055 isotopes from neutron to 339Ds including the investigated isotopes in the present study for the r-process abundance. As described in the theoretical framework, the high entropy neutrino-driven wind was proposed as the r-process site instead of neutron-star mergers, collapsars, or magnetohydrodynamic jets, etc because this astrophysical site is (1) sensitive to the β−-decay rates [67] and (2) appropriate for the main r-process [53–59]. The calculated half-lives presented in tables 4–6 were employed to determine the β-decay rates as the inputs for the r-process simulations. The typical conditions of temperature T9 ⩾ 2 GK, neutron density nn = 1020–1030 neutrons cm−3, and entropy S = 300 kB/baryon for the hot bubbles in high-entropy winds [68–71] were considered for the simulation. Notice that, for examining the sensitivity of the half-lives of the waiting-point nuclei to the r-process abundance, only the β−-decay rates of the 67 investigated isotopes which are in the vicinity of neutron closed-shells at N = 50, 82, and 126 in this study were changed while the other conditions of neutron-capture rates, photodisintegration rates, and so on were kept as the same. The entropy was chosen so that the isotopes beyond uranium and the third peak at A ≈ 195 can be produced in the r-process. The simulation was run for a time much longer than the r-process timescale until the temperature and neutron density conditions decrease up to T9 = 2 GK and nn = 1020 neutrons cm−3 at which the main r-process is quenching. For the computation, we employed the method proposed by Kostka et al, which is well described in reference [72]; thus, this is not repeated here.
The calculated isotopic abundances are shown in figure 4. It can be seen that the abundances based on the F1 and F2 models (left panel) are close to each other and mostly higher than those based on the FS, F3, FD, and FRDM + QRPA approaches (right panel), regardless of the third peak. The three peaks at A = 80 (N = 50), A = 130 (N = 82), and A = 195 (N = 126) in the left panel were found to be fainter than those in the right panel. The results in the left panel indicate that the short half-lives based on the F1 and F2 models of the waiting-point nuclei result in the lower peaks and high contributions of the isotopes beyond the peaks, which are in the A > 85, rare-earth-element pygmy-peak (140 ⩽ A ⩽ 180) and A > 200 regions, in the r-process. In contrast, the longest lifetimes deduced from the FS formula lead to the lowest contribution isotopes outside the peaks in the r-process abundance (right panel). On the other hand, there is a bit of difference in the abundance of odd/even nuclei. This result reflects the odd–even effects caused by the reduction of neutron density during the local or temporarily freeze-out phase [8, 72] in the r-process. When the neutron density is reduced, the β decay and/or photodisintegration become(s) the dominant process, which results in the difference in the abundance of the A and A − 1 or A + 1 nuclei [8, 72]. Hence, together with the (n, γ) and (γ, n) rates, the β-decay rate provides better understanding in the complicated mechanism of the r-process.

Figure 4. Final r-process abundance distribution of isotopes calculated using β−-decay rates based on various half-life models [F1, F2 (left panel), FS, F3, and FRDM + QRPA (right panel)]. The r-process pattern (dashed curve) was taken from reference [57]. The green, yellow, gray, and pink shaded areas indicate the significant difference in the abundance owing to the uncertainties in the β−-decay rates between F1 and F2, FS and F3, F3 and FRDM + QRPA, and FD and FRDM + QRPA models, respectively.
Download figure:
Standard image High-resolution imageAlthough the r-process mechanism is complicated [5, 52], the fainter peaks and the higher contributions of the isotopes in the rare-earth-element pygmy-peak (140 ⩽ A ⩽ 180) and A > 200 regions based on the F1 and F2 models in the left panel can be understood by the competition between the β-decay and the net neutron capture rates of the isotopes in the shell-closure N = 50, 82, and 126 groups and their daughters [67]. The β−-decay half-lives (or decay rates) of the isotopes in the closed-shell groups are so short (or high) that the β− decay dominates the neutron capture (n, γ) to shift the reaction flow toward the beta stability, from a (Z, A) nuclide (e.g., 127Rh) to its daughter (Z + 1, A) (e.g., 127In), without changing the mass numbers A. The β− decay continues up to a long-lived daughter, where the neutron capture dominates the decay to produce heavier nuclei by converting the A nuclei into A + 1, A + 2, etc. Consequently, the contributions of the isotopes in the shell-closure groups are reduced in the A ≈ 80, 130, and 195 peaks; however, those of the A > 80, rare-earth-element pygmy-peak, and A > 195 nuclei are increased in the r-process abundance. These results are consistent with the scenario of the synthesis of heavy nuclei in the r-process, as described in references [73, 74] and in good agreement with the mechanism for the formation of the rare-earth-element peak during the freezeout when the reaction flow decays back to the beta stability [41, 75]. The half-lives based on the F1 and F2 models of the neutron closed-shell isotopes are mostly shorter than those of their daughters [46], and vice versa for the FS, F3, FD, and FRDM + QRPA models. Hence, with the F1 and F2 approaches, most of the investigated closed-shell nuclei prefer to quickly decay into their daughters, whereas the four later models lead to slower β−-decay rates which enhance the three peaks in the r-process [76, 77].
In contrast to the F1 and F2 models, the half-lives based on the FS, F3, FD, and FRDM + QRPA models result in a clear appearance of the three peaks, as seen in the right panel of figure 4. This results from the relatively long lifetimes, which are a few hundreds of milliseconds and comparable with the timescale for the neutron capture [16, 78], of the isotopes around N = 50, 82, and 126. The formation of the peaks and heavier nuclei depends on the competition between the (n, γ), (γ, n), and β−-decay rates. However, the neutron-capture cross-section of the closed-shell isotopes is a few orders of magnitude smaller than those of the unclosed-shell nuclei [74, 79, 80], leading to slower neutron capture of the closed-shell N = 50, 82, and 126 isotopes. Additionally, the relatively long half-lives (low decay rates) reduce the chance for the decay to convert the small cross-section isotopes into others that have larger neutron-capture cross-sections to speed up the reaction flow. As a result, the nucleosynthesis involving the temporary freeze-out (n, γ)–(γ, n) equilibrium awaits beta decay, leading to a slow material flow at N = 50, 82, and 126 isotopes. Subsequently, the contribution of these isotopes in the three peaks is increased; however, that of the heavier nuclei in the rare-earth-element peak and A > 200 region is decreased because of the longer β−-decay half-lives in the cases of the FS, F3, FD and FRDM + QRPA models (right panel).
The results in figure 4 indicate that the r-process abundance of isotopes, especially for the second, rare-earth-element pygmy, and/or third peaks, is very sensitive to the β−-decay half-lives of the N = 50, 82, 126 isotopes and their neighbors. This result is consistent with the findings of previous studies [81, 82]. From the comparison in figure 5, we found that, the abundance of isotopes ranging in A = 80–240 varies from a few factors to two orders of magnitude, as indicated by the shaded areas in figure 4, owing to the current uncertainty in the half-lives of the concerned input isotopes. For instance, in the range of A ⩽ 120, the abundance based on the F2 formula overestimates that based on F1 by a factor of approximately 3. The same factor was also observed in the difference in abundance between the FS and F3, F3 and FRDM + QRPA, and FD and FRDM + QRPA models. The discrepancy in the abundances based on F1 and F2 models and the others is a factor of approximately 8 for the mass range of 140 < A < 180. In particular, the abundances based on the F1 and F2 models overestimate those based on the FRDM + QRPA and FD (or FS) models by one (or two) order(s) of magnitude for the isotopes beyond A = 200. As explained earlier, the differences among the abundances based on various half-life models can be understood by the impact of the uncertainty in the β−-decay rates on the competition between the decay and neutron-capture rates in the r-process.

Figure 5. Difference [log(Yi /Y0)] between the abundance Yi computed using the β−-decay rates (half-lives) of the Fi (FS, F1, F2, F3, FD, and FRDM + QRPA [40]) models and the abundance in the Solar System Y0 [83]. The dashed gray curve is the log(Yi /Y0) values with Yi being the r-process pattern calculated by Otsuki et al [57].
Download figure:
Standard image High-resolution image
As shown in figure 4, we found that the r-process abundance based on the β−-decay half-lives calculated using the six models is consistent with the r-process pattern (gray dashed curves), which was determined based on almost the same high-entropy neutrino-driven-wind conditions by Otsuki et al [57], and the Solar System abundance (black dots) obtained from reference [83]. However, the position of the third peak (A ≈ 195) is slightly shifted backward by a few mass units for the FS, F3, FD, and FRDM + QRPA models (right panel). In addition, the width of the third peak based on the FS model was narrower than those based on the F1, F2, F3, FD, and FRDM + QRPA approaches. The narrow (or broad) peak can be understood by the dominance of the beta decays as compared to the neutron captures at and/or around the N = 126 isotopes just after the freeze-out phase in the late times of the r-process [84, 85]. Because the evolution of the peak strongly depends on the neutron density for the neutron captures at this phase [5, 84, 86, 87], with an exhausted neutron density, the β decay becomes dominant and form a narrow peak owing to the enhancement of the relatively long-lived (slow-decay rate) isotopes and their decayed isobaric daughters. Subsequently, the long half-lives predicted by the FS model resulted in a narrow peak at A = 195. Conversely, the peak shift can be explained by β-delayed neutron emission [36, 67, 84, 88]. The delayed emission of neutrons in the β decay shifts the nuclear evolution to the N − 1 (lower mass) region. The shift in the reaction flow depends on the emission probability [64, 88]. Because the probability of the neutron emission is large (or small) for the long (or short) β−-decay half-life [64], the peak can be shifted to the lower mass region in the case of the FS half-lives, which are mostly longer than those of the F1, F2, F3, FD, and FRDM + QRPA models (see figure 3).
It was found that the r-process pattern [57] can be well reproduced by the FS, F3, FD, and FRDM + QRPA models with an overall deviation of a few factors, as seen in the right panel of figure 4, regardless of the peak shift as discussed above. The comparison in figure 5 also shows that the abundances based on the F1 and F2 formulae generally overestimate the results in reference [57] from a few factors to one order of magnitude, especially for the isotopes in the rare-earth-element pygmy-peak and A > 195 regions. These deviations are similar to the uncertainty in the abundances calculated using various astrophysical scenarios and models in many previous studies [67, 84, 87, 89, 90]. Because the abundance is very sensitive not only to the nuclear inputs but also to astrophysical conditions, more careful studies on the nuclear inputs and dynamics of the r-process are required to reduce the uncertainty. On the other hand, although the abundance shapes are in good agreement, the simulated results need to be upscaled by approximately 3–4 orders of magnitude to fit the abundance of the Solar System. This difference can be understood by the impacts of many unclear factors in the r-process models, such as the neutron-capture timescale, neutron density, hydrodynamic conditions of the r-process evolution, neutron-capture and β−-decay rates, and β-delayed neutron emission probability [17, 22, 28, 69, 91]. Hence, this is a common problem in the r-process calculations [22, 53, 57, 68, 70, 90].
As discussed above, the uncertainty in the half-lives of the isotopes at and around the neutron shell-closures at N = 50, 82, and 126 significantly impacts the calculations of the r-process isotopic abundance. Hence, measurements of both half-lives and the nuclear mass of these isotopes are necessary to improve the theoretical calculations. Because the FS, F3, FD, and FRDM + QRPA approaches strongly depend on the β−-decay Q-values, precise mass measurements are required to reduce the uncertainty in the half-lives. However, measuring techniques such as multiple-reflection time-of-flight (MR-TOF) [92–94], Penning trap [25, 95, 96], storage ring [97–100], etc are limited by the lifetimes of the nuclei. For example, although the Penning trap has a mass precision of up to 10−8, its measuring time is only appropriate for relatively long lifetimes, which are longer than tens of milliseconds (10−3 s) of measured nuclei [101, 102]. Based on the MR-TOF technique, the nuclear mass of the nuclei with half-lives of tens of microseconds (10−6 s) can be measured in radioactive ion beam facilities [92–94, 102] with a precision level of 10−7. When the aforementioned techniques are considered together with the estimated half-lives in tables 3–5, we found that only several nuclei of interest (i.e., 78–81Ni, 129–132Ag, and Z > 70 in the N = 82 group) with half-lives of tens of milliseconds can be measured using the Penning trap, the MR-TOF technique is preferable for all the investigated neutron-rich isotopes.
4. Conclusion
In the present study, by fitting newly updated experimental data to well-measured unstable nuclei, we determined new sets of values for the coefficients in the five semi-empirical formulae of the β−-decay half-life. In particular, we developed a new model (FD) to improve the half-life prediction. The reliability of the semi-empirical formulae (FS, F1, F2, F3, FD) and the FRDM + QRPA model was investigated by comparing their predicted half-lives to the measured data. With the updated coefficients, the β−-decay half-life prediction is much improved because the deviation from the experimental data is drastically reduced. The results indicate that the new formula FD, in which the β-decay Q-value, charge-asymmetry, odd–even effect, and shell correction are considered, can provide the best half-life prediction. In contrast, together with the FRDM + QRPA approach, the simple models of F1 and FS results in large deviations between the calculated and measured half-lives. Conversely, all the mentioned models were employed to predict the half-lives of extremely neutron-rich isotopes at the shell closures of N = 50, 82, and 126, which are thought to be the waiting points in the r-process. We found that the half-lives of these isotopes are very uncertain owing to differences in the models. The half-lives mostly range from 10−3 to 101 s for all the investigated nuclei if the FS, F3, FD, and FRDM + QRPA models were employed. The half-lives are much shorter than milliseconds, 10−7 ⩽ T1/2 ⩽ 10−3, for the N/Z > 2 isotopes if the F1 and F2 formulae are used for the predictions. Moreover, we examined the sensitivity of the final r-process abundance to the β-decay rates of the N = 50, 82, and 126 isotopes whose half-lives were calculated using the investigated models. The results indicate that the uncertainty in the half-lives of these isotopes strongly impacts the contributions of isotopes in the three peaks at A ≈ 80 (N = 50), 130 (N = 82), and 195 (N = 126). It was found that the three peaks based on the F1 and F2 models were fainter than those based on the other models. In addition, the abundances of isotopes were changed by a few orders of magnitude owing to the half-life uncertainty. Because the estimation of the β-decay half-life strongly depends on the Q-value, the precise mass of the waiting-point isotopes need to be measured in radioactive ion beam facilities. When the half-lives were considered together with measuring timescale of various techniques, we suggest that the MR-TOF spectrometer should be employed for this purpose. This work provides important information for further studies on the nuclear properties of extremely neutron-rich isotopes and r-process simulations.
Acknowledgments
This work was supported by the National Research Foundation of Korea (NRF) grant funded by the Korean Ministry of Education, Science, and Technology (under numbers NRF-2020R1C1C1006029, NRF-2020R1A2C1005981, NRF-2016R1A5A1013277, and NRF-2013M7A1A1075764). N D Ly also thanks the support from Van Lang University for this study.
Data availability statement
All data that support the findings of this study are included within the article (and any supplementary files).