
Abstract
Remote plasmas are used in semiconductor device manufacturing as sources of radicals for chamber cleaning and isotropic etching. In these applications, large fluxes of neutral radicals (e.g. F, O, Cl, H) are desired with there being negligible fluxes of potentially damaging ions and photons. One remote plasma source (RPS) design employs toroidal, transformer coupling using ferrite cores to dissociate high flows of moderately high pressure (up to several Torr) electronegative gases. In this paper, results are discussed from a computational investigation of moderate pressure, toroidal transformer coupled RPS sustained in Ar and Ar/NF3 mixtures. Operation of the RPS in 1 Torr (133 Pa) of argon with a power of 1.0 kW at 0.5 MHz and a single core produces a continuous toroidal plasma loop with current continuity being maintained dominantly by conduction current. Operation with dual cores introduces azimuthal asymmetries with local maxima in plasma density. Current continuity is maintained by a mix of conduction and displacement current. Operation in NF3 for the same conditions produces essentially complete NF3 dissociation. Electron depletion as a result of dissociative attachment of NF3 and NFx fragments significantly alters the discharge topology, confining the electron density to the downstream portion of the source where the NFx density has been lowered by this dissociation.

Original content from this work may be used under the terms of the Creative Commons Attribution 4.0 license. Any further distribution of this work must maintain attribution to the author(s) and the title of the work, journal citation and DOI.
1. Introduction
Remote plasma sources (RPSs) facilitate the production of neutral radicals for use in materials processing reactors while minimizing exposure of materials to significant fluxes of charged species and photons [1, 2]. A RPS typically employs either or both of biased grids or long flow distances from the plasma source to the reactor to isolate charged particles or to allow for recombination of charged particles. These designs result in radical fluxes to the substrate having a low charged particle fraction. RPSs are employed for chamber cleaning [3–5], photoresist stripping [6–8], isotropic chemical etching [9–12], atomic layer etching [13, 14], atomic layer deposition [15, 16], and chemical vapor deposition [17, 18]. RPSs are increasingly being investigated for use in selective isotropic etching processes, and particularly for the manufacture of horizontally stacked nano wires and gate-all-around architectures [11, 19].
RPSs are often employed when high radical fluxes are required [1], necessitating high plasma densities (>1012 cm−3) and high flow rates (up to many slm) of feedstock gases. As such, internal components of the RPS can be exposed to harsh conditions, including high radical and radiative fluxes to plasma-facing surfaces and high gas temperatures (>2000 K) [20] resulting in erosion through reactions with these chemically reactive species [4]. Design challenges for RPSs are demanding, which motivate the use of chemically inert internal surfaces and electrodeless power coupling schemes capable of operating at high temperatures.
High plasma density RPSs use a variety of power schemes, including radio frequency (RF) capacitively coupled plasma [9, 15], RF inductively coupled plasma (ICP) [11], microwave coupled [5], and transformer coupled [2, 21]. Toroidal transformer coupled plasma (TTCP) sources are an attractive option. In conventional ICP sources, the electromagnetic wave delivering power to the plasma is directly launched into the chamber from the antenna through a dielectric window. Similar to a tokamak, TTCP sources employ an external primary coil antenna driven by an RF current which is wrapped around and induces a magnetic field inside a ferrite loop. The ferrite guides and focuses the magnetic field, which is delivered to the plasma chamber where a toroidal electric field is induced producing the plasma. Prior studies have addressed transformer coupled RPSs in continuous-wave operation employing electronegative gas admixtures including NH3 [2, 22], NF3 [4, 23–25], CF4 [26], O2 [24] and SF6 [27]. A typical system layout of the RPS and, for example, a plasma etching chamber receiving its output will strategically optimize the length of the flow tube between the RPS and the chamber [25]. The tube length should be short to deliver the plasma produced radicals with a minimum of recombination. The tube should be long to minimize the likelihood for plasma reaching the chamber. While the applications of RPSs have been highlighted in low-temperature plasma roadmaps [28], there have been few fundamental studies of RPS plasma properties and transformer-coupled source design.
Commercial use of transformer coupled RPSs is well established [18, 29–31]. However, since the integration of plasma diagnostics is difficult in high plasma density sources having these operating conditions, diagnostics are often limited to downstream measurements of radical densities or reaction products. Design of RPSs using the TTCP configuration would benefit from an improved understanding of their fundamental operation.
In this paper, we discuss results from a computational investigation of a toroidal, transformer coupled RPS sustained in Ar and Ar/NF3 mixtures for conditions typically used for semiconductor manufacturing (1 Torr, 1 kW). TTCP operation using a single ferrite core in argon produced a continuous plasma loop with a maximum plasma density of 1.1 × 1013 cm−3, and with power deposition and ionization occurring nearly uniformly along the azimuthal current loop. Transformer current in the azimuthal direction is largely sustained by conduction current. When operating with dual-ferrite cores, azimuthal asymmetries are introduced resulting in local maxima in power deposition and plasma density. The introduction of NF3 significantly depletes the upstream electron density by dissociative electron attachment, breaking the continuous plasma loop, and resulting in a low-density (1010–1011 cm−3) F−/NFx + ion-ion plasma upstream of the power deposition by the ferrite cores. Transformer current is maintained by both conduction and displacement current.
The numerical model, simulation geometry, and operating conditions are discussed in section 2. Operation of a TTCP in argon using single and dual ferrite core configurations is discussed in section 3. Plasma properties of TTCPs operating in Ar/NF3 mixtures are discussed in section 4 and concluding remarks are in section 5.
2. Description of the model and conditions
Two configurations of the TTCP-RPS were investigated having single and dual-ferrite cores. This 2-dimensional (2D) geometry was motivated by commercial designs of RPS. For an example of a similar transformer-coupled Ar/NF3 attached to a plasma etching chamber see Yeom et al [25]. The computational domain is 22.8 cm by 20.8 cm using a rectilinear, numerical mesh of 91 cells wide × 83 cell high using Cartesian coordinates, yielding a resolution of 0.25 cm cell−1. A uniform depth of 3.25 cm is specified to enable computation of volumetric properties such as gas residence time and power density based on absolute values of flow rates, power and current, but otherwise does not affect the calculation. Feed gas enters through a 3.0 cm long inlet tube into the 3.25 cm wide toroidal vessel tube. Gas exits the source through a 5.0 cm long outlet tube. The walls of the inlet and outlet tubes are grounded while all other plasma facing surfaces consist of 0.5 cm thick alumina. The inlet gas flow rate was 500 sccm of either pure argon or Ar/NF3 mixtures. A pressure of 1 Torr is specified as a boundary condition at the outlet maintaining a pressure of approximately 1 Torr (±0.1 Torr) throughout the source. The walls of the chamber were maintained at 325 K.
In the first configuration (figure 1(a)), RF current was supplied at 0.5 MHz to a single core by a 10-turn solenoidal current coil or antenna acting as the primary of the transformer. The current in figure 1(a) flows counter-clockwise in the 2-dimensional plane of the calculation, producing a magnetic field through the ferrite pointing into the plane. The ferrite core is, conceptually, a closed loop oriented perpendicular to the simulation plane, passing through the primary coil and entering the center of the reactor. The powered ferrite is that portion of the core surrounded by the antenna. The passive ferrite is that portion of the core surrounded by the plasma. The purpose of the ferrite cores are to capture the magnetic field produced by the antenna and transmit that magnetic field to power the secondary turn of the transformer, which is the plasma. The transmitted magnetic field to the unpowered ferrite points perpendicularly out of the plane in figure 1(a), with the induced current through the plasma zone oriented in the clock-wise direction. In the second configuration (figure 1(b)) two independent 10 turn solenoid coils are coupled to the plasma through two independent transformer ferrite cores.

Figure 1. Schematic of the toroidal transformer coupled plasma (TTCP) sources employed in this study. (a) Single ferrite core. The blue into and-out-of plane arrows represent directions of magnetic field. The red arrows represent direction of current or electric field. (b) Dual ferrite cores.
Download figure:
Standard image High-resolution imageThe square cross section for the single ferrite and rectangular cross sections for the dual ferrites are a consequence of limitations of the numerical mesh, which is rectilinear. That said, the majority of commercially available ferrite, closed loop cores do not have circular cross sections. The cross sections are typically rectangular due to fabrication challenges, and so the representations of the cores here reflect current practice. The rectangular cross sections of the cores then affect the symmetry of the induced electric fields generated by the magnetic fields carried by those cores.
The ferrite material has a relative permeability of μr = 100, relative permittivity of  r = 3.0 and an electrical conductivity of σ = 1× 10⁻⁷ Ω·cm−1. The inner passive ferrite arms are inside a dielectric Macor housing. A grounded metal spacer placed between the two central ferrite materials is intended to guide electromagnetic field propagation outwards towards the plasma channels, rather than reconnecting between the two central ferrites. The plasma channels, lined by alumina coatings, are contained within a metallic shell. As a result, power is coupled from the antennae to the plasma entirely due to the ferrite generated electromagnetic fields.
The plasma chamber consists of a closed roughly circular path. The secondary loop of the transformer is the current conducted by the plasma. With a single ferrite core, the oscillating magnetic field through the passive ferrite produces an electric field in the plane of the simulation, oscillating in the azimuthal direction. With dual ferrite cores, the phases of the primary currents flowing through the antenna on the powered sides of the ferrites were chosen so that the sum of the induced electric fields generated by the passive ferrites are in phase and oscillate in the azimuthal direction.
The model used in this investigation was the 2-dimensional Hybrid Plasma Equipment Model (HPEM) [32]. The toroidal geometry and transformer power coupling were facilitated by adding a frequency domain solution and transformer surface current model into the existing HPEM framework to enable current loops in the (x,z) plane. In this implementation of the HPEM, a fluid treatment was used for the bulk electron, ion, and neutral species, and a kinetic treatment was used for secondary electrons. Bulk fluid heavy particle species fluxes were obtained using individual continuity, momentum, and energy equations for each species with collisional mixing terms between species. This approach enables individual species to have unique temperatures and convective speeds. Thermodynamic properties of neutral species in mixtures were computed based on their individual Lennard–Jones 6–12 potentials and radii using the techniques discussed in [32, 33]. Ion mobilities in mixtures were given by their total collision frequency with all other species, with diffusivities then given by the Einstein relation.
The temperatures of all solid materials were kept constant at 325 K assuming active cooling of the device. The inlet flow was given by the specified sccm with the flux being uniformly distributed across the inlet. Gas enters into the source with the temperature of the inlet material. The pressure was held constant on the surface of the pump port, with the outcome being a small pressure drop across the device. Slip boundary conditions for convective flow and jump boundary conditions for temperature were employed on all surfaces using a gas-solid accommodation coefficient of 0.8.
The mean bulk electron energy was obtained from a fluid based energy conservation equation [32]. Rate coefficients and transport coefficients were obtained from solutions of Boltzmann's equation for the bulk electron energy distributions using a two-term spherical harmonic expansion. These coefficients are stored in a table as a function of mean electron energy which is interpolated during the simulation. The table is updated as the gas composition evolves.
The rate of secondary electron emission from plasma-facing material surfaces varied in direct proportion to the incident heavy ion flux. An ion-induced secondary electron emission coefficient of 0.15 was assumed for alumina and metal plasma-facing surfaces [34]. Photon and electron induced secondary electrons were not considered in this work. Energy distributions of secondary electrons were explicitly computed using a Monte-Carlo method as described in [35]. The trajectories of secondary electrons, emitted with an initial energy of 3 eV, were tracked using Monte Carlo methods in the space and time varying electromagnetic and electrostatic fields. Secondary electrons interact with gas phase heavy particles using the same reaction mechanism as for bulk electrons while including electron–electron and electron–ion collisions. Statistics on the energy and locations of secondary electrons and electrons produced by ionizing collisions are recorded on every timestep weighted by the residence time of the electron in a given numerical cell. Secondary electrons falling below 2 eV were added to the bulk electron population through a source term in the bulk electron continuity equation. The distribution functions of the secondary electrons are used to formulate source functions for electron impact processes that are added to continuity equations in the fluid portion of the model. With every call to the Monte Carlo simulation, 105 particles were launched as secondary electrons.
Poisson's equation for the electrostatic potential was solved using a semi-implicit technique [32] with charge densities in the gas phase and on dielectric surfaces. All metal materials were grounded, including the outer boundary of the computational domain.
The species included in the model are in table 1. The argon reaction mechanism is discussed in [36], and the NF3 reaction mechanism is discussed in [37, 38], with transport coefficients based on [39]. A brief description of the reaction mechanisms is given here. In this mechanism, F* (energetically F(3s4P)), F2* (energetically F2(A 3Πu) and N* (energetically N(2D)) are lumped states including excitation to higher lying states. N2* is a lumped state energetically N2(A) while also including excitation to N2(B3Π), N2(W3Δ) and N2(B3Σ). N2** is similarly a lump state energetically N2(a'1Σ) while also including excitation to higher states. Equations (1)–(7) present examples of NFx electron impact reactions in the mechanism including (equation (1)) elastic scattering, (equation (2)) dissociative attachment, (equation (3)) dissociative excitation, (equation (4)) ionization, (equation (5)) dissociative ionization, (equation (6)) dissociative recombination and (equation (7)) dissociative ion–ion neutralization


Table 1. Species included in the reaction mechanism.
| Charged Species | e−, Ar+, Ar2 +, F+, F−, F2 +, N+, N2 +, NF3 +, NF2 +, NF+ |
| Neutral Species | Ar, Ar(1s5), Ar(1s4), Ar(1s3), Ar(1s2), Ar(4p), Ar(4d), Ar2*, F, F*, F2, F2*, N, N*, N2, N2*, N2**, N2(v) |
Rate coefficients for electron impact reactions were calculated from electron energy distributions obtained from stationary solutions of Boltzmann's equation [32]. Heavy particle mixing and cascade process between excited species were also included with rate coefficients obtained from [40–43] for argon and [39, 40] for NFx species. In computing argon ion transport coefficients and the resulting ion temperatures, the momentum transfer cross-sections were reduced inversely proportional to temperature above 1000 K to capture the fall off in heavy particle interaction cross-sections at high ion velocities [44]. Gas heating sources included Joule heating, elastic collisions with electrons, changes in enthalpy due to gas phase reactions, Franck–Condon heating due to dissociative electron impact and recombination, and ion-ion neutralization processes. Conductive heat exchange occurs between the gas phase and walls, and convective heat exchange occurs at the inlet and outlet.
Addressing the toroidal RPSs with current loops in the x–z plane required modification of the existing HPEM framework. A solution of the electric field frequency domain wave equation in the electromagnetics module (EMM) was implemented to enable modeling of lateral (x) and axially (z) orientated currents and electric fields in a Cartesian plane. A transformer coupling model was also developed to account for the primary winding induced out-of-plane magnetic field (BcTθ ) between the powered and unpowered arms of the ferrite materials, and to compute the resulting induced secondary winding (x,z) electric field components. Electric fields in the (x,z) plane are produced using a successive over relaxation (SOR) solution to the frequency domain wave equation,

where, is the electric field vector resulting from the toroidal transformer, and ε and µ are the material dependent permittivity and permeability. The current components include: Jp the plasma current density, Ja the antenna current density, and Jt the effective transformer current density, discussed below. In the frequency domain,


where is the real amplitude of the electric field, is its phase with the vector notation indicating a unique phase for each component of the electric field and is the complex amplitude including phase (the phasor), where the subscript c generally denotes a complex quantity. is the direction amplitude of the antenna current where is the skin depth of the wave into the metal of the antenna and d is the depth (thickness) of the antenna. is the tensor conductivity having contributions from electrons and ions which, in the absence of an applied static magnetic field, has only diagonal elements.


The transformer current density is defined only in unpowered ferrite materials which serve as the secondary winding of the transformer circuit. Computationally, in 2-dimensions, the spatial locations of the ferrite material serving as the primary winding of the transformer are mapped 1-to-1 to locations in the secondary winding. This mapping requires the shape of the primary and secondary ferrites to be the same. The transformer ferrites carry only a non-zero azimuthal magnetic field (Bθ ). in the powered, primary ferrite is computed from,


The magnetic field in the secondary, passive ferrite is where is the secondary 1-to-1 mapped location of the primary location . With the magnetic field oriented into the plane in the primary ferrite and out of the plane for the secondary ferrite, there is a 180° phase shift in the secondary winding. The current density in the secondary ferrite is then,


Substituting for BcTθ from equation (12),


Equations (15) and (16) describe the external current density components that would be required to produce an electric field of the strength and distributions experienced at the powered ferrite material surface. Including the transformer current densities (equations (15) and (16) in equation (8) for the solution of results in the generation of a time-varying electric field adjacent to the unpowered arm of the ferrite in proportion to the electric fields induced by the antenna at the powered arm of the ferrite.

This formulation implicitly assumes no magnetic flux leakage from the ferrites, and no induction of internal eddy currents, maintaining a purely azimuthal (perpendicular to the computational plane) magnetic field vector throughout the simulation domain. Given the low-field coupling (<1000 G) and low driving current frequency (<1 MHz), ignoring flux leakage and eddy currents should have few consequences. Commercially available transformer cores are typically constructed of laminar sheets of ferrite material, inhibiting internal eddy currents.
In previous implementations of the 2-dimensional HPEM, the inductively coupled electric fields were produced by antenna currents perpendicular to the plane of the simulation, which in the absence of an externally applied magnetic field, produces only a perpendicular component of the electric field, Eθ . This component of the electric field is perpendicular to the plane in which plasma transport is computed in the Fluid, Kinetics and Poisson Module (FKPM) of the HPEM in which Poisson's equation is also solved. As a result, in the FKPM Eθ appears only as a heating term in the electron energy equation and does not directly affect plasma transport in the (r,z) for cylindrical or (x,z) for Cartesian planes. When simulating toroidal plasma sources, the inductively coupled electric fields, Ex and Ez , are in the same plane as plasma transport is computed, and so must be accounted for in the FKPM. The following method was used.
The HPEM uses time-slicing techniques in which the solution for electromagnetic fields from the EMM are held constant while computing transport in the FKPM; and plasma properties produced in the FKPM are held constant when computing inductively coupled fields in the EMM. In the FKPM, ion transport is computed using continuity, momentum, and energy equations. The transformer produced are directly included in the momentum and energy equations using their time dependent form,


The consequences of these fields are then naturally accounted for in the resulting ion momenta. Electron transport is addressed using a drift diffusion formulation. was added to the electrostatic electric field, , where is the electrostatic potential produced by solution of Poisson's equation. The electron flux is then


where De and μe are the free electron diffusion and mobility of electrons. Any charge separation that might occur due to drift resulting from is compensated by the value of produced by Poisson's equation. In the time-slicing methodology used in the HPEM, there is no real-time feedback to regulate the value of . Since the drift motion of electrons is proportional to the sum of and , this needed feedback is provided by regulation of so that their sum provides the needed current continuity without there being charge separation. This is achieved by adding the change in electron density due to drift driven by to an effective diffusion term in the semi-implicit solution of Poisson's equation for ,


where is the flux of ion j provided by the momentum equation for that species.

3. TTCP sustained in argon
3.1. Single ferrite core
Plasma properties (ET , electron flux and electron temperature) for the single core TTCP sustained in Ar are shown in figure 2(a). The conditions are an outlet pressure of 1.0 Torr with a flow rate of 500 sccm and 1.0 kW power deposition at a driving frequency of 0.5 MHz. The values are shown at RF phase θ= 180° for which the induced field has a maximum in the counter-clockwise orientation. In figure 2 (and following figures), values are shown using flood contours for which quantities N are plotted in proportion to log10(N). For example, an image plotted using a 2-dec log scale has contours ranging from a minimum of log10(N/100) to a maximum of log10(N).

Figure 2. Plasma properties for the single core TTCP operating in 1 Torr Ar flowing at 500 sccm with 1 kW power deposition. (a) Azimuthal electric field ET , electron flux Φe, and electron temperature Te for phase θ= 180° when the induced electric field ET is oriented counter-clockwise. The flood contours show the magnitude of ET and electron flux Φe, while the arrows show vector direction and magnitude. The maximum value or range of values plotted are noted at the top of each image, with 'dec' indicating the number of decades for log-plots. (b) Electron temperature, electron flux and ion flux during a single cycle at the location shown by the white dot in the flood contour of Te.
Download figure:
Standard image High-resolution imageWith the single ferrite core having a square cross section, the induced electric field ET will be oriented and oscillate in the azimuthal direction. The magnitude of ET , in the absence of absorption, would decrease with increasing radial distance from the center of the core. For the single core RPS, the magnitude of ET is 3 V cm−1 at the inner wall of the plasma channel and 0.4 V cm−1 at the outer wall, corresponding to E/N = 32 Td (1 Td = 10−17 V cm2) at the inner wall and 5 Td at the outer wall. The plasma conductivity at the middle of the channel is 2.7 S cm−1, which provides a skin depth of 4.3 cm, on the order of the channel width of 3.3 cm. With the width of the core (1.3 cm) being small compared to the inner width of the plasma channel (5.8 cm) the importance of the non-circular cross section of the core is lessened and the vector ET maps out a circular path. Consequently, the vector electron flux also maps out a circular closed loop path. The majority of current carried in the secondary loop of the TTCP represented by the plasma is conduction current.
The non-circular geometry of the device does have consequences, as shown by the electron temperature. Te is maximum at 3.7 eV at the inner wall of the plasma channel where ET is largest, decreasing to 3.3 eV at the outer wall. However, with the heating rate of the electron temperature being proportional to ET 2 , small changes in ET resulting from the non-circular core and inner wall produce some azimuthal asymmetries in Te.
With the electron momentum transfer collision frequency at mid-channel being 9.4 × 10⁸ s−1, and ET oscillating at 5 × 10⁵ s−1, there is intra-cycle oscillation in charged particle fluxes and electron temperature. The axial (vertical) component of electron flux and ion flux, and the electron temperature are shown in figure 2(b) during the RF cycle at the location denoted by the white-dot in figure 2(a). The axial electron flux oscillates with an amplitude of 2.2 × 1019 cm−2s−1 (3.5 A cm−2) compared to its random thermal flux of 1 × 1022 cm−2s−1. The oscillation represents a fractional modulation of about 0.2% of the random flux, but sufficient to carry the induced current. The axial flux of Ar+ oscillates with an amplitude of 1.1 × 1017 cm−2s−1. The electron temperature oscillates with an amplitude of 0.22 eV about its mean value of 3.3 eV.
Plasma properties (electron density, power deposition, electron impact ionization source and gas temperature) averaged over the RF cycle are shown in figure 3. The mid-channel electron density is 1.1 × 1013 cm−3, balanced dominantly by Ar+. (The Ar2 + density is 3.4 × 109 cm−3.) This electron density is produced by a maximum power deposition of 4.8 W cm−3, slanted towards the inner wall where ET is maximum. Ionization by bulk electrons has a maximum value of 6.8 × 1017 cm−3 s−1. The plasma potential is positive with respect to the walls by only 15–20 V. Acceleration of secondary electrons by this potential does not produce particularly energetic particles, resulting in the ionization source by secondary electron being about 10−3 that of the bulk electrons. The quantities that are particularly sensitive to the local amplitude of ET, power deposition and ionization source, do show some azimuth variation resulting from the non-circular cross section of the ferrite and the inner housing. For example, power deposition has an azimuthal non-uniformity of about 20% (maximum vs. minimum). With electrons having non-local transport, the uniformity of the electron density is greater, with only 8% azimuthal variation.

Figure 3. Plasma properties for the single ferrite core configuration operating in argon averaged over the RF cycle. (a) Electron density, (b) power deposition, (c) electron impact ionization source and (d) average gas temperature. Operating conditions are 1.0 kW, 0.5 MHz, 1.0 Torr. The maximum value or range of values plotted are noted at the top of each image, with 'dec' indicating the number of decades for log-plots.
Download figure:
Standard image High-resolution imageThe maximum mid-channel gas temperature is 1515 K, resulting from the temperature of the plasma-facing surfaces being held constant at 325 K. This is, to some degree, an artificial constraint based on the assumption of active cooling of the device. The gas dynamics, heating and resulting rarefaction do impact the plasma parameters. Ambient temperature gas is flowed into the top of the plasma source and hot gas is exhausted at the bottom, which produces an axial gradient and is responsible for some portion of the azimuthal (here, top-to-bottom) asymmetry in plasma properties. At a pressure of 1 Torr, large pressure gradients are difficult to sustain. With an outlet boundary condition of 1 Torr, the inlet pressure is 1.03 Torr.
3.2. Dual ferrite core
When operating a TTCP at high power levels, it may not be practical to deliver the entire power through a single ferrite core. In those cases, applying power through two (or more) ferrite cores is a potential solution. In using a dual ferrite core configuration, it is difficult to maintain the ideal azimuthal symmetry of the induced electric field ET that would result from a magnetic field oscillating through a small diameter wire. From a practical perspective, most ferrite cores in closed loops have rectangular cross sections. To maximize the area of the cores (and so reduce their specific power loading) while passing two cores through the central opening of the plasma channels, each core has a large aspect ratio, here 2.8 cm tall × 1.3 cm wide or an aspect ratio of 2. This configuration also results in the vertical faces of the cores being physically closer to the plasma channel than the horizontal faces. These geometrical constraints then result in azimuthal asymmetries in ET and the plasma properties that follow.
Plasma properties for a dual ferrite core TTCP sustained in argon for phase θ= 180° when the induced electric field ET is oriented counter-clockwise are shown in figure 4. The quantities plotted are (a) absolute magnitude of ET with vector electric fields, (b) electron flux magnitude with vector electron flux, (c) power deposition and (d) electron temperature. Operating conditions are 1.0 kW, 0.5 MHz, 1.0 Torr. The directions of the currents in the primary loops powering the ferrites are chosen so that the ET produced by each ferrite are in phase. The ET shown in figure 4 results from the in-phase sum of the electric fields induced by the oscillating magnetic fields guided by the two side-by-side ferrite cores in the center of the device. The magnitude of ET is maximum along the inner vertical wall at 5 V cm−1, compared to 2 V cm−1 along the top horizontal wall.

Figure 4. Plasma properties for dual ferrite core TTCP sustained in argon for phase θ= 180° when the induced electric field ET is oriented counter-clockwise. (a) Absolute magnitude of ET with vector electric fields, (b) electron flux magnitude with vector electron flux vectors, (c) power deposition and (d) electron temperature. Operating conditions are 1.0 kW, 0.5 MHz, 1.0 Torr. The maximum value or range of values plotted are noted at the top of each image, with 'dec' indicating the number of decades for log-plots.
Download figure:
Standard image High-resolution imageThe orientation of ET , shown by the white arrows, forms a closed loop around the central block, resulting in alternating clockwise and counter-clockwise acceleration of charged particles. The electron flux has a maximum value of 5.4 × 1019 cm−2s−1 or 8.6 A cm−2 and aligned counter-clockwise and anti-parallel to ET the induced electric field. In the absence of ET , electric fields are dominated by the ambipolar electric fields which point from the center of the plasma towards boundaries, with electron motion being diffusion dominated towards surfaces. With the superposition of ET , electron motion is instantaneously dominated by the oscillating azimuthal motion. Over an RF cycle, the oscillating azimuthal motion and current density averages to zero, leaving ambipolar diffusion towards walls as the dominate net flux of electrons and ions.
Although the direction of the conduction current density, indicated by the arrows in figure 4(b), forms a closed loop, the conduction current density is itself not continuous. The electron flux and conduction current density are maximum along the equator of the device in the axial direction where the electron density is also maximum (discussed below), which results in the oval-shape loop. The required current continuity is maintained by displacement current in the horizontal direction on the top and bottom of the loop. This offset between conduction and displacement current is an artifact of the topology of this design. With the side-by-side pair of ferrite cores having rectangular shapes, the maximum ET , power deposition and conduction current density are along the internal vertical surfaces of the device.
The division of azimuthal current around the loop between conduction and displacement currents does not necessarily benefit nor detract from the performance of the TTCP. In the extreme where current flows only by conduction current in one portion of the loop and only by displacement current in another portion of the loop, the TTCP would resemble a dielectric barrier discharge (DBD). As with a DBD, the details of proportion between conduction and displacement current affects the impedance of the device which must be accounted for in matching to the power source.
The power deposition (maximum of 24.0 Wcm−3) and electron temperature (maximum 3.2 eV) at θ= 180°, are shown in figures 4(c) and (d). The total RF power density scales as: P = σ E2, and so is maximum at the intersection of the highest plasma conductivity (on-axis in the channel) and the highest electric field strength (adjacent to the inner walls). The electron temperature Te should, in principle, be maximum at the maximum power deposition. There is, however, an azimuthal symmetry that results from oscillations in the plasma potential, discussed below.
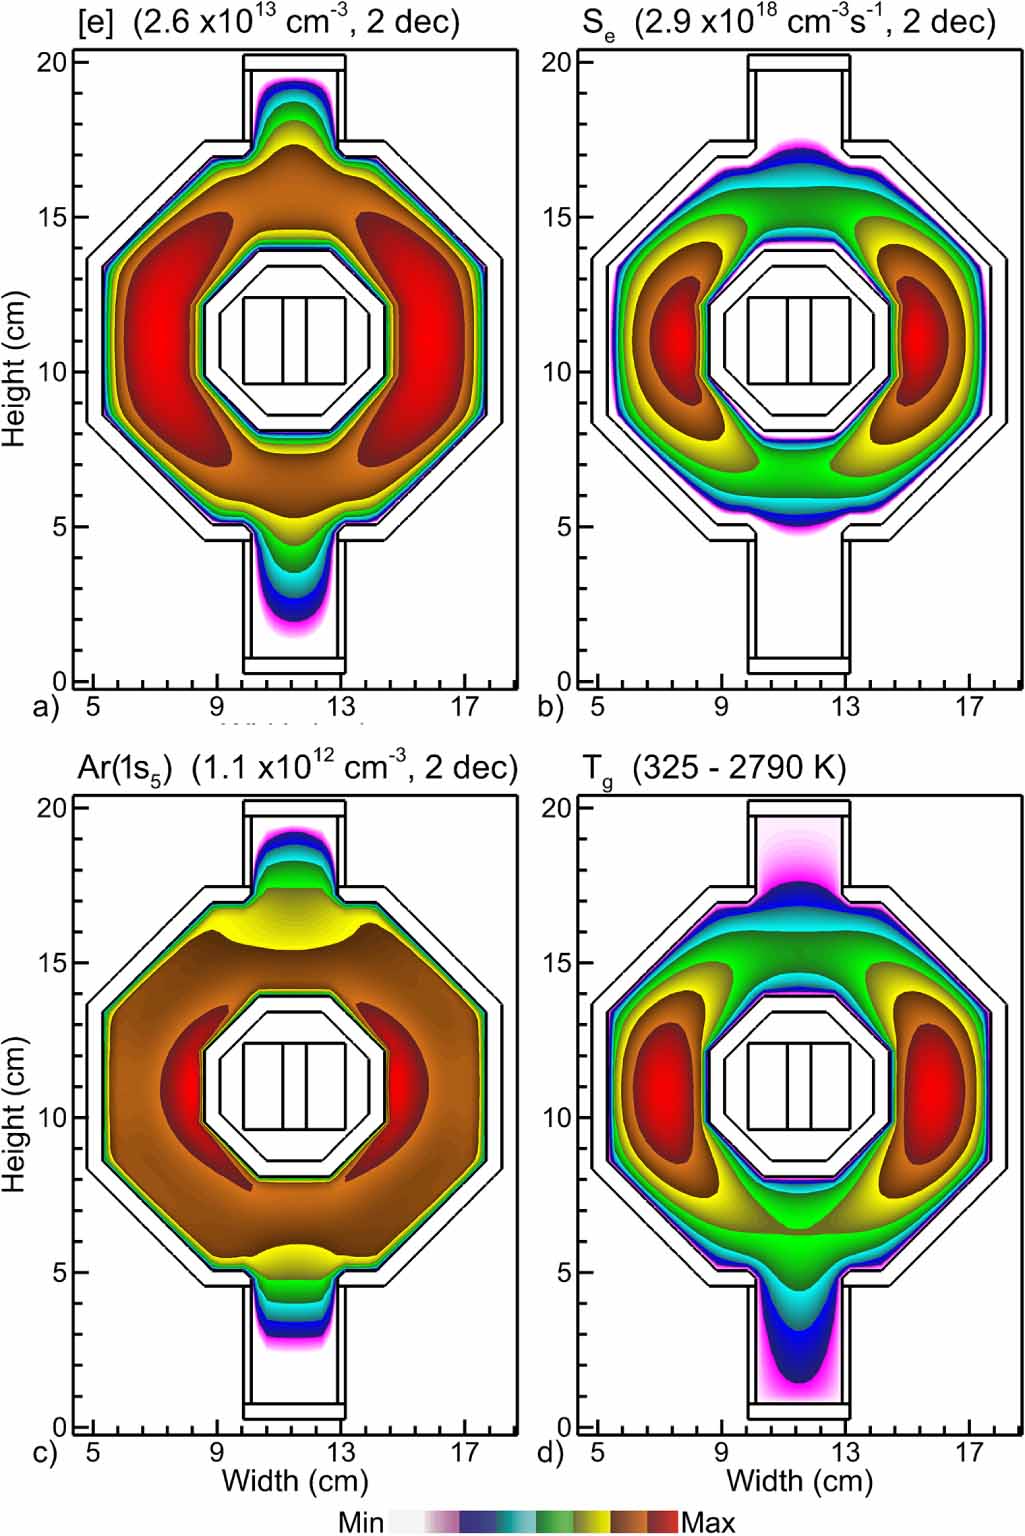
The cycle averaged electron density, electron impact ionization source, Ar(1s5) density and gas temperature are shown in figure 5. The electron density is maximum in the center of the vertical channels at 2.6 × 1013 cm−3 reflecting the maximum in power deposition. The electron density reduces to 1.2 × 1013 cm−3 and 1.0 × 1013 cm−3 in the upper and lower horizontal channels. The reduction in the lower horizontal channel is due to the higher neutral gas temperature and lower gas density that enables higher diffusion losses. The electron density does not significantly vary over the RF cycle, as distinct from the electron flux. The electron density rapidly decays upwards into the inlet and downwards into the outlet tubes. Wall losses dominate this reduction in density as the fractional contribution to dissociative recombination of Ar2 + is small, while the plasma potential gradient inhibits net electron fluxes out of the source.

Figure 5. Plasma properties for the dual ferrite core TTCP sustained in argon averaged over the RF cycle. (a) electron density, (b) bulk electron impact ionization source, (c) Ar(1s5) density and (d) average gas temperature. Operating conditions are 1.0 kW, 0.5 MHz, 1.0 Torr. The maximum value or range of values plotted are noted at the top of each image, with 'dec' indicating the number of decades for log-plots.
Download figure:
Standard image High-resolution imageThe bulk ionization rate is a maximum of 2.9 × 1018 cm−3s−1 sustained by an electron temperature of 3.2 eV (figure 4(d)). At a pressure of 1.0 Torr (with gas heating) the electron collision frequency is ≈109 s−1 and the electron mean free path is between 0.5 cm and 1.0 cm (horizontal and vertical channels, respectively). As a result, electron transport is largely dominated by local fields. Maxima in electron density, temperature, and ionization source correlate with the maximum in RF power density. The plasma is predominately sustained through direct electron impact ionization of ground state argon and multistep ionization of the Ar(1s5) and Ar(1s4) states. The density of Ar(1s5), shown in figure 5(c), is maximum along the inner walls at 1.1 × 1012 cm−3. Multistep ionization of the Ar(1s4) and Ar(1s5) states contribute approximately 10% of the total bulk Ar+ ionization rate.
In contrast to the single ferrite configuration, the asymmetry in power deposition also produces an asymmetry in gas heating, shown in figure 5(d). The gas temperature is maximum mid-channel at 2790 K, significantly higher than the single ferrite device due to the locally higher power deposition. With cool gas being injected at the top and hot gas being pumped out at the bottom, additional asymmetries are introduced. As with the single-ferrite configuration, there is only a moderate pressure gradient across the device. The inlet pressure is 1.05 Torr for an outlet pressure of 1.0 Torr. The pressure gradient is nearly twice that of the single-ferrite source due to the higher local gas temperature, which requires a larger body force from the pressure gradient to maintain the flow rate.
The electron flux, plasma potential and electron temperature are shown in figure 6 as a function of phase during the RF cycle, where θ= 0° is the phase of maximum clockwise azimuthal electric field and θ = 180° is the phase of maximum counterclockwise azimuthal electric field. Properties for the phases θ = 180°–360° are symmetric to θ = 0°–180°. The electron flux, Φe, varies from a maximum of 4.2 × 1019 cm−2 s−1 (6.7 A cm−2) at θ= 0° oriented dominantly in the azimuth direction, decreasing to essentially zero in the azimuthal direction at θ = 90°, before changing direction and rising back to Φe = 4.2 × 1019 cm−2 s−1 at θ= 180° dominantly in the azimuthal direction in the counter-clockwise direction. The argon ion flux ΦAr+ (not shown) does not instantaneously respond to the applied RF fields at 500 kHz. Instead ΦAr+ is predominately orientated towards the walls and remains approximately constant throughout the RF phase cycle. The maximum in ΦAr+ is 2.1 × 1018 cm−2 s−1 incident onto the inboard walls within the vertical channels. The ion flux to the dielectric walls must be balanced, averaged over the RF cycle, by the electron flux. This balance is achieved. However the azimuthal electron flux in the (counter direction) of ET is large in comparison. At θ= 90°, the azimuthal ET passes through zero magnitude and the electric fields in the plasma channel are dominated by ambipolar electric fields. At that phase, the magnitude of the electron flux is reduced by an order of magnitude, while its direction is largely towards boundaries. For example, in figure 6(a) for electron flux at θ= 90°, the inner band of electron flux is directed towards the inner walls, and the outer band is directed towards the outer walls.

Figure 6. Plasma properties for the dual core TTCP sustained in argon for phase θ = 0° to 180°, where θ = 0° is when the induced electric field ET is oriented at its maximum clockwise. (a) Absolute magnitude electron flux and vector flux. (The flux vectors for θ = 90° show direction only.) (b) Electric potential and (c) electron temperature. The conditions are 1.0 kW, 0.5 MHz, 1.0 Torr. The maximum value or range of values plotted are noted at the top of each image, with 'dec' indicating the number of decades for log-plots.
Download figure:
Standard image High-resolution imageThe phase-resolved plasma potential, shown in figure 6(b), exhibits an azimuthal rotation. This azimuthal oscillation in the plasma potential results from the azimuthal oscillation of ET and the electron density not being azimuthally symmetric. The electron flux rapidly responds to the acceleration resulting from oscillation of ET while the ions are slowly accelerated in the opposite direction by ET . The azimuthal gradients in electron density then result in space charge separation. This space charge is produced along the azimuthal flux lines of the electrons. The response of the system to the induced space charge is to generate azimuthal components of the electrostatic field to limit further space charge separation. These confining azimuthal components of the electric field then produce local maxima in and azimuthal oscillation the plasma potential. At θ= 90° when the charge separation driven by ET is a minimum, the plasma potential is symmetric across the midplane.
A perfectly symmetric azimuthal geometry would be produced by a circular secondary arm of the transformer, and circular inner and outer walls of the RPS. These conditions would then produce an azimuthally symmetric ET , ionization source, electron and ion densities and plasma potential. The electron flux would uniformly increase, decrease and reverse direction in the azimuthal direction which, in the absence of azimuthal gradients, negates the need for a compensating electrostatic electric field to confine space charge. Even with nominally circular geometries for the secondary arm of the transformer and walls, there are invariably gas inlets and outlets that break the azimuthal symmetry. This break in symmetry produces azimuthal gradients in plasma properties, as shown by the single-ferrite TTCP discussed earlier.
The electron temperature as a function of phase is shown in figure 6(c). Similar to the plasma potential, there is an azimuthal oscillation in the electron temperature which mirrors that of the plasma potential while the RF heating source does not exhibit this oscillation. The oscillation results in part from convection of electrons in the ET electric field and in part by extraction of electron energy in producing the confining electrostatic fields that counter ET .
With the electron collision frequency producing a time between collisions being a small fraction of the RF period (2 μs), there is some equilibration of the plasma properties with the oscillation of ET . For example, electron temperature, argon excited state density and plasma potential are shown in figure 7(a) averaged over the plasma regions during two RF cycles. Excited states have densities of low-to-mid 1011 cm−3 which oscillate with ±10% over the RF cycle. In principle, the oscillation in plasma properties should be symmetric over any given cycle. That symmetry is broken for excited state densities due to the spatial inhomogeneity in electron temperature. Te at three locations during an RF cycle is shown in figure 7(b). (The schematic at left shows power deposition averaged over the RF cycle.) Te is maximum and oscillates with the largest amplitude at the maximum in power deposition. The location at the top of the reactor has a lower Te than its mirrored location at the bottom. This asymmetry results from gas heating and gas flow, which produces a plume of hotter, less dense gas lower in the reactor.

Figure 7. Plasma properties as a function of time. (a) Plasma potential, argon excited state density and electron temperature averaged over the plasma region for 2 RF cycles. (b) Electron temperature at three locations indicated by the schematic showing power deposition. Operating conditions are 1.0 kW, 0.5 MHz, 1.0 Torr of argon.
Download figure:
Standard image High-resolution imagePlasma properties (power deposition, electron density, electron temperature and gas temperature) are shown in figure 8 for operating in argon at 1 Torr for a total power deposition between 250 W and 1250 W. Over this power range, the maximum electron density increases from 9.6 × 1012 cm−3 to 3.1 × 1013 cm−13, a factor of 3, while the total electron inventory (spatial integral of electron density) scales nearly linearly with power deposition. The less than linear increase in maximum electron density while the inventory scales nearly linearly with power deposition results from the more spatially extended power deposition at high power. The greater gas heating at the higher power results in more severe rarefaction and a broader distribution of plasma density. The maximum gas temperature increases from 1380 K to 3290 K, with the gas density at the peak of power deposition rarefying from 7.1 × 1015 cm−3 to 2.9 × 1015 cm−3.

Figure 8. Plasma properties averaged over the RF cycle as a function of power deposition (250 W to 1250 W) in argon. (a) Power deposition, (b) electron density, (c) electron temperature and (d) gas temperature. Operating conditions are 0.5 MHz, 1.0 Torr. The maximum values plotted are noted at the top of the sequence or in the image, with 'dec' indicating the number of decades for log-plots.
Download figure:
Standard image High-resolution imageBai and Sawin spectroscopically measured gas temperatures in a similar TTCP device sustained in argon by observing the spectra of an added trace amount of N2 [20]. Their method resolved gas temperature as a function of position in a plane perpendicular to the gas flow and averaged axially along the flow direction. For an average power deposition of 4.5 W cm−3 at 1 Torr, the maximum gas temperature was 1560 K. The data in figure 8 was processed to best replicate the measurement technique used by Bai et al, and we predict a temperature of 2055 K. The experimental measurements were made for at least twice the equivalent flowrate, which may account for the lower gas temperature.
The electron temperature becomes more highly confined as the power deposition increases. This confinement in Te results from several factors. From 250 W to 1250 W, the conductivity at peak power deposition increases from 2.2 S cm−1 to 4.4 S cm−1, producing a decrease in skin depth from 4.8 cm to 3.0 cm. This decrease in skin depth produces more localized electron heating. The decrease in gas density produces an increase in E/N (based on ET ) from 33 Td at 250 W to 104 Td at 1250 W with ET increasing from 2.3 V cm−1 to 3.1 V cm−1. With electron heating rates scaling as ET 2, heating again becomes more local.
4. TTCP sustained in Ar/NF3 mixtures
The use of RPSs in microelectronics fabrication is typically as a source of halogen radicals (e.g. F, Cl) or oxygen atoms for isotropic etching and chamber cleaning. The source gases can be highly attaching, which significantly affect the ionization dynamics and macroscopic discharge properties of the RPS. A widely used gas for F atom production is nitrogen-trifluoride, NF3. F atom production in NF3 containing plasmas is efficient due to the large dissociative attachment, excitation, and recombination rate coefficients for electron interactions with NF3.
With NF3 being a thermally attaching gas, it is experimentally difficult to initiate the plasma in the purely inductive electric field produced by the transformer. The E/N that can be produced in the device is not sufficient to break down pure NF3. In commercial operation, this quandary is addressed by the discharge being initiated in a flow of argon. Once the plasma is ignited, the flow is progressively diluted with NF3 while maintaining power until the flow consists of only NF3. Computationally, igniting the plasma in pure NF3 is also challenging for the same reasons as observed experimentally. Unrealistic currents in the primary would be required to produce a large enough E/N through purely inductively coupling to initiate a plasma in NF3. The Ar/NF3 discharges discussed here were therefore ignited in pure argon into which an Ar/NF3 mixture was flowed, mimicking startup practices in commercial devices.
We first discuss plasma properties of the RPS operating in pure NF3 using the dual ferrite-core geometry shown in figure 1(b) for a power deposition of 1 kW and flowrate of 500 sccm. The outlet pressure boundary condition is 1 Torr. Plasma properties (power deposition, electron impact ionization source, electron density and gas temperature) averaged over the RF cycle are shown in figure 9. In the image for ionization source, the absolute value of the source is plotted. The regions labeled '+' are net positive source of electrons where ionization dominates. The regions labeled '−' are net negative sources where attachment and recombination dominate. The resulting densities of NF3, NF2, NF, F, N and N2 are shown in figure 10.

Figure 9. Plasma properties averaged over the RF cycle for the TTCP sustained in pure NF3 for 1 kW, 1 Torr, 0.5 MHz, 500 sccm operation. (a) Power deposition, (b) electron impact ionization source, (c) electron density and (d) gas temperature. The maximum value or range of values plotted are noted at the top of each image, with 'dec' indicating the number of decades for log-plots. In the plot for ionization source, the absolute value of the source is plotted with the white line separating positive and negative sources. The regions labeled '+' are net positive sources of electrons where ionization dominates. The regions labeled '−' are net negative sources where attachment and recombination dominate.
Download figure:
Standard image High-resolution image
Figure 10. Neutral densities produced in the TTCP sustained in pure NF3 for 1 kW, 1 Torr, 0.5 MHz, 500 sccm operation—NF3, NF2, NF, F, N and N2. The plots for N and N2 include excited states of those species. Densities are plotted on a 2-decade log-scale with the maximum value indicated in each frame.
Download figure:
Standard image High-resolution imageThe mode of operating the TTCP is to adjust the current flowing through the primary windings of the transformer to deliver the specified power in the secondary current loop represented by the plasma. The resulting ET will generate a plasma that delivers the specified power preferentially into those regions having the lowest impedance (and highest conductivity). The flow of NF3 into the reactor produces a highly attaching environment. The gas is essentially pure NF3 in the top of the reactor prior to there being any dissociation of the feedstock gas. With power deposition, gas heating and rarefaction occurring lower in the reactor, the gas density of highly attaching gas is larger at the top of the reactor. This higher density produces a lower E/N for a given electric field. The end result is that the plasma cannot be sustained in the upper portion of the reactor. This inability to sustain the plasma in the upper portion of the reactor is exacerbated by NF3 being a thermally attaching gas. In the upper region of the reactor which has a low electron temperature, dissociative attachment dominates over the negligible rate of ionization. The plasma is dominantly sustained in those regions of the reactor where the NFx density decreases to the point that attachment no longer dominates over ionization.
The extinction of the upstream electron population results from electrons diffusing upwards that are lost to dissociative attachment to the NF3 feed gas and NFx fragments. Dissociative attachment to NF3 is a thermal process having essentially no threshold energy and so attachment is rapid for even low energy electrons. The electron density is largely confined to the region of positive electron impact source (figure 9(b)) where the electron temperature is high enough (maximum Te = 4.1 eV) to sustain net positive ionization. With the electron energy relaxation length being 0.5–1 cm, the system rapidly transitions to net attachment and recombination within a few cm of the maximum of net positive ionization. The net positive ionization source has two distinct maxima of 3 × 1019 cm−3s−1 aligning with the location of highest electron density. The region of net positive ionization is surrounded by a halo of net attachment and dissociative recombination having a maximum loss of 4.2 × 1017 cm−3s−1. The electron source is net negative both upstream and downstream of the maximum in power deposition, sustained by a small net electron current (2 × 1018 cm−2s−1, 0.3 A cm−2) from the region of net positive ionization. With the gas flow being laminar, there is little mixing of the dissociated gas in the lower portion of the device and the non-dissociated gas in the upper portion of the device. So the transition from attachment dominated to net ionization can be rapid.
While the total volume integrated electron inventory is reduced when operating in NF3 compared to pure argon, the maximum electron density is similar to the argon-only base case at 2.9 × 1013 cm−3. With the specific power deposition (eV/collision) being larger for the molecular gas compared to argon, the total 1 kW of power deposition in NF3 can be sustained with a lower total inventory of electrons. While the plasma density, and hence plasma conduction current loop, is discontinuous in the NF3 discharge, there is toroidal displacement current flowing through the upstream region such that is conserved within each closed toroidal loop as with the pure argon case.

For the same power deposition that produced a maximum gas temperature of 2790 K in argon, the maximum gas temperature in NF3 is 3500 K. The higher gas temperature results from the more localized power deposition (maximum 70 W cm−3) and more localized electron impact dissociative processes (attachment, electronic excitation, recombination) that produce gas heating through Franck–Condon relaxation that produces hot fragments. The gas temperature is high enough that there is a significant contribution of thermal dissociation of NF3. For example, at the top boundary between the positive and negative electron sources, the gas temperature is 2900 K, the electron temperature is 3.8 eV and the electron density is 1.4 × 1012 cm−3. For these conditions, approximately 25% of the dissociation of NF3 is due to heavy particle thermal processes (e.g. NF3 + M → NF2 + F + M, with M being a third body.) For a similar TTCP source operating in NF3, Gangoli et al [4] used global modeling to determine that dissociation of NF3 was dominated by non-thermal electron impact for gas temperatures less than 2000 K at electron temperatures of 4–5 eV, and dominated by thermal processes at higher temperatures. Li et al [24] measured NF3 dissociation of about 95% for a similar device. The operating conditions of that device (pressure, flow rate and power) resulted in a comparable specific energy deposition (eV/molecule) as in this investigation.
Fluorine negative ions (anions), produced by dissociative attachment to NFx and F2, are the dominant negatively charged heavy species. At the top boundary between the positive and negative ionization sources, the F− density is 2 × 1012 cm−3 and the electron density is 1 × 1012 cm−3. Moving towards the top of the device, the electron density rapidly decays due to dissociative attachment to NF3. For example, in the middle of the vertical channel (2 cm higher in the reactor) the F− density is 1.2 × 1012 cm−3 and the electron density is 5 × 1010 cm−3. In the top of the device where the electron density is negligible, the F− density is 1.7 × 1010 cm−3 balanced by a nearly equal density of NF3 + forming an ion-ion plasma. These species are not produced locally but rather diffuse from the bulk plasma under influence of a weak ambipolar electric field that accounts for the difference in diffusivities of F− and NF3 +.
Depletion of the upstream electron density significantly reduces the plasma conductivity. The maximum conductivity is 4 S cm−1 at the location of maximum electron density, decreasing to 1–10 μS cm−1 upstream. As the upstream conductivity reduces, the RF power is coupled into a smaller total volume, co-located with the downstream plasma density.
Dissociation of NF3 produces NF2, NF, N, and F neutral fragments, which appear as axial layers within the source as the NF3 flows from the inlet and undergoes sequential dissociation processes, as shown in figure 10. NF3 is rapidly dissociated by electron dissociative excitation and attachment upon entering the source with its density decreasing over two orders of magnitude from 3.2 × 1016 cm−3 at the inlet to the boundary of the plasma zone (height = 10 cm). Dissociation of NF3 produces maximum densities of NF2 of 6 × 1014 cm−3 (height = 11 cm). Dissociation of NF2 in turn produces maximum NF densities of 7 × 1013 cm−3 (height = 9 cm). The NF is finally dissociated to produce, N atoms. Surface recombination of NF2 + and NF+ produce sources of NF2 and NF at the walls which produces local maxima in the densities of NF2 and NF. The inlet flux of NF3 is 2.5 × 1019 cm−2s−1. The combined NFx (x = 1,2,3) at flux at the outlet is 1.8 × 1018 cm−2s−1, representing about 92% fractional dissociation NFx .
Atomic nitrogen is produced following the electron impact dissociation of NF, which energetically favors the production of N + F−. The branching of electron impact dissociation of NF2 to N + 2F makes a small contribution. The maximum atomic nitrogen density is of 1.5 × 1014cm−3 in the outlet tube. Molecular nitrogen is produced by recombination of N on the walls reaching a maximum density of 1.3 × 1015 cm−3 in the outlet of the tube, of which about one-third is vibrationally excited. Once N2 is formed lower in the reactor, it is a terminal species in terms of producing N atoms as the rate of electron impact dissociation of N2 is low.
The F atom density increases throughout the source from the inlet to the outlet as all dissociative processes involving NFx produce F atoms. The maximum density of F at the outlet is 1.2 × 1016 cm−3 with a flux of 6 × 1019 cm−2s−1, representing the largest product leaving the reactor. F is produced by the successive dissociation of NF3 to NF2 to NF to N + F. F2 is produced by 3-body recombination of F while surface recombination of F producing F2 occurs throughout the source. The flux of F2 at the outlet is 5 × 1018 cm−2 s−1, about 10% that of the outlet F flux.
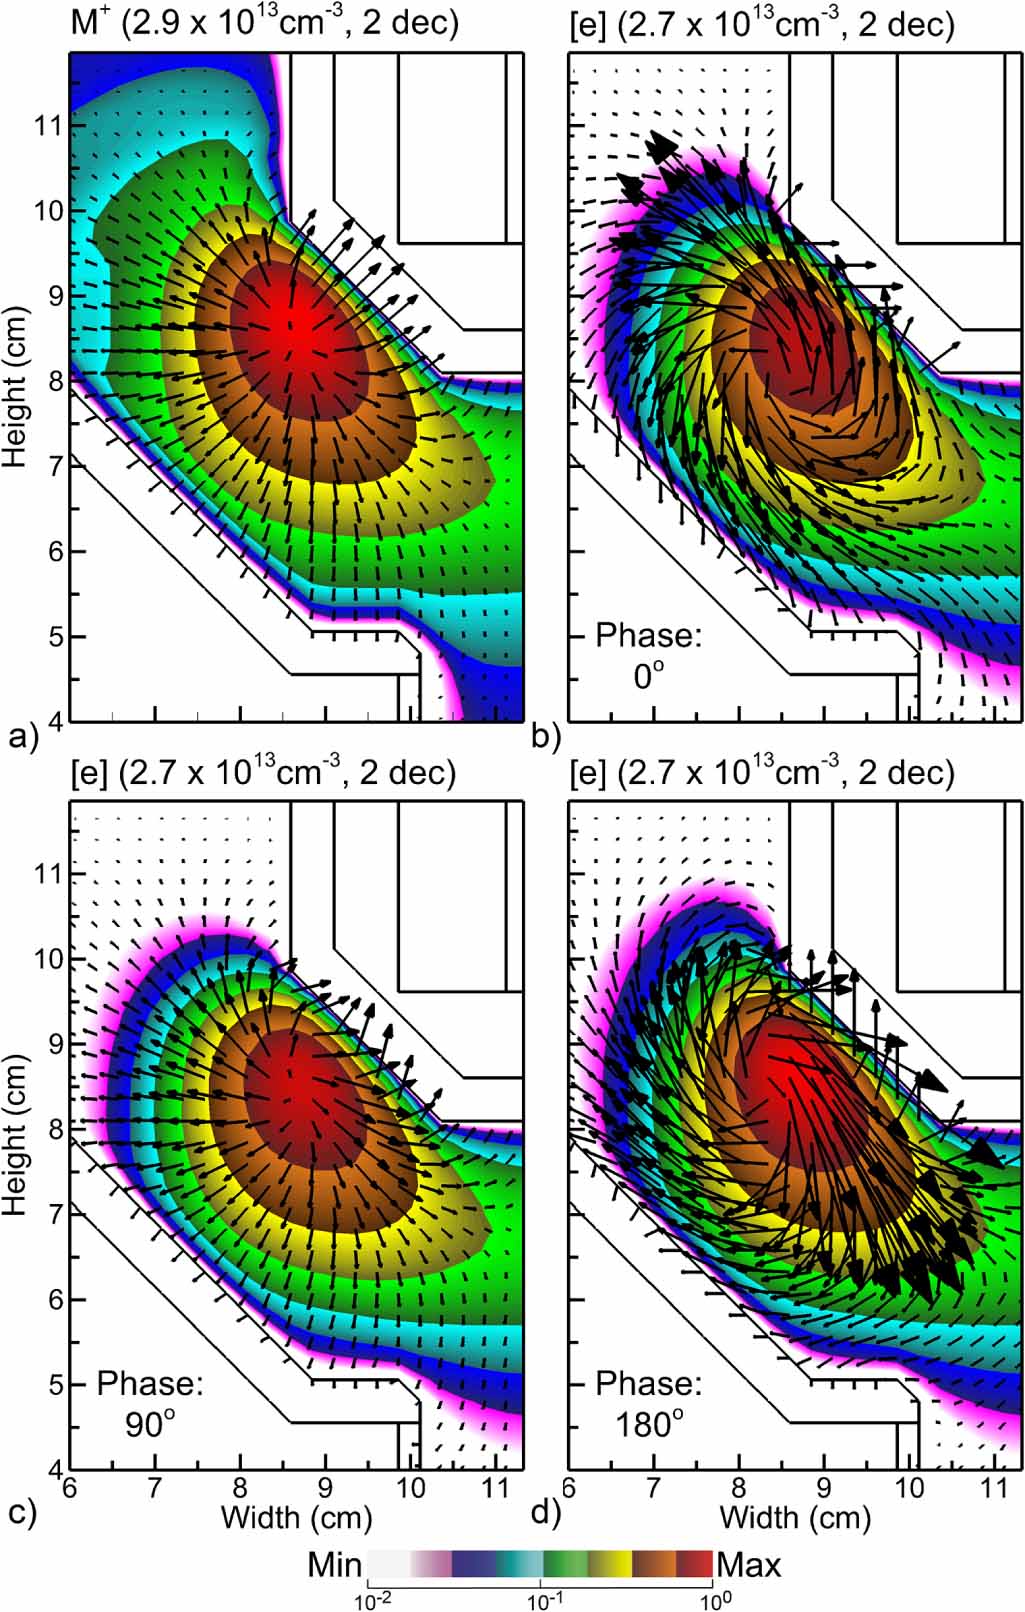
The confined plasma resulting from the flow of highly attaching NF3 and the azimuthally driven electron currents resulting from the oscillating ET produce vortex motion of the electrons while maintaining charge balance. When averaged over the RF cycle, the flux of electrons to the dielectric surfaces of the plasma channel must equal the sum of the flux of positive ions. (The flux of negative ions is small in comparison).
The RF averaged density of positive ions and flux vectors are shown in figure 11(a). The corresponding values for electrons are also shown in figure 11 for phases of 0° (ET oriented fully clockwise), 90°(ET = 0) and 180° (ET oriented fully counter-clockwise). The electron fluxes must simultaneously satisfy the need to match the ion fluxes to surfaces (averaged over the RF cycle) while carrying the azimuthal toroidal plasma current. The ambipolar component of the electron flux that matches the ion flux points radially outwards from the maximum in electron and ion density. The toroidal current component of the electron flux is maximum near the inner wall, while alternating in the azimuthal direction. The vector sum of these flux requirements results in vortex-like electron flux vectors. For the 0° phase, the vortex is counter-clockwise and at 180° the vortex is clockwise. For the 90° phase when ET = 0, the electron fluxes are dominated by their ambipolar component and point towards surfaces.

Figure 11. Plasma transport properties of positive ions and electrons for the TTCP operating in NF3. (a) Density of the sum of all positive ions with ion flux vectors. The electron density and electron flux vectors are shown for phase θ = a) 0°, (b) 90° and (c) 180°. Densities are plotted on a 2-decade log-scale with the maximum value indicated in each frame. Operating conditions are 1.0 kW, 0.5 MHz, 1.0 Torr.
Download figure:
Standard image High-resolution imageThe confinement of the plasma by the flow of highly attaching NF3 is a function of the NF3 flow rate. The electron density and electron impact ionization source are shown in figure 12 for Ar/NF3 inlet mole fractions of Ar/NF3 = 100/0 (pure Ar) to Ar/NF3 = 0/100 (pure NF3). The conditions are 1 kW, 500 sccm and 1 Torr outlet pressure. With inlet mole fractions of only a few percent, the plasma in the upper portion of the reactor is extinguished, producing the confined plasma downstream. With Ar/NF3 = 95/5, the confined plasma is nominally centered at the maximum of ET , as with the pure argon, though extending further downstream into the fully dissociated NF3 than extending upstream into the incoming flow of NF3. The ionization source has distinct regions of net positive and net negative electron production. With progressively larger NF3 inlet mole fractions, the confined plasma decreases in spatial extent and shifts lower in the reactor. The plasma stabilizes where a critically large fraction of the NFx has been dissociated, and rates of attachment have diminished. The maximum plasma density and ionization source both increase in the more confined plasma with an increase in NF3 fraction so that the total power deposition remains 1 kW.

Figure 12. Plasma properties averaged over the RF cycle for the TTCP operating in Ar/NF3 gas mixtures ranging from pure Ar to pure NF3. (a) Electron density and (b) electron impact ionization source. The images are log-plots (2-decades for electron density and 3-decades for ionization source) with the maximum value noted in each frame. In the plot for ionization source, the absolute value of the source is plotted with the white line separating positive and negative sources. The regions labeled '+' are net positive sources of electrons where ionization dominates. The regions labeled '−' are net negative sources where attachment and recombination dominate. Operating conditions are 1 kW, 0.5 MHz and 1 Torr.
Download figure:
Standard image High-resolution image
5. Concluding remarks
RPSs are employed in semiconductor device manufacturing to provide a nearly charge-free source of, for example, halogen radicals for chamber cleaning and isotropic etching. The TTCP is an efficient RPS for delivering high power densities when using highly attaching gases. Results were discussed from a 2-dimensional computational investigation of single-ferrite core and dual-ferrite core TTCPs sustained in Ar, NF3 and Ar/NF3 mixtures. In single-ferrite core configurations, the secondary of the transformer represented by the plasma consists of a closed conduction current loop with plasma properties (electron density, power deposition) having azimuthal symmetry. Current in the secondary is carried dominantly by electron conduction. When using a dual-ferrite core configuration, geometrical limitations result in power deposition and plasma densities that have local maxima. Although there is a closed plasma current loop, the current is carried by a combination of conduction and displacement current.
Operation in Ar/NF3 mixtures substantially altered the discharge topology, a consequence of depletion of the upstream electron density due to dissociative attachment to NF3 and its dissociation fragments. When operating in NF3, the maximum in electron density migrated downstream to where dissociation of the NF3 and the subsequent decrease in attachment enabled the plasma to be sustained. The upper volume of the plasma source contained a low density (1010–1011 cm−3) F−/NFx + ion–ion plasma. When increasing the NF3 mole fraction in Ar/NF3 mixtures, the plasma becomes more confined with a higher gas temperature. That higher gas temperature contributes to radical production through thermal dissociation of the NF3.
Perhaps the greatest uncertainties in this investigation center on thermodynamics and heat transfer, particularly with electronegative gas mixtures in which power deposition can be highly confined. The local gas heating resulting from the confined power deposition produces local rarefaction of the gas which increases E/N, leading to more heating and more rarefaction. This is potentially an unstable condition that in other discharges produces arcs and constriction. In this device, heat transfer to the walls of the plasma stabilizes this potential instability. However, that stabilization is sensitive to heat conduction through the plasma, and the temperature of and heat transfer through the bounding materials. The heat transfer is sensitive to the thermal conductivities of the bounding materials and cooling of the device. The heat conduction through the plasma is sensitive to transport coefficients of the dissociation fragments which are poorly known. For the usual operating conditions, we do not expect the flow to be turbulent, however, the onset of turbulence would add additional uncertainties.
With the goal of having total dissociation of the feedstock halogen donor, there are several tradeoffs that are made. For example, increasing flow rate of the halogen donor produces a more confined plasma at a lower location in the device, which may then have less favorable transformer coupling. Total power deposition will normally scale with halogen flowrate so that the specific energy deposition (eV/molecule) remains above a critical value. An added benefit of this scaling is maintaining the spatial distribution of the plasma to have favorable transformer coupling.
Acknowledgments
This work was supported by MKS Instruments, the U.S. Department of Energy Office of Fusion Energy Sciences (DE-SC0020232), and the National Science Foundation (CBET-2032604).
Data availability statement
The data that support the findings of this study are contained in the paper and are available from the corresponding author upon reasonable request.
Conflict of interest
The authors have no conflicts of interest to disclose.