

Abstract
We report magnetic, transport, dielectric, and complex impedance of polycrystalline double perovskite EuPrCoMnO6 which crystallizes in disordered orthorhombic phase with space group Pnma. The DC magnetization shows two successive ferromagnetic transitions around 146 K and 138 K. The temperature and magnetic field variation of DC-susceptibility suggest the existence of Griffith phase and spontaneous exchange bias. AC susceptibility measurement shows a glassy dynamic behaviour near ferromagnetic transition. Further, a re-entrant glassy dynamic state is seen at a low temperature around 40 K. Temperature-dependent resistivity shows semiconducting/insulating nature, which gets increased under the application of magnetic field, showing positive magnetoresistance. The dielectric study shows usual frequency-dependent step-like behaviour with a colossal dielectric constant near room temperature. The complex impedance study shows both grain and grain boundary contribute to the electrical properties. The observed properties suggest the material can be used for spintronic devices and high dielectric applications.
Export citation and abstract BibTeX RIS
1. Introduction
Day by day increasing demand for technology for energy devices requires the growth of high-performance materials. Such materials should develop some novel characteristics that can be put up with long-term services even in severe environments [1–5]. The possessing of electric and magnetic orders simultaneously has been of prime interest for their potential applications for next-generation electronic devices [1–3]. In this aspect, a class of material known as double perovskite (DP), A2BB'O6 (where A: rare-earth ions; B, B': transition metal ions) has been much investigated owing to their various charismatic properties like multiferroicity, spin-phonon coupling, cationic ordering, colossal magneto-resistance, and magneto-capacitance, etc [6–10]. These compounds mostly crystallize either in a disordered orthorhombic structure with space group Pbnm or in an ordered monoclinic structure with space group P21/n [9]. The ordered DPs mainly show ferromagnetism (FM) via B2+–O2-–B'4+ super-exchange interaction [7]. However, there is always possible that in the ordered state itself few B and B' cations swap out their crystallographic positions, thus introducing anti-site disorder (ASD) [6, 8] which may prompt additional anti-ferromagnetic (AFM) interactions within the system in the form of B2+–O2-–B2+ or B'4+–O2-–B'4+ and hence weakens the FM. The ASD also has profound effects on the many physical properties of DPs, especially the magnetic properties and can lead to fascinating phenomena like exchange bias, low-temperature spin-glass states, room temperature giant magneto-dielectricity, etc [11, 12].
In DPs, the substitutions of different A-site cations modify the B–O–B' bond angle and length. Consequently, transition temperature changes and leads to an inhomogeneous magnetic ground state through multiple magnetic interactions build up in the system. The same has been reported in numerous perovskites in the form of clustered phase or Griffiths-like-phase (GP) where an unusual magnetic state of short-range FM clusters of different sizes appears just above the transition temperature (TC) up to a certain temperature TGP [8, 10, 13]. However, when a system has multiple magnetic phases, an exchange bias (EB) will appear owing to the formation of the unidirectional FM exchange anisotropy at the interfaces of two different magnetic phases [14, 15]. The EB effect is a very important phenomenon for technological purposes as it is tremendously useful in giant magneto-resistive random access memory devices, read-heads in magnetic recording, in permanent magnets, in stabilizing nanoparticles, etc. These interesting phenomena give the idea to elaborate the magnetic property of DPs much more.
Additionally, the existence of II-type of ferroelectricity, driven by magnetostriction has been observed in DPs A2CoMnO6 due to breaking of inversion symmetry through distortion of Ferro/antiferro bonds similar to observed ferroelectricity in Ca3CoMnO6 [16–20]. The ferroelectric and magnetic transition in DPs Lu2CoMnO6 and Y2CoMnO6 occurs at the same temperature ∼35 K and 80 K, respectively while its origin has been supposed to be the same as Ca3CoMnO6 [18–20]. Though the structures of DPs are much different than the Ca3CoMnO6, particularly the second-nearest-neighbour Co–Co/Mn–Mn distances are much larger in A2CoMnO6 than that of Ca3CoMnO6. Thus, the strength of exchange interactions in the two systems will be different. Earlier, Jia et al has performed a theoretical study using the first-principle calculations to see the origin of ferroelectricity and magnetic ordering [21]. They found that the spin ordering originates due to a subtle competition between the ferromagnetic Co–O–Mn super-exchange and antiferromagnetic Co–Mn direct-exchange interaction along a particular c-axis. So, we are highly motivated to investigate magnetic and dielectric studies of similar DPs.
The previous study of many DPs with 'A' site non-magnetic ions like La, Y, Lu, Eu has drawn extensive attention as they exhibit the most exciting feature in the isothermal magnetization curve i.e. meta-magnetic-transition (MMT) [22–26]. In the present investigation, we have chosen a DP system, such that 50% of A-site is occupied by non-magnetic ions and that of other 50% by magnetic ions i.e. EuPrCoMnO6 (EPCMO). We have reported magnetic properties and the reason behind it of one of the end members Eu2CoMnO6 (ECMO) in our earlier investigation [26]. It has been observed that ECMO has much attention-grabbing property viz. MMT, spin-phonon coupling wide band-gap, GP, etc. However, other end member Pr2CoMnO6 (PCMO) has been investigated somewhere else [13]. PCMO also has fascinating physical properties like double FM transitions, GP, strong spin-phonon coupling effect, EB, etc. Thus, the incorporation of ECMO and PCMO together may lead to some extraordinary behaviour. In the present manuscript, we have reported the coexistence of giant dielectric constant, different magnetic phases, and strong magneto-resistance in EPCMO suggesting this material as a multi-functional material.
2. Experimental details
The polycrystalline pellets of DP sample EPCMO were prepared via solid-state reaction route as described elsewhere [26]. The mixture of starting materials (with a high purity of greater than 99.99%) Eu2O3, Pr6O11, CoO, and Mn2O3 were taken in appropriate proportion and was ground for 30 min and then heated at 1000 °C in air for 24 h. After cooling to room temperature, it was again ground for 20 min and heated at 1100 °C for 36 h. This process of heat treatment was repeated further at 1200 °C and 1250 °C. The final powder was reground and pressed into pellets with a diameter of around 10 mm and width around 1 to 2 mm. These pellets were sintered at 1300 °C for 48 h. Finally, it was cooled to room temperature at a very slow rate (0.5 °C min−1) to avoid cracks in pellets. A piece of the sintered pellet was ground for x-ray diffraction (XRD) measurement. The XRD pattern of the powdered sample was collected using a Rigaku Miniflex-II powder diffractometer. The XRD pattern was analyzed with Fullprof software using the Rietveld method. The magnetic properties were measured via a quantum design MPMS3 (magnetic property measurement system), which is a superconducting quantum interference device magnetometer. Dielectric and impedance measurements were carried out using a highly sensitive Keysight E4980A Precision LCR meter with a He-cooled CCR (closed-cycle refrigerator). The electrical DC resistivities without and with magnetic field were measured with a Keithley 6517B Electrometer and CCR using the standard 2-probe method.
3. Result and discussion
3.1. Structural analysis
The double perovskite structures have been derived out of simple perovskite structure of general formula ABO3 (ideally cubic structure with space group Pm-3m), where exactly half of B site cations is replaced by another B' cation, and a rock salt ordering between these two is achieved [27]. The parent perovskite system ABO3 is much interesting and a slight structural variation via different doping may lead significant effect on the various physical properties as all the physical and chemical properties are based on the crystal structure of materials. The magnetic properties of the double perovskites are much affected by the way of distribution of B-sites atoms. For example, in R2CoMnO6 double perovskites, Co2+–O2-–Mn4+ interaction cause antiferromagnetic ordering whereas Co2+–O2-–Co2+ and Mn4+–O2-–Mn4+ interaction causes antiferromagnetic ordering. The substitution of B' for B, where B and B' have different charges/or sizes gives solid solution AB1−x B'x O3. The substitution of B' for B, where B and B' have different charges/or sizes gives solid solution AB1−x B'x O3. For the case, x = 0.5 the ordering of B-site cations may occur and it can be modified as A2BB'O6 double perovskite structure [27]. Thus, the main difference between the single and double perovskite is that half of B site cations of perovskite are replaced by another B' cation giving rise to double perovskite. The different elemental substitutions on the A and B-sites have been carried out to optimize their technological applications. Such substation of B' on B site may change the lattice structure depending on the ionic radii of B' and B cations. There are different arrangements of B-site cations like random, rock salt, and layered. A detailed survey on the arrangements of B-site cations can be found in the report of Anderson et al [27]. Earlier, much theoretical and computational effort has been carried out to approximate the possible structures of DPs [28]. They checked many DPs and found different structures like cubic, hexagonal, monoclinic, orthorhombic, tetragonal, trigonal, etc which are compatible with different DPs. We can assess the structural stability of the DP (AA')BB'O6 using Goldschmidt tolerance factor (t), given by [29],
where r stand for ionic radii and subscripts denotes corresponding elements. Ideally, case t = 1 corresponds to a perfect cubic geometry and the deviation of t from 1 causes a structural transition from the ideal cube to some lower symmetric phase. The larger difference in ionic radii of A (rA – rA') and B (rB – rB') elements cause lower values of tolerance factor and hence larger octahedral distortion. Moreover, the ordering of the B-site cations matter much in determining the exact space symmetry of double perovskites. In the perfect ordered state, B and B' cations are distributed regularly at their sites. However, according to Valasa et al, disordering among cations take place due to two reasons [30]: (a) ASD, which arises by means of interchange of B and B'-site cations and (b) anti-phase boundary, where at the boundaries of two ordered domains, the B/B'-sites occupancies are reversed. It has been observed that smaller difference in oxidation state (ΔZB) of B and B' favours disordered stacking as in this case both cations have similar chemical activity and will try to occupy both sites interchangeably [28]. This statement can also be understood with the help of thermodynamic law according to which for similar B and B' cations, the system will try to maximize its entropy and thus become disordered. While for the large (ΔZB) values, highly charged cations favour less charged cations at their neighbouring site to reduce Coulomb energy, thus leading to an ordered state [30, 31]. Other than this, the smaller difference in ionic radii (ΔrB) of B/B' atoms favours the disordered structure of double perovskites and larger ΔrB favours ordered structure assisted by induced strain [31, 32]. It has been concluded that a system with, ΔZB = 4 and ΔrB ⩾ 0.1 Å favours an ordered state whereas ΔZB = 0 and ΔrB ⩽ 0.1 Å favours a disordered.
Trusting the above-mentioned trends, we realized that our system EPCMO (t ∼ 0.82, ΔZB ∼ 2 and ΔrB = 0.215 Å) may have an ordered arrangement [33]. However, in some DPs (like Co/Mn-based DP) with ΔZB = 2, it has been found that ordered and disordered phases coexist due to Coulombic and thermodynamic competitions. Another problem with Co–Mn DPs is the existence of mixed valency (Co2+/Co3+ and Mn3+/Mn4+) due to similar redox potentials of Co2+−Mn4+ and Co3+−Mn3+ couples as it leads to random distributions of cations [34]. Moreover, the structural ordering present in the system depends on synthesis conditions [34, 35]. Thus, the EPCMO could exhibit both ordered and disordered arrangements and it is difficult to reveal exact atomic ordering at B-site when the cations have similar mean scattering factors. For case, if a double perovskite has been fitted to an orthorhombic phase (with space group Pnma), then the B-site cations are randomly distributed on their crystallographic sites. In this case, there is a 50% possibility of finding B/B' cation at each B-site (sometimes they are also treated as single perovskite). Thus, the systems are denoted as B-site disordered double perovskite in this case. However, if B and B' atoms are distributed in a perfectly ordered manner (for example monoclinic phase with space group P21/n) then the system is known as doubly ordered perovskite or simply double perovskites. The XRD pattern of the double perovskite may be similar to perovskite materials due to the similar scattering factor of B and B' cations. The XRD pattern of EPCMO is shown in figure 1. This XRD pattern of powdered EPCMO was best refined in a disordered orthorhombic phase with space group Pnma [36]. Thus, EPCMO can be considered as a B-site disordered double perovskite. The inset of figure 1 consists of a 3D structure of EPCMO showing the distribution of atoms over its site, visualized using VESTA [37]. The crystallographic data of EPCMO have been tabularized in table 1.

Figure 1. The XRD pattern of EPCMO taken at room temperature with inset showing the 3D structure of EPCMO.
Download figure:
Standard image High-resolution imageTable 1. Structural parameters extracted from refinement of EPCMO at room temperature.
| Parameters/space group | Pnma (62) |
|---|---|
| a | 5.53891 Å |
| b | 7.63968 Å |
| c | 5.38782 Å |
| V | 227.9880 Å3 |
| Eu/Pr site | 4c |
| x | 0.05244 |
| y | 0.25000 |
| z | −0.01461 |
| Co site | 4b |
| x | 0.00000 |
| y | 0.00000 |
| z | 0.50000 |
| Mn site | 4b |
| x | 0.00000 |
| y | 0.00000 |
| z | 0.50000 |
| O(1) site | 4c |
| x | 0.46520 |
| y | 0.25000 |
| z | 0.11018 |
| O(2) site | 8d |
| x | 0.25827 |
| y | 0.03114 |
| z | 0.71634 |
| Chi2 | 3.46 |
| Rp | 5.13 |
| Rwp | 6.45 |
| Rexp | 3.47 |
| GoF-index | 1.9 |
3.2. Magnetic study
Figure 2(a) shows the temperature-dependent ZFC and FC induced magnetization (M) of EPCMO at 100 Oe field. Magnetization varies very slowly down to 160 K. However below 160 K, M(T) increases and shows two successive magnetic transitions in the vicinity of TC1 ∼ 146 K and TC2 ∼ 138 K as the dM/dT curve exhibits inflection at these transition temperatures (as shown in the inset of figure 2(a)). It is well known that the magnetic properties of DPs are strongly influenced by the ASD and the mixed-valence states of Co and Mn elements owing to the change of B–O–B' exchange interaction [13, 34]. Similar to EPCMO, many researchers have already observed two successive magnetic transitions, where the first magnetic transition was attributed to the FM ordering of Co2+–O2-–Mn4+ super-exchange interactions whereas the second FM transition emerges owing to the introduction of Co3+–O2-–Mn3+ interaction [13, 34]. Moreover, J Krishna Murthy et al reported that the 2nd magnetic transition arises owing to Co3+–O2-–Mn4+ super-exchange interactions [38]. To probe the same, we have carried out x-ray photoemission (XPS) measurements of Co2p and Mn2p core levels (figure 3). From, the XPS spectra it has been observed that there are ∼61% Co2+ states, ∼39% Co3+ states, 26% Mn3+ states and 74% Mn4+ states respectively. Therefore, as mentioned earlier, it can be understood that the magnetic transition around ∼146 K in EPCMO is attributed to the FM ordering of Co2+–O2-–Mn4+ super-exchange interactions while second transition ∼138 K arises either due to the Co3+–O2-–Mn4+ super-exchange FM interactions or related to the presence of few of Co3+ and Mn3+ in the disordered phase along with the dominant FM interactions arising from the ordering of Co2+ and Mn4+ ions [13, 34, 38, 39]. FM transition temperature of EPCMO is in good agreement as it is higher than the parent system ECMO [26] and is less than that of PCMO [39], as the size of Pr3+ ion is higher than Eu3+ ion. The transition temperature of A2CoMnO6, increases linearly for different A (rare-earth ion) from 48 K for Lu2CoMnO6 to 204 K for La2CoMnO6, as their ionic size increases from Lu to La [40]. It is important to mention here that, even in an ordered system, few of the Co/Mn exchanges their crystallographic positions, thus leading to ASD. ASD activates supplementary AFM ordering through Co2+–O2-–Co2+ and Mn4+–O2-–Mn4+ super-exchange interactions [26, 39]. The decreasing nature of M in ZFC curves below ∼133 K (Ta) has been attributed to the multifarious relationship of magnetic interaction between rare earth and transition metal sub-lattices [7, 10]. The cusp temperature Ta is a point where local magnetic anisotropy energy and the external magneto-static energy acquire balanced. The huge bifurcation between ZFC and FC curves indicates a strong spin frustration/spin-glass state due to the presence of different competing spin correlations [26, 41].
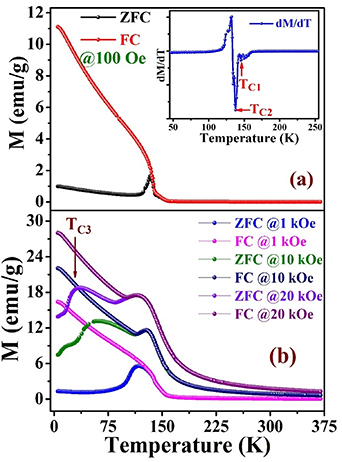
Figure 2. (a) The ZFC/FC magnetization of EPCMO at 100 Oe applied field with inset showing dM/dT curve. (b) The ZFC/FC magnetization of EPCMO at higher applied fields.
Download figure:
Standard image High-resolution image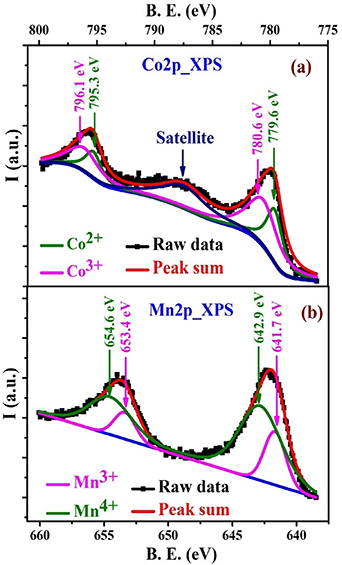
Figure 3. XPS spectra of (a) Co2p and (b) Mn2p core level.
Download figure:
Standard image High-resolution imageMoreover, in the vicinity of magnetic transition, the microscopic nature of magnetization is described by the universal scaling hypothesis, where MS (spontaneous magnetization),  (initial susceptibility), and magnetization at TC(M(H)), diverges as [10, 25],


where  , and the exponents δ, γ and β are related with each other via the Widom scaling relation, given by:

To examine the critical exponents (β, γ, δ) associated with long-range magnetic transition, we have measured closely spaced isothermal magnetization around TC (figure 4(a)). The above-described power-law fitting to MS and  for ETCMO gives the value of β = 0.60 ± 0.07 and γ = 1.19 ± 0.03 for EPCMO. Using Widom scaling relation, the value of δ is calculated to be 2.98. The value of δ is 3.0 for Mean Field Model, 4.8 for 3D Heisenberg Model, 4.82 for 3D Ising Model, and 5 for the Tricritical mean-field model [25]. Thus, the estimated value of the critical parameters for EPCMO follows the conventional mean-field scaling hypothesis [25, 42, 43]. The critical behavior study in other related DPs shows that the critical exponents are close to other conventional scaling hypotheses like 3D Ising model and 3D Heisenberg model [44, 45].
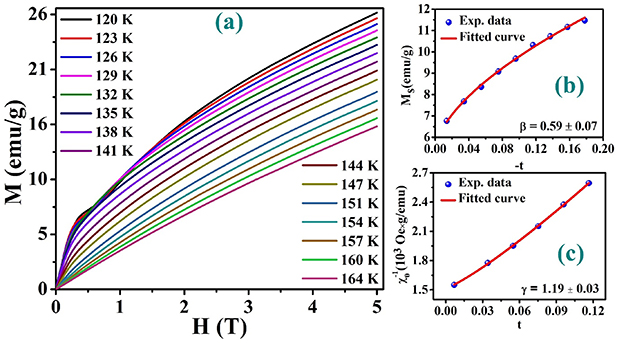
Figure 4. (a) The isothermal magnetization curves around TC, (b) the spontaneous magnetization vs reduced temperature (t) of ETCMO and (c) the inverse initial susceptibility vs. reduced temperature.
Download figure:
Standard image High-resolution imageFurther, the evolution of the ZFC/FC magnetization at the different higher applied magnetic fields has been shown in figure 2(b). The magnetic transition temperature TC1 of EPCMO moves toward a higher temperature at a high magnetic field similar to parent ECMO [26]. This characteristic is attributed to increased spin-ordering of FM materials at a higher temperature under the influence of a high external magnetic field [26, 46]. The magnitude of bifurcation between the ZFC/FC curves initially increases on increasing applied field strength up to 10 kOe and then decreases at higher fields. The bifurcation between ZFC and FC M(T) curves is usual in most of the FM materials, which originates due to magnetic anisotropy. Thus, the bifurcation should appear at a lower temperature in a higher magnetic field, which has been observed in EPCMO (figure 2(b)) and ECMO [26] as well, due to the suppression of the magnetic anisotropy in the high field [46]. Additionally, the observed cusp in the ZFC-magnetization curve around Ta has suppressed on the increasing field, which is a typical signature of the existence of some AFM phases or anti-phase regions in the system [26, 41]. Other than this, a third magnetic transition has been observed in EPCMO at a high field below 40 K (TC3). This magnetic anomaly has been better described with the help of the AC susceptibility spectrum, which is discussed later on.
From the figure 5, it has been observed that the inverse DC susceptibility (χ−1) curve of EPCMO shows linear behavior above 168 K; confirming a pure paramagnetic state. This data could be fitted with the Curie–Weiss (CW) law given by equation  . This fitting (for T > 200 K) gives CW temperature (TCW) around +118.6 K, again supporting a leading ferromagnetic phase [26]. The large difference between TC1 and TCW, which cannot be assigned to quantum fluctuations rather occurs owing to frustration through FM and AFM competition within the system. Further, it has been observed that the χ−1(T) shows a downturn deviation from the CW line just below ∼168 K (TGP) similar to PCMO [13]. Generally, rare-earth elements develop multiple magnetic interactions in the system, thus causing inhomogeneous magnetic ground states, in the form of clustered or phase-separated states [8, 10]. One form of these clustered phases is well known as the 'Griffiths like' phase. The GP was originally proposed for randomly diluted Ising ferromagnets, where a few fractions of the crystallographic sites can be occupied with spins and rest sites are either vacant or occupied by some nonmagnetic elements [47]. The GP arises below a characteristic temperature, known as Griffith's temperature (TGP) and in the region TC1 < T < TGP where the system exhibits an unusual magnetic state due to the formation of short-range FM clusters of different sizes in the paramagnetic region [10, 13, 26]. Thus, the downturn behaviour of χ−1(T) of EPCMO might be due to the emergence of the GP or some other FM clustered phase. The observed downturn significantly was suppressed at the higher applied field, suggesting the observed clustered phase is GP. In the GP phase region, χ−1(T) follows the power-law given by [10, 41],

Figure 5. The inverse DC susceptibility vs. temperature at different applied fields of EPCMO with inset showing power law fitting (equation (1)).
Download figure:
Standard image High-resolution imagewhere A is the constant  is the reduced random critical temperature of randomly distributed FM cluster and λ is the DC magnetic susceptibility exponent which should lie within 0 and 1 for
  < T < TGP [41]. The value of
  should be chosen in such a way so that equation (1) yields value of λ close to zero in the PM region for T > TGP [48]. Thus, the value of
  will be almost equal to CW-temperature which was determined using CW equation fitting in high temperature PM region. From the slope of the line fitted in the GP region (as shown in the inset of figure 5), the value of λ for EPCMO was found to be around 0.88.
The isothermal magnetization of EPCMO has been collected at 5 K and 300 K, which is presented in figure 6. From the figure, we can see that the EPCMO has strong FM type hysteresis at 5 K, which did not reach complete saturation even up to 70 kOe applied magnetic field. At 300 K, M(H) curve is completely linear over the whole cycle with almost negligible hysteresis, thus the system is a pure paramagnet at room temperature. Interestingly, we also observe clear steps in the isothermal magnetization curve (i.e. MMT) at 5 K in the third quadrant (around −5 kOe and −10 kOe) and a mirror image was observed in the fourth quadrant (around 5 kOe and 10 kOe), which has been demonstrated in the inset of figure 6. Jumps in magnetization occur only while forward field sweep direction i.e. for 0 to −70 kOe and are absent in decreasing field from −70 to 0 kOe owing to slow spin relaxation and again re-appear in subsequent forward field direction i.e. for 0–70 kOe; followed by large hysteresis. However, unlike ECMO [26], EPCMO has a larger step size (ΔM) at the high field side (∼10 kOe) than the step size at the low field side (∼5 kOe). Thus, observed MMT in EPCMO are purely field-induced due to transition to a FM state from uncompensated AFM states [49]. In Ca3CoMnO6, it has been investigated that the spin flop transition from E*-type magnetic structure (↑↑↓↓) to the ↑↑↑↓ Mn4+ (high spin S = 3/2) at the first jump and to ↑↑↑↑ with Co2+ (low spin S = 1/2) spin flop at second jump is the possible reason behind sharp step [50]. However, for EPCMO, step size (ΔM) is much smaller, thus, the possibility of field-induced spin flop behind the origin of MMT can be ruled out. Additionally, a close view of the M(H) curve shows that the loop is asymmetric around the origin, indicative of the presence of spontaneous EB [39, 51], as M(H) loop was recorded in ZFC mode, in EPCMO at low temperature. The magnitude of EB field is given as, HEB = (HC1 + HC2)/2 [51], where HC1 and HC2 are the magnitudes of magnetic fields at which magnetization becomes zero, which is found to be around 1.17 kOe for EPCMO. The EB mainly appears due to interacting interfaces between FM–AFM magnetic states [39, 51].

Figure 6. The isothermal magnetization curves of EPCMO at 5 K and 300 K.
Download figure:
Standard image High-resolution imageThe bifurcation in ZFC and FC curves is attributed to the existence of superparamagnetic (SPM) state or spin-glass (SG) or cluster-spin-glass (CSG). This is generally observed only in those systems of spin clusters where the FC-magnetization curve displays a cusp around Ta [52]. The branching in ZFC-FC M(T) starts ∼133 K at a low field (100 Oe) showing the existence of high-temperature spin ordering in EPCMO. To explore such dynamics of spin, we have carried out AC susceptibility measurements elaborately. Both, the real part (χ') and the imaginary part (χ'') of AC susceptibility for EPCMO shows clear frequency-independent peaks near the first magnetic transition TC1, which is attributed to the commencement of long-rang magnetic ordering (inset of figures 7(a) and (b)). However, near TC2, AC susceptibility shows strong peaks and these peaks show minor shifts towards higher temperature at higher frequencies. Such behaviour in the magnetic systems having miscellaneous interactions is categorized by arbitrary and cooperative freezing of spins around a defined temperature i.e. the glass temperature (Tg). Beneath Tg, the system enters a region where spin gets frozen with an irregular long-range magnetic ordered state, which is eventually a SG state [53]. As already mentioned, the most important component of spin glass is the presence of different competing exchange interactions and ASD. The calculated value of the parameter p ∼ 0.002, where p is defined in terms of peak temperature Tf at frequency f as [39],
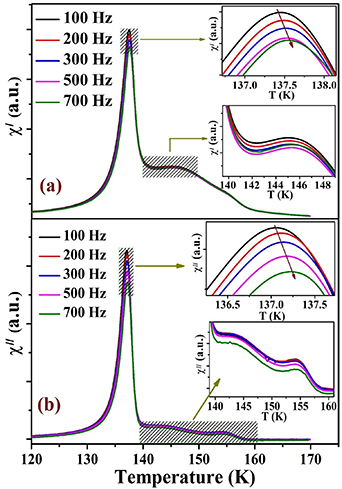
Figure 7. The thermal variation of (a) real part of ac susceptibility and (b) imaginary part of ac susceptibility at different frequency without DC bias around long range magnetic transition region.
Download figure:
Standard image High-resolution imagewhere p has values between 0.005 and 0.08 for SG or CSG, while for SPM, it should be greater than 0.2 [39]. A rather small value of p for our system might be due to weak freezing of spins and the observed peaks are associated with long rang magnetic transition around TC2, as peak shifting is much smaller. It can be mentioned here that the higher temperature spin ordering is disturbed by thermal fluctuations, i.e. the spins are effectively independent of each other [53]. However, at lower temperature, the spins start communications and form locally frozen units/clusters/droplets/domains. In EPCMO, another broad peak in χ''(T) curves at lower temperatures below 40 K has been observed (figure 8(a)). It is the temperature (TC3) where higher field ZFC-M curves show third anomalous magnetic transition. These peaks show a significant shift towards higher temperatures at a higher frequency. For these peaks, the value of the p was found to be around 0.02. Thus, suggesting a re-entrant glassy state in the system [6, 54]. Moreover, under the application of the DC magnetic field (∼1000 Oe) these peaks grow up (figure 8(b)). Interestingly, the anomaly in DC-magnetization also was observed at higher fields (figure 2(b)). Moreover, as already been described ferromagnetic characteristics exist at lower temperatures. So the emergence of a glassy state must be correlated to the FM state. Thus, it can be said that there are clusters of spins in a glassy state, forming due to short-range FM ordering within the cluster. FM cluster-glass phase has also been seen in other systems [55, 56].

Figure 8. (a) The thermal variation of real and imaginary part of ac susceptibility at different frequency without DC bias. (b) The thermal variation of real and imaginary part of ac susceptibility at 500 Hz frequency with different DC bias around 40 K.
Download figure:
Standard image High-resolution image4. Transport properties
Figure 9 shows the variation of the field independent DC resistivity ( ) with temperature in the temperature range 60 K–300 K. This resistivity curve shows the semiconducting/insulating behaviour of the sample. The large value of resistivity might be attributed to the structural distortion which narrowed 3d-bands and put off the electron hopping [57]. Below 160 K, the resistivity is best described by the variable range hopping (VRH) model, given by equations [58–60].

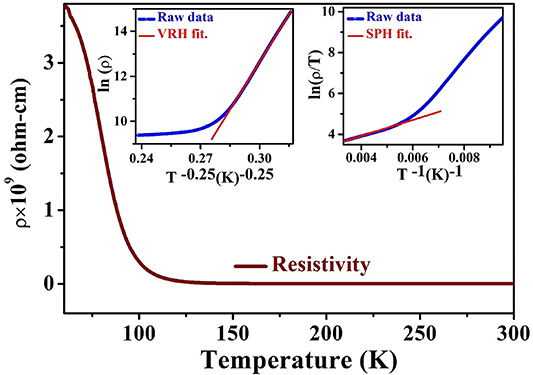
Figure 9. The temperature-dependent resistivity of EPCMO with insets showing VRH and SPH fitting.
Download figure:
Standard image High-resolution image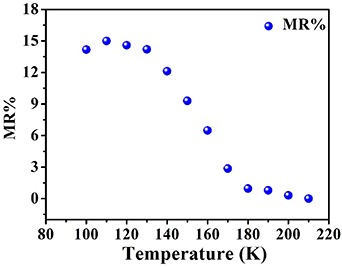
Figure 10. The thermal variations of magnetoresistance at 1.1 kOe magnetic field.
Download figure:
Standard image High-resolution imagewhere ρ0 is a prefactor and T0 is an important parameter; known as Mott's characteristics temperature which is linked with the density of localized states (N(EF)) near Fermi level as,
The localization length 1/α is the average spacing between adjacent Co or Mn ions which is around twice of the Co–Mn bond length [61]. The polaron activation energy (W) at temperature T is  with most probable hopping distance,
The value of N(EF) for EPCMO was found to be ∼1024 eV−1 m−3, which is the order of typical semiconductor materials [59]. The estimated activation energy is larger than thermal energy (kB
T) within the investigated temperature range with αR > 1 [58]. In this temperature region, the charge carriers are trapped and distributed in a localized narrow band with multiple activation energies and only those electrons will participate in conduction that lies close to the Fermi level [58]. However, in higher temperature region, the trapped carriers hop out so the conduction is governed by some thermally activated mechanism. In the temperature range 160 K–300 K range our resistivity data is best fitted by small polaron hopping (SPH), given by equation  , which is a short-range thermally activated energy process credited to the increased drift mobility and hopping frequency of the charge carriers at higher temperature [54, 62]. The obtained polaron activation energy Ea from SPH fitting is 0.0336 eV. Furthermore, we have observed an increase in resistivity under application of magnetic field below 170 K. Thus, the existence of positive magneto-resistance (MR) has been inferred in EPCMO. The variation of MR with temperature is shown in figure 10, under the application of 1.1 kOe magnetic field. On lowering the temperature, the MR increases. It is interesting to observe the magnetic ordering emerges in the same temperature region. Thus, it can be understood that the detected MR is associated with the coexistence of FM and AFM in the EPCMO.
5. Dielectric study
The relative dielectric permittivity ( ) and tanδ vs temperature curves of EPCMO at different frequencies have been demonstrated in figure 11 with the inset showing dissipation factor (tanδ). The –T curve shows almost non-dispersive intrinsic polarization and a low value of at a low temperature below 150 K due to the freezing of dipoles. Beyond 150 K, shows step-like increasing behaviour and the steps shift towards higher temperature at higher frequency showing a thermally activated polarization. The electrically mixed microstructure i.e. conducting regions owing to ASD and insulating regions as a result of perfect Co/Mn ordering as well as heterogeneity and defects near grain boundary due to Eu/Pr sub-lattices, might be playing a role behind the high value of [63]. The heterogeneity increases the probability of inter-well hopping which affects dielectric relaxation mostly at lower frequency and owing to the heterogeneous distribution charge carriers pileup which response in a different way to the external electric field [64]. These dielectric relaxations are mainly described by non-Debye/Maxwell–Wagner (MW) interfacial polarization where the system does not have a permanent dipole moment [65]. The MW effect takes account of the interfaced depletion layers between sample and contact and at grain boundaries as well [66–68]. In this picture, grain (G) and grain boundary (GB) both has their characteristic resistance (Rg and Rgb) and capacitance (Cg and Cgb) in the heterogeneous polycrystalline sample [65]. To explain our dielectric relaxation, we have performed the simultaneous impedance measurements for better investigation of grain and grain boundary contributions discussed below.

Figure 11. The thermal variations of relative dielectric permittivity of EPCMO with inset showing the thermal variations of dielectric at different frequency.
Download figure:
Standard image High-resolution image6. Impedance study
The plot of frequency dependence of the imaginary part (Z'') of the impedance at a few temperatures has been presented in figure 12. We observed two prominent relaxation peaks (shown with an arrow). These peak shifts towards higher frequencies with decreased intensity as the temperature increases, again implying both electrical responses are thermally activated. Usually complex impedance plots (Z'' vs Z') i.e. cole-cole plot results in two semi-circular arcs are attributed to each relaxation peak in Z'' [69]. The electrical responses of these peaks are attributed to grain boundary (lower frequency side peak) and grain (higher frequency side peak) conduction [56]. The intensities of the relaxation peaks are proportional to the resistances of grain boundaries and grains respectively. The impedance curves usually are treated as an ideal equivalent circuit composed of a resistor R and a capacitor C [69]. Therefore, a polycrystalline sample can be expressed as an equivalent circuit, consisting of a series of two sub-circuits that take account of grain/grain boundaries effects [65, 69, 70]. Thus, the overall impedance circuit within the system is the result of a series combination of two parallel-connected resistance and capacitance arising from the grain and grain boundary contributions. Accordingly, the Z''-dispersion relation can be written as [65, 69, 70],
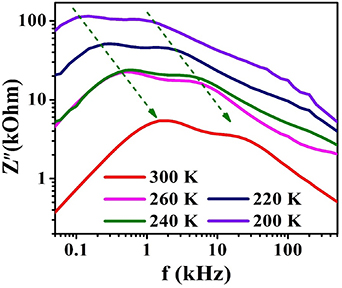
Figure 12. The variation of Z'' with frequency at different temperatures.
Download figure:
Standard image High-resolution imageand the corresponding grains and grain boundaries response peaks are positioned at frequencies  and
and  respectively and peak intensity is equal to
  and
and  [65, 69]. Using these conditions
  has been estimated for our system, shown in figures 13(a)–(d).
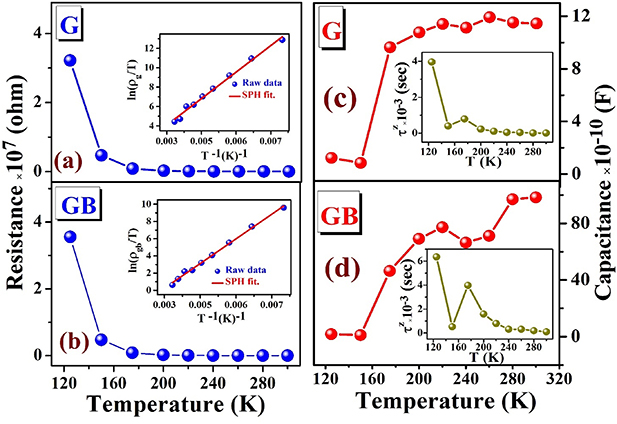
Figure 13. The variation (a)  with temperature. The insets of (a) and (b) shows the VRH fitting and the insets of (c) and (d) shows the response time vs T plot.
Download figure:
Standard image High-resolution image
Generally, the conduction mechanism in semiconductor is governed by thermally activated electrons and resistivity varies as  [65]. However, in EPCMO the grain and grain boundary resistivity is best fitted by short-range thermally activated small polaron hopping mechanism (shown in the inset of figures 13(a) and (b)), where both grain and grain boundary resistivity follows
  , similar to DC resistivity as discussed earlier in this report. Further estimated response time,
  [69] corresponding to grain and grain boundary are shown in the inset of figures 13(c) and (d). The real part of permittivity can be better explain here seeing that the Rg < Rgb and Cg ≪ Cgb. For the case relatively poorly conducting thinner grain boundaries are separated by lower resistive grains and application of external electric field accumulates localized charge at the interface, thus leads to interfacial MW polarization [71, 72]. The response time
  increases slowing on decreasing temperature; however, it shows a sudden increase below ∼150 K. This is consistent, as we have observed a step-like decrease in the real part of permittivity down to ∼150 K. Moreover, at higher frequencies, the value of decreases due to existence of difficulties to follow the applied ac electric signal beyond a certain frequency by hopping frequency of the charges. This process leads to decrease in interfacial polarization [65].
7. Conclusion
The EuPrCoMnO6, crystallizes in a pure single orthorhombic phase with space group Pnma showing random distribution of Co/Mn ions at its sites. It exhibits two successive ferromagnetic transitions around 146 K and 138 K due to mix valence states of Co/Mn ions. Further, it shows a magnetic anomaly around 40 K which was associated with a re-entrant glassy dynamic. A weak glassy dynamic in near magnetic transition in the EuPrCoMnO6 also was observed in the AC susceptibility spectrum. The inverse DC susceptibility shows a downturn in the paramagnetic region which was eventually associated with Griffiths-like phase. More interestingly, the isothermal magnetization exhibits a metamagnetic transition and spontaneous exchange bias at low temperature. The variation of resistivity with temperature shows semiconducting nature of EuPrCoMnO6. It was also seen that the resistivity increases under application of DC magnetic field, thus EuPrCoMnO6 shows the appearance of positive magnetoresistance. The dielectric spectrum exhibits frequency-dependent thermally activated steps associated with MW interfacial polarization. Moreover, the contribution of grain and grain boundary in electrical property is observed using the complex impedance study. Overall, owing to large magnetoresistance and high dielectric constant, EuPrCoMnO6 can be a good candidate for spintronic devices and high dielectric applications.
Acknowledgments
Authors are grateful to UGC-DAE CSR, India and CIFC, IIT (BHU) for providing facility for magnetic measurement.
Data availability statement
All data that support the findings of this study are included within the article (and any supplementary files).