
Abstract
The Q factors of fused silica cylindrical shell resonators reaching 25 million is reported. The finite element method is employed to analyze the anchor loss and chemical etching is used to reduce the surface loss of cylindrical resonators. Two resonators with the same processing parameters are etched for 13 rounds with each round set as 5 min. After each round of chemical etching, the surface roughness, Q factors and resonant frequencies of the two resonators are measured. The Q factors of the two cylindrical resonators have both exceeded 25 million, reaching the level of that of fused silica hemispherical resonators. Results also indicate that the Q factors of fused silica cylindrical resonators are not related with their surface roughness. This study shows the potential of the cylindrical resonator gyroscope to achieve the same degree of precision as the hemispherical resonator gyroscope, which has presented outstanding performances.
Export citation and abstract BibTeX RIS

Original content from this work may be used under the terms of the Creative Commons Attribution 4.0 license. Any further distribution of this work must maintain attribution to the author(s) and the title of the work, journal citation and DOI.
1. Introduction
The vibratory gyroscope is a type of angular sensor which measures angular velocity or angle of a moving body through Coriolis effect. The hemispherical resonator gyroscope (HRG), a typical vibratory gyroscope, has shown a bias stability of 0.00001 deg h−1 [1], and has been paid increasing attention in the inertial navigation field [2]. Compared with laser gyroscope and fiber optic gyroscope, the HRG has outstanding size, weight and power consumption characteristics in addition to high precision, and is considered as the most promising substitute for ring laser gyroscopes and fiber optic gyroscopes. The cylindrical resonator gyroscope (CRG) is also a type of vibratory gyroscope with a cylindrical shell resonator, and has been widely used in low and medium precision inertial navigation systems. For both the HRG and the CRG, the resonator is the core component, the quality factor (Q factor) of which sets the limit of the gyroscope performance [3–8]. The manufacturing of a cylindrical resonator is substantially simpler compared with a hemispherical resonator. The Q factor of a high-performance HRG is in the level of 107 [9]. However, in previous reports, cylindrical resonators are mostly made of metallic materials and piezoelectric materials [10–17], and the Q factor of the metallic cylindrical resonators are generally less than 105 due to the materials characteristics. Inspired by hemispherical resonators, fused silica has been used for manufacturing high-Q cylindrical resonators because of its low internal friction and high isotropy [18–21]. By improving the cylindrical resonator structure and post-processing technology, the cylindrical resonators have been fabricated by the authors' group with Q factors approaching 8 × 10⁵ in 2016 and 2.89 × 10⁶ in 2019 [20, 21], which are the highest values reported for cylindrical resonators at that time.
In resonant systems, the mechanical Q factor is affected by several dissipation mechanisms, including anchor loss, air damping, surface loss and thermoelastic dissipation, etc. Anchor loss is the result of energy dissipating from the anchor stem to the substrate when the resonator is vibrating, which is a major energy dissipation mechanism in vibratory gyroscopes [22]. For resonators with complicated geometries, the anchor loss is usually analyzed by the finite element method (FEM). The FEM has been applied in the analysis of the anchor loss in a wide range of resonator geometries. Relevant studies have indicated that optimizing the structure of the resonator can significantly reduce the anchor loss and increase the Q factor [23–25]. However, there has been no investigation on the anchor loss of cylindrical resonators up to now.
In this paper, the Q factors of the cylindrical resonators reaching 2.53 × 10⁷ and 2.59 × 10⁷ are reported. The anchor loss of the cylindrical resonator is analyzed and chemical etching is used to reduce the surface loss of resonators. To the authors' knowledge, this is the first time that the Q factor of cylindrical resonators have exceeded 20 million. The high Q factor cylindrical resonator makes it possible to develop CRG at the same level of high precision HRGs in lower manufacturing cost, easier assembly methods and wider precision applications.
2. Simulation model
The structure of cylindrical resonator is composed of an axisymmetric shape with a resonant shell, a stem, a suspension and a bottom plate, as shown in figure 1(a). The n = 2 mode of the cylindrical resonator is chosen as its operating mode in this study. The n = 2 mode is usually chosen as the working mode, mainly because the Q factor of this mode is high, and the control of this mode is intuitive and simple. However, theoretically other flexural mode can also be used as the working mode [26]. The structure and the n = 2 mode of the cylindrical resonator can be found in [18].

Figure 1. (a) The schematic of the cylindrical resonator structure. (b) The finite element model and the anchor loss simulation result of the cylindrical resonator. (c) Effect of varying substrate radius on the Qanchor. (d) Effect of varying mesh element on the Qanchor.
Download figure:
Standard image High-resolution imageThe COMSOL software is utilized to calculate the resonant frequency and analyze the anchor loss of the cylindrical resonators. A perfectly matched layer (PML) is added to the outer boundaries of the simulation model [23]. The anchor loss is the only energy loss mechanism considered in the simulation model, and the anchor loss is represented by Qanchor in this paper. In this model, the outer spherical boundaries of the PML are fixed, and the stem is rigidly connected with the substrate. The mechanical wave radiation from the stem to the substrate is absorbed by PML and attenuated exponentially.
The material of the cylindrical resonator, the substrate and the PML are all defined as fused silica. The material properties are set as Young's modulus: E = 70 GPa, density: ρ = 2200 kg m−3 and Poisson's ratio: υ = 0.18. Figure 1(b) shows the simulation model including the cylindrical resonator, the substrate and the PML. The quality of mesh is exceedingly important, because it affects the convergence of the iterative solution and the accuracy of the results. Besides, the convergence of the iterative solution will have an obvious effect on the Qanchor, resulting in the non-uniformity of the Qanchor of the n = 2 mode. Consequently, in order to ensure the mesh uniformity and its distribution density, the free quadrilateral mesh is first constructed in the two-dimensional plane, and then the three-dimensional structure mesh distribution is constructed by sweeping, as shown in figure 1(b).
The thickness of the PML (RPML) and the radius of the substrate (Rs) have a significant impact on the accuracy of the simulation results. The energy should be completely attenuated before being transferred to the PML outer boundary. Consequently, the thickness of PML is set as one wavelength of the mechanical wave. More details of the PML method can be found in [25].
When the thickness of PML is fixed, the accuracy of simulation results increases with the increase of the substrate radius. According to the simulation results, the Qanchor converges with the increase of the substrate radius, as depicted in figure 1(c). When Rs >120 mm, the simulated Qanchor changes less than 1%. Therefore, the substrate radius is set as Rs = 120 mm to ensure the accuracy of simulation results while keeping the computation within an acceptable range.
Dividing an appropriate number of mesh elements in the thickness direction of the PML leads to accurate simulation results in less calculation time. The effect of the number of mesh nodes on the simulated Qanchor is depicted in figure 1(d). When the number of the mesh elements in the thickness direction of the PML exceeds 22, the Qanchor changes less than 1%. In order to ensure the accuracy of the simulation results, 30 mesh elements in the thickness direction of the PML are applied.
Different thickness of the resonant shell, bottom plate and stem are simulated, and the results are depicted in figure 2. The simulation results show quite interesting pattern of the Qanchor with the change of structural size, rather different with that of micro hemispherical resonators reported in [25]. Particularly, the anchor loss Qanchor reaches the maximum value when the thickness of the resonant shell is 1.3 mm, the bottom plate is 0.8 mm and the radius of the stem is 4.8 mm, respectively.
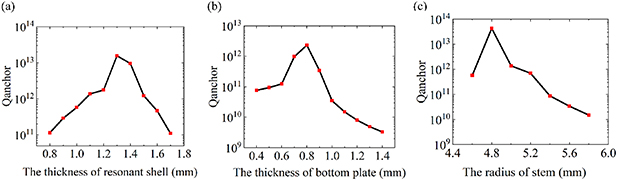
Figure 2. Effect of changing resonator structure parameters on the Qanchor: (a) Qanchor reaches the maximum value of 1.56 × 10¹³ when the thickness of resonant shell is 1.3 mm. (b) Qanchor reaches the maximum value of 2.34 × 10¹² when the thickness of bottom plate is 0.8 mm. (c) Qanchor reaches the maximum value of 4.33 × 10¹³ when the diameter of stem is 4.8 mm.
Download figure:
Standard image High-resolution imageThe size of the cylindrical resonator also needs to consider the thermoelastic dissipation and the modal frequency. According to the authors' previous work, the thermoelastic dissipation increases with the increase of bottom plate thickness and the decrease of resonant shell [18]. In addition, it is necessary to choose a resonant frequency well above the mechanical environment frequencies of the support: in practice, the resonant frequency is more often in the 10 kHz range [27]. Furthermore, the drift error of the gyroscope becomes smaller as the frequency is lower [27]. However, the increase of resonant shell thickness, bottom plate thickness and stem radius will lead to the increase of the modal frequency. Therefore, the thickness of the resonant shell, the bottom plate and the radius of stem are designed to be 1.2, 0.8 and 4.8 mm. Simulation shows the resonant frequency of the resonator in the n = 2 mode is 8329 Hz.
3. Experimental results and discussion
Two cylindrical resonators are fabricated by mechanical grinding with the same fabrication parameters. Hereafter these two resonators are represented by GR01 and GR02. The post-fabrication process including annealing and chemical etching. Different with our previous study, the etching time of GR01 and GR02 is substantially extended, and the etching depth is greatly increased to 0.15 mm and 0.12 mm, respectively. The two resonators are etched for 13 rounds, the etching time of each round is set as 5 min. After each round of chemical etching, the surface roughness, Q factor and vibration frequency are measured. The measurement system and process are described in our previous reports [28, 29]. After the loss decreasing process, the decay time method is employed to calculate the Q factor:

where f represents the resonant frequency and τ represents the decay time when the amplitude attenuates to 1/e of the initial value.
For the surface roughness measurement, eight different positions on the outer surface of the resonator are measured and the average values are recorded. The influence of chemical etching on the surface roughness of GR01 and GR02 is depicted in figure 3. When the chemical etching time is longer than 20 min, The surface roughness variation range of GR01 and GR02 is less than 2%. The mean value of the surface roughness after 20 min for the two resonators is about 0.8 μm, and the relative standard deviations vary from 1.7% to 8.9%. The variation of the relative standard deviation of surface roughness might be the results of the uneven distribution of subsurface damage of cylindrical resonators.
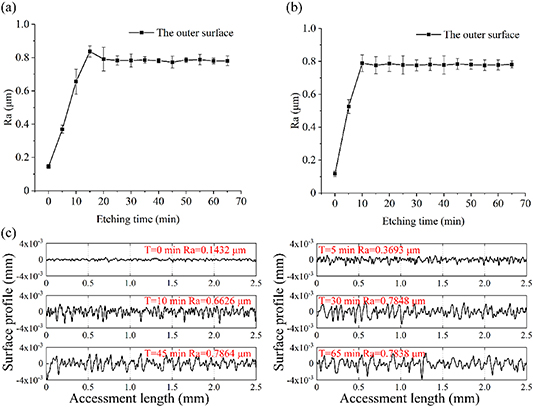
Figure 3. (a) The surface roughness of GR01 varies with etching time. (b) The surface roughness of GR02 varies with etching time. (c) Surface roughness change of GR01 with the increase of the etching time.
Download figure:
Standard image High-resolution imageThe resonant frequency and decay time of resonators in the vacuum chamber are measured by a laser Doppler vibrometer, as show in the schematic of figure 4. The vibration characteristics of resonators is measured inside the vacuum chamber (0.02 Pa).

Figure 4. Simplified schematic of the vibration characteristic measuring system.
Download figure:
Standard image High-resolution imageAs shown in figures 5(c) and (d), the decrease rate of vibration frequency is not a constant. We have carefully controlled the temperature and the concentration of the chemical etching solution; therefore, we believe this nonlinear is mainly caused by the uneven distribution of subsurface damage such as micro-cracks and scratches in the thickness direction of the resonator.
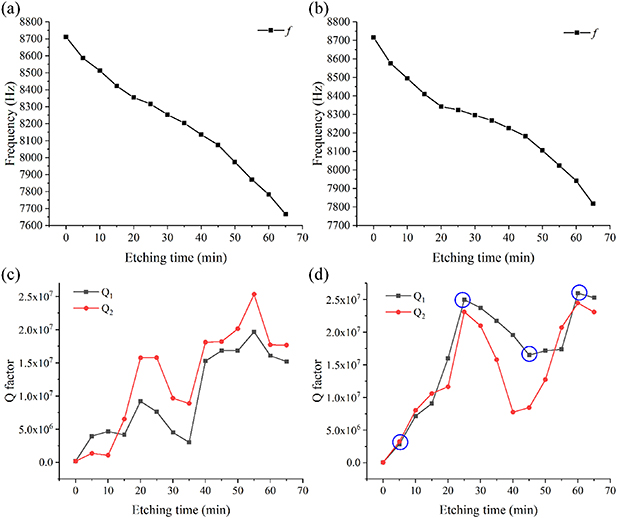
Figure 5. (a) The variation of vibration frequency of GR01 with etching time. (b) The variation of vibration frequency of GR02 with etching time. (c) The variation of Q factor of GR01 with etching time. (d) The variation of Q factor of GR02 with etching time.
Download figure:
Standard image High-resolution imageThe Q factors of the low-frequency axis and high-frequency axis are measured and represented by Q1 and Q2, respectively. As shown in figures 5(a) and (b), with the increasing of etching time, the Q factors of two resonators first increase, then decrease, and then increased again in the subsequent etching. During the whole process, the Q factors of GR01 and GR02 appear two maximal value and one minimal value. The decay time results of the low-frequency axis corresponding to the blue markers in figure 5(d) are shown in figure 6. The Q factors of GR01 and GR02 reached the maximum value of 2.53 × 10⁷ and 2.59 × 10⁷, respectively, after chemically etched for 55 and 60 min. Compared figures 5(a) and (b) to figures 3(a) and (b), our experimental results indicated that the variation of Q factor has no apparent relationship with the surface roughness.
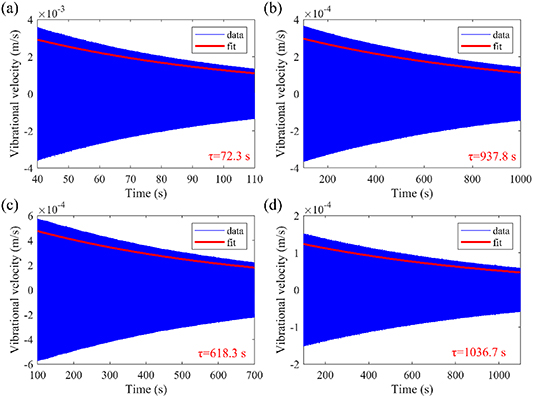
Figure 6. (a) The decay time of GR02 after 5 min of chemical etching. (b) The decay time of GR02 after 25 min of chemical etching. (c) The decay time of GR02 after 45 min of chemical etching. (d) The decay time of GR02 after 60 min of chemical etching.
Download figure:
Standard image High-resolution imageThe measurement results illustrate that the Q factor of GR01 and GR02 do not improve continuously with the increase of chemical etching time. We are yet to understand the mechanism behind these results. One of the possible explanations could be that it is the evolution of microcracks of fused silica after grinding that dominates the variation of Q factors through surface loss. The mechanism behind this phenomenon is yet to be explained.
The differences between the simulation and the experimental results may be caused by several reasons. First, the air damping has a significant influence on the Q factor [21]. Our previous experimental results illustrated that, when the atmospheric pressure was less than 1 Pa, the Q factor increased much faster as pressure decreased. Further decrease of the atmospheric pressure could lead to more significant improvement of the Q factor. However, the influence of vacuum level is neglected in the simulation model. Second, the simulation model assumes a rigid-connection state, which is different from the clamping-state in experiments. Our previous research indicates that the Q factor increases with the increase of the clamping force [30]; however, clamping force is hard to model in simulation. Finally, the machining errors are not considered in the previous simulation of anchor loss, which might cause a large increase of the anchor loss [31].
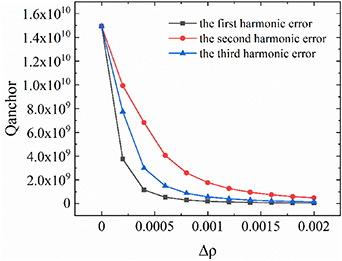
Based on our previous finite element simulation model [32], the influences of the first three harmonic errors on the Q factor of the cylindrical resonator are simulated, and the results are depicted in figure 7. The degree of imperfection Δρ is ρi/ρ, where ρi is the ith harmonic error of the imperfect density. The simulation results indicate that the first three harmonic errors significantly increase the anchor loss. A 0.002 relative error of first three harmonic errors might cause one order of magnitude decrease of Q factors. In conclusion, we believe the discrepancies of the simulation and experimental results are caused by neglection of air damping, connection state and machining errors in the simulation model.
Figure 7. Effect of the first three harmonic errors on the anchor loss.
Download figure:
Standard image High-resolution image
4. Conclusion
In this paper, the Q factors of fused silica cylindrical resonators achieving 25 million is reported. To our knowledge, this is the first time that the Q factor of cylindrical resonators have reach the same level of that of the fused silica hemispherical resonators. The anchor loss is analyzed and the appropriate size of the resonator is selected considering anchor loss, thermal elastic damping and modal frequency. The relationship between chemical etching time, surface roughness and vibration characteristics of the cylindrical resonator is investigated by performing long time and multiple rounds of chemical etching treatment on the resonator. The measurement results of two cylindrical resonators after chemical etching illustrates that the Q factor of cylindrical resonators after etching time have been significantly improved, and the surface roughness is not evidently related to the Q factor. It is suggested that the irregular variation of Q factors of the two resonators during chemical etching may be caused by unpredictable evolution of micro cracks. The Q factor reported in this paper is an order of magnitude higher than that in the previous reports [18, 20, 21]. The remarkable increase of the Q factor of the cylindrical resonator provides a brand-new idea for developing low-cost and high-precision Coriolis vibratory gyroscopes (CVGs). Compared with hemispherical resonators, the manufacturing of fused silica cylindrical resonators is simpler and requires a lower cost. Our study opens a path of the application of CRGs towards high-precision inertial navigation systems.
Acknowledgments
This work is supported by the special funds for the development of innovative provinces of Hunan Province (Grant No. 2019XK2005) and the independent research project of National University of Defense Technology. The authors would like to thank the Laboratory staff.
Data availability statement
The data that support the findings of this study are available upon reasonable request from the authors.