
Abstract
Clinical transplantation medicine currently faces a significant shortage of organ donors to supply the need of an increasingly aged population. Despite this, organs are still discarded due to graft stress induced by hypoxia or ischemia prior to procurement. Approaches to minimize donor organ discard include appropriate organ preservation and monitoring of organ function. Predominant organ preservation strategies involve hypothermia between 0 °C and 12 °C. In this study, we investigate the effect of temperature alone on tissue microstructural and biochemical parameters during cold preservation of mouse organs. To the best of our knowledge, this is the first study evaluating this cooling effect on multiple tissue parameters such as blood oxygenation, concentrations of blood, methemoglobin, water, lipid, and bile as well as scattering amplitude, Mie scattering power and fraction of Rayleigh scattering. These parameters were extracted by using diffuse reflectance spectroscopy spectral fitting at an extended wavelength range between 450 and 1590 nm and a Monte Carlo look-up table including a wide range of tissue optical properties compared to previous studies. Our findings can be used to understand biological processes undertaking cooling to propose new strategies involving optimized cold storage times and composition of organ preservation solutions for minimized cellular and tissue damage.
Export citation and abstract BibTeX RIS

Original content from this work may be used under the terms of the Creative Commons Attribution 4.0 license. Any further distribution of this work must maintain attribution to the author(s) and the title of the work, journal citation and DOI.
1. Introduction
Currently, clinical transplantation medicine faces a significant shortfall in organ donors [1]. This problem is exacerbated due to an aging population, as the risk of organ failure grows with age. According to the Organ Procurement and Transplantation Network (OPTN) and Scientific Registry of Transplant Recipients (SRTR) [2], 40% of US patients on the waiting list for a kidney transplant in 2015 were still waiting in 2018, while 20% were deceased or removed from the list. Due to donor organ shortage and the impact of preservation methods on graft performance, organ preservation technology plays a key role in reducing the number of discarded organs. According to the SRTR/OPTN [3], 4937 organs were discarded in 2016, 'including 3631 kidneys, 317 pancreas, 739 livers, 8 intestines, 31 hearts, and 211 lungs'. One of the main reasons organs are discarded is graft stress induced by hypoxia or ischemia prior to procurement [4]. Graft stress can be reduced by improving organ storage conditions based on (a) cooling organs to reduce the cellular metabolism and their need for oxygen, (b) perfusion of organ preservation solutions (OPSs) in order to prevent damage from hypothermic and hypoxic exposure, and (c) sustaining ex vivo circulation of OPS [4, 5]. Organ storage strategies are mainly divided into static cold storage (SCS) and perfusion techniques. SCS provides for inexpensive and ready transport of the cold-flushed, sterile-packed organ kept in ice storage (embodying conditions (a) and (b) above). Perfusion techniques further include sustaining ex vivo circulation of OPS (condition (c) above) in normothermic (35 °C–38 °C), subnormothermic (25 °C–34 °C), midthermic (13 °C–24 °C), and hypothermic (0 °C–12 °C) machine perfusion. Research has shown that these strategies can be combined with others, such as supercooling for 72 h at −6 °C [6] or implemented with OPS containing diverse compositions of electrolytes, buffers, impermeants, pharmacological agents [4]. SCS is the strategy predominantly used for clinical organ preservation [5] and many techniques have been tested due to the growing interest in organ perfusion [4]. However, there is no consensus on optimal strategy, as the outcome of transplantation in previous studies is driven by many factors including organ donor demographics while studies evaluating real-time organ function pre- and post-transplantation or during organ preservation are still only at initial stage. Real-time monitoring of organ function is important to objectively assess the physiological responses upon organ preservation at each condition. Conditions to be studied and optimized should be evaluated by taking into account all factors contributing to the state of the organ at each stage from organ procurement to transplantation, as well as successful transplantation rates. Determination of best preservation methods at each condition requires setting thresholds of the monitored parameters in order to separate cases leading to optimal and suboptimal preservation. Once preservation methods are optimized for each condition, the number of discarded organs could be reduced. Organ preservation procedures can be objectively optimized by accurately monitoring organ function. Since organ physiology can vary over time, this monitoring is accurate only when performed in real-time (i.e. as frequently as clinically required). Therefore, there is a clinical need for the development of techniques to monitor organ function in real-time.
Real-time monitoring of organ function in clinical transplantation medicine has been predominantly performed using optical techniques [7]. One such optical technique is diffuse reflectance spectroscopy (DRS), also referred as elastic scattering spectroscopy or near-infrared (NIR) spectroscopy in previous studies [7]. Using the DRS technique, biomolecular and microstructural parameters can be retrieved based on the absorption and scattering of light traveling through the tissue, which can be achieved by measuring the tissue reflectance. Since tissue biomolecules have well-defined absorption bands [8] and wavelength-dependent scattering can be approximated using analytical equations of the diffuse media, the extent of the wavelength range determines the number of biomolecules which can be investigated using DRS. Previous studies have used DRS to monitor a wide range of biological processes and to detect diseases based on tissue oxygenation, blood content, hydration, and lipid concentration [9–15]. In terms of monitoring organ function, DRS has been most commonly applied in the NIR range between 700 and 1000 nm [7] in order to determine microcirculatory changes in the tissue oxygenation and hemoglobin concentration in kidney, liver, lung and skin [16–26]. With sufficient spectral resolution and sensitivity, NIR spectroscopy can also be used to assess local reduction–oxidation state of cytochrome a,a3 (Cyta,a3), although inaccuracy of this assessment may occur due to the overlap with the absorption spectrum of hemoglobin types at different proportions [7, 16, 23], as it is unknown whether changes in spectral shape are caused by the presence of hemoglobin types at different quantities or by different concentrations of Cyta, a3. In addition, NIR spectroscopy was used to determine tissue hydration of grafts during skin flap surgery [18]. Finally, non-contact imaging techniques such as spatial frequency domain imaging [27] and hyperspectral imaging [28, 29] retrieving similar information as DRS have been successful in monitoring changes in kidney function related to tissue scattering and absorption properties or tissue biochemistry including blood oxygenation and concentration of blood, water and lipid. Overall, studies using DRS alone or typically in combination with fluorescence-based techniques [30, 31] or laser Doppler flowmetry have been successful in non-invasively monitoring organ function based on the aforementioned biochemical parameters at four phases of transplantation: (a) pretransplantation phase in the donor prior to organ preservation, (b) during preservation, (c) during the transplantation typically after reperfusion, and (d) post-transplantation [7].
Although DRS has been successful in monitoring organ function in preliminary preclinical/clinical transplantation studies including cold storage, infusion of cold perfusate or conducted in normothermic conditions, the preservation phase requires flushing OPS of different compositions. Due to the absorption of aminoacids and carbohydrates in the visible and NIR wavelength ranges, substances present in OPS buffers (such as histidine, glycine, and tryptophan) and OPS impermeants (such as glucose, raffinose and sucrose) may contribute to the DRS signal. The signal of such substances should be included in the data analysis by measuring the OPS absorption spectrum prior to organ function monitoring. Otherwise, assessment could be performed at stages such as before the organ perfusion (for determination of best preservation conditions) or after transplantation (for determination of chances of successful transplantation), as blood perfuses the organ at these stages of transplantation.
In general, monitoring solely the effect of temperature reduction in organ function can be challenging in a clinical setting, as it may be unclear whether physiological changes are induced by OPS constituents, by cold storage or by exposure to the environment with different humidity, temperature and other conditions. Understanding these changes starts with determining the individual contribution of each inducing factor to organ function. In fact, many changes can be induced by OPS of different compositions. To evaluate the effect of temperature in organ function without taking into account effects induced by OPS constituents and environmental conditions, the procedure needs to be performed without disconnecting the organs from the body and minimizing exposure to the environment to avoid dehydration.
In this study, we have investigated the effect of temperature alone on tissue biochemistry and microstructure during cold preservation of organs typically involved in transplantation procedures. In order to study solely this effect in heart, kidney, liver and lung while keeping the blood content, intracellular electrolyte balance, pH, and other physiological conditions as constant as possible without the interference of OPS-induced effects, we ensured our animal (mouse) model had organs cooled simultaneously while still interconnected in the mice body. Tissue microstructural and biochemical parameters were extracted by using a spectral fitting algorithm based on the estimation of chromophore concentrations and scattering properties through contributions of absorption and scattering to the DRS signal in an extended wavelength range between 350 and 1919 nm, which is wider than previous studies and allows determination of a larger number of chromophore concentrations. Optical properties were calculated by using a reflectance database or look-up table (LUT) based on Monte Carlo (MC) simulations of light propagation in tissues. In addition, retrieval of optical properties using LUT database is not subject to limitations of diffusion theory as models in the previous studies. To the best of our knowledge, this is the first study evaluating solely the cooling effect on multiple tissue parameters such as blood oxygenation, concentrations of blood, methemoglobin, water, lipid, and bile as well as scattering amplitude, Mie scattering power and fraction of Rayleigh scattering. Determination of the cooling effect sets the baseline to which other physiological effects due to machine perfusion, storage at different temperature and OPS of different compositions can be added up. In addition, non-invasive and real-time monitoring of tissue microstructural and biochemical parameters of our study could provide information for objective assessment of organ function at different scenarios in order to optimize organ preservation and transplantation procedures.
2. Methodology
2.1. Organ collection and measurement protocol
Ten balb/c female mice used in this study were 6–10 weeks old. The study was performed under the approval of the Research Ethics Committee of University College Cork. All methods were performed in accordance with the relevant guidelines and regulations. The mice were euthanized using cervical dislocation prior to the measurements. Subsequently, the mice were transported to the research center (Tyndall National Institute, Cork, Ireland) where access to their internal organs was enabled by (a) initial incision below the navel going up toward the mouth, (b) downward incision toward the tail, (c) lateral incision at the shoulder joints, (d) lateral incision at the pelvic girdle and (e) removal of the abdominal membrane. Once the internal organs could be accessed, they were rearranged in order to allow exposure of sufficiently large tissue surface for DRS data collection. Then, the mice were positioned at a metallic container and placed in a water bath kept at 37 °C until thermal equilibrium was reached. The temperature of all organs was monitored with a conventional infrared thermometer until their temperature reached between 30 °C and 37 °C (referred as body temperature or BT in this study). Once all DRS measurements were acquired at BT (three measurements per organ per mice), the mice were placed in a container with cold water with ice (0 °C) and left until thermal equilibrium was reached (0 °C–8 °C). Subsequently, three DRS measurements were taken per organ at cold temperature (CT). In total, we have evaluated ten hearts, ten kidneys, ten livers, and ten lungs at BT and CT. Figure 1 shows a schematic of the steps of organ collection and measurement protocol.

Figure 1. Schematic drawing of the mouse organ locations and preservation protocol. The left-side drawing shows the top view of the mouse kept on the water bath after exposure of its internal organs. The right-side drawings show the steps for DRS measurements at BT and CT.
Download figure:
Standard image High-resolution image2.2. Diffuse reflectance spectroscopy (DRS)
The DRS system consisted of a tungsten halogen light source (350–2400 nm, HL-2000-HP, Ocean Optics, Edinburgh, United Kingdom), a one-to-four fan out low-OH silica 600 µm core fiber optic bundle (BF46LS01, Thorlabs, Munich, Germany) with 630 µm source-to-detector center-to-center distance, a visible/NIR spectrometer (350–1137 nm, QE-Pro, Ocean Optics, Edinburgh, UK) and a NIR spectrometer (1095–1919 nm, NIR-Quest, Ocean Optics, Edinburgh, UK). In this experimental setup, the broadband light is delivered to the tissue by using the illumination fiber of the quadrifurcated probe. The reflected light is collected by two fibers adjacent to the illumination fiber and captured by each spectrometer. The overlapping wavelength range (1095–1137 nm) was used to merge the two spectra into one, as explained in section 2.4. More details regarding the DRS system can be found elsewhere [32].
2.3. Data collection
Prior to and after tissue measurements, background and reference data was collected for subsequent calculation of the tissue reflectance (section 2.4). The fiber optic probe was connected to a closed holder with black non-reflective walls and was kept at a fixed distance between the probe and a reflectance standard (FWS-99-01c, Avian Technologies LLC, New London, USA). The light source was turned on for reference measurements and turned off for background measurements. Tissue measurements were recorded by keeping the probe at 90° and in contact with the tissue surface. All measurements were collected using the same fiber optic probe. In total, 240 measurements were collected (30 per organ per temperature point).
2.4. Calculation of tissue reflectance
This study used home-made MATLAB routines (MathWorks Inc., Natick, Massachusetts) for data preprocessing and analysis discussed in sections 2.4–2.6. Tissue reflectance  was calculated as described by the equation (1):
where  is background intensity,
  is intensity of signal collected from tissue,
  is reference intensity, and λ represents each wavelength within the wavelength range measured by a given spectrometer.
Once the reflectance was calculated for both visible/NIR ( ) and NIR spectrometers (
 ), the spectrum at the overlapping wavelengths was used to calculate the area under the curve to normalize
  . Next, the overlapping spectral region of
  and the normalized NIR spectrum
  were interpolated by using 100 points. Then, the spectra were merged in order to obtain the broadband DRS
  according to the weighted sum as per equation (2):
2.5. Spectral fitting and extraction of biomolecule concentrations
After calculating the experimental reflectance  , the DRS spectra were fitted in order to obtain tissue scattering properties (reduced scattering amplitude
  , Mie scattering power bMie, and the percentage contribution fRay), and chromophore concentrations of blood (THb and THC), lipid (flipid), water (fwater), bile (fbile), met-hemoglobin (fmetHb) as well as oxygen saturation (StO2), and average vessel diameter R. These scattering properties and chromophore concentrations are the optimization variables fitted in the algorithm and determine the tissue absorption and scattering wavelength-dependent spectra. Combinations of absorption and scattering coefficients are associated to theoretical reflectance values obtained via a MC LUT obtained with MC simulations of light propagation in homogeneous media. This association allows the reconstruction of a theoretical DRS spectrum which is compared to the experimental spectrum until convergence of the spectral fitting and determination of the scattering properties and chromophore concentrations. Details of our spectral fitting algorithm can be found in the supplementary material (available online at stacks.iop.org/JPD/54/374003/mmedia). We built and used a MC LUT which covered µa values from 0.01 to 300 cm−1 and µs from 0.1 to 1000 cm−1 (spanning optical properties of most tissues [33, 34]) for our spectral fitting, validated the algorithm [35], and implemented the same spectral fitting equations as Nachabe et al [36, 37]. However, contrary to Nachabe et al, our algorithm does not have limitations of diffusion theory.
We emphasize that  may contain traces of bilirubin found in blood at ranges between 5.8% and 40% in humans, especially considering that bilirubin is a bile chromophore. Bilirubin blood serum levels can vary between 10 and 50 mg dl−1 [38] and hemoglobin blood levels vary between 121 and 172 mg dl−1 [34]. With that in mind,
  would represent the bile concentration added to a contribution of bilirubin varying between 5.8% and 40% of THb. The use of bilirubin absorption spectrum in our fitting is limited by the narrow wavelength range reported in the literature [39], which is not sufficient to fit a spectrum between 450 and 1590 nm.
2.6. Statistical tests
In order to evaluate whether changes in parameters extracted from the spectral fitting were statistically significant, we used the Wilcoxon rank sum test. Levels of statistical significance were shown as start marks in boxplots for each parameter: * for p < 0.05 (statistically significant), ** for p < 0.01, and *** for p < 0.001 (statistically highly significant). Even though Wilcoxon rank sum test was used for uniform representation of p-values under the same statistical test, we are aware that two-sample t-test may be more appropriate when distribution is considered normal. Then, we performed the Anderson–Darling and Lilliefors normality tests and show the result of a two-sample t-test for the hypothesis that reflectance measurements of each organ at BT and CT have unequal means. The result of all normality and statistical tests is shown in the supplementary material.
3. Results
In order to understand the effect of cooling on the chromophore concentrations and scattering properties obtained with our spectral fitting, we have analyzed their change before and after the cooling process, corresponding to situation before the cold storage phase of organ preservation. Based on this analysis, we selected THb, StO2, R, flipid, fwater, fbile, α', bMie, and fRay, as relevant parameters to be monitored (considering that fMetHb values are low and suggest that organs were not exposed to oxidizing agents which convert Hb into metHb).
Figure 2 shows that heart exhibited significantly higher THb, StO2, and flipid at CT, whereas the observed values of R, fwater, α', and fRay were significantly lower at CT. As it can be observed, both biochemistry and microstructure of heart superficial tissue significantly changed upon cooling. These changes were reasonably expected when considering heart is the organ with shortest tolerated period of cold ischemia (6 h) [5]. Highest statistical difference was found for StO2, R and α' (supplementary material), which can be highly associated with the cooling effect on heart microvascularity (e.g. vasoconstriction, increased blood oxygenation due to lower tissue oxygen consumption together with unchanged hemoglobin oxygen binding rates) as well as micro- and nano-structure. More details of this effect are explained in section 4.

Figure 2. Boxplots of relevant parameters for differentiation between heart tissue at BT (green) and CT (blue). Red points represent outliers (points at more than 1.5 times the interquartile range away from the bottom or top of the box). Statistical difference: p < 0.05 (*), p < 0.01 (**), p < 0.001 (***).
Download figure:
Standard image High-resolution imageFigure 3 indicates that kidney tissue at BT has a significantly higher StO2 and lower R, fwater, α', and fRay compared to kidney at CT. Apart from cooling-induced changes in microvascular parameters were similar to other organs, kidney tissues did not experience significant alterations in tissue biochemistry. Instead, these tissues exhibited significant micro- and nano-structural changes which affected α' and fRay, which are the parameters with lowest p-values (Wilcoxon rank sum test) after StO2. These changes are not only metabolically expected from previous studies (detailed description in the section 4), but may also be associated with cold-induced alterations in the renal capsule. It is also important to remember that kidney is the organ with longest tolerated period of cold ischemia (24 h) [5], which may be the reason it did not experience changes in many tissue biochemical parameters.

Figure 3. Boxplots of relevant parameters for differentiation between kidney tissue at BT (green) and CT (blue). Red points represent outliers (points at more than 1.5 times the interquartile range away from the bottom or top of the box). Statistical difference: p < 0.05 (*), p < 0.01 (**), p < 0.001 (***).
Download figure:
Standard image High-resolution imageFigure 4 demonstrates that liver tissue presented significantly higher StO2, flipid, fbile and bMie as well as lower R, fwater, and fRay at CT. As observed in heart, liver tissues exhibited significant changes in their biochemistry upon cooling. Despite having a capsule (Glisson capsule and outer serous layer [40]), it did not exhibit as significant structural alterations as heart and kidney. The increase in fbile indicates that livers were viable during the cooling process, as bile is produced at reasonable rates until liver tissue reaches hypothermia at less than 10 °C, where it substantially reduces bile production rates [41]. Parameters with lowest p-values for the Wilcoxon rank sum test were StO2, fwater, flipid and fbile (supplementary material).
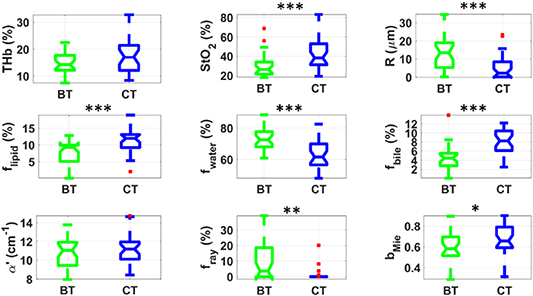
Figure 4. Boxplots of relevant parameters for differentiation between liver tissue at BT (green) and CT (blue). Red points represent outliers (points at more than 1.5 times the interquartile range away from the bottom or top of the box). Statistical difference: p < 0.05 (*), p < 0.01 (**), p < 0.001 (***).
Download figure:
Standard image High-resolution imageFigure 5 demonstrates significantly higher StO2 and fbile, while lower flipid, and α' was found in lung at CT compared to BT. Lung tissues experienced the least cold-induced alterations at tissue parameters investigated in this study. Most statistically significant changes occurred in StO2, which covered a wide range of relatively high StO2 values compared to other organs, as expected from the large surface area of blood vessels exposed to air in lung alveoli. The fact that significant rise in StO2 observed in lung upon cooling was higher than other tissues suggests that hemoglobin molecules are still able to freely bind atmospheric oxygen. In fact, the increased hemoglobin exposure also agrees with the observed increase in fbile, which we believed to be related to the increase in bilirubin formed from the degradation of hemoglobin molecules by the enzyme biliverdin reductase, as bilirubin is one of the main bile pigments/chromophores.
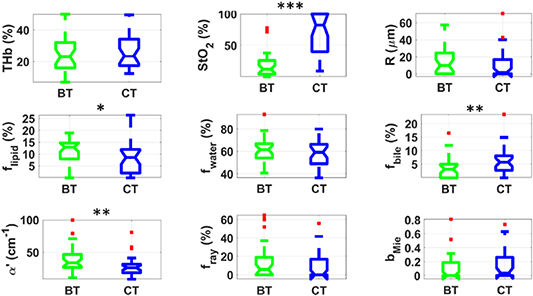
Figure 5. Boxplots of relevant parameters for differentiation between lung tissue at BT (green) and CT (blue). Red points represent outliers (points at more than 1.5 times the interquartile range away from the bottom or top of the box). Statistical difference: p < 0.05 (*), p < 0.01 (**), p < 0.001 (***).
Download figure:
Standard image High-resolution imageTable 1 shows the mean and standard deviation of biochemical and microstructural parameters of heart, kidney, liver and lung at BT and CT. In general, an increase was observed in THb, THC, StO2, flipid, fbile, bMie, whereas a decrease in R, fwater, and fRay was obtained for most organs. Also, the standard deviation of all parameters is typically higher at CT for heart, kidney and liver tissues, and lower at CT for lung tissue.
Table 1. Biochemical and microstructural parameters of preserved organs at BT and CT.
| Parameters | Heart BT | Heart CT | Kidney BT | Kidney CT | Liver BT | Liver CT | Lung BT | Lung CT |
|---|---|---|---|---|---|---|---|---|
| THb (%) | 12.9 ± 1.9 | 16.0 ± 4.4 | 12.8 ± 2.5 | 13.0 ± 3.0 | 14.6 ± 3.9 | 17.5 ± 6.4 | 25.3 ± 12.6 | 26.7 ± 11.5 |
| THC (μM) | 299 ± 44 | 372 ± 102 | 298 ± 58 | 302 ± 70 | 339 ± 90 | 407 ± 148 | 588 ± 294 | 622 ± 268 |
| StO2 (%) | 21 ± 9 | 36 ± 9 | 22 ± 5 | 40 ± 11 | 30 ± 12 | 44 ± 17 | 20 ± 24 | 69 ± 33 |
| R (μm) | 20 ± 7 | 8 ± 6 | 16 ± 7 | 13 ± 6 | 12 ± 9 | 5 ± 7 | 15 ± 17 | 10 ± 16 |
| flipid (%) | 5.0 ± 4.2 | 8.4 ± 5.6 | 10.7 ± 13.9 | 14.1 ± 13.5 | 8.0 ± 3.1 | 11.6 ± 3.6 | 11.3 ± 5.1 | 8.2 ± 6.4 |
| fwater (%) | 79.2 ± 3.9 | 73.2 ± 6.5 | 73.8 ± 14.8 | 69.4 ± 13.3 | 72.8 ± 6.7 | 62.9 ± 8.6 | 59.9 ± 12.4 | 58.6 ± 10.9 |
| fbile (%) | 3.0 ± 2.2 | 2.4 ± 2.0 | 2.7 ± 1.7 | 3.5 ± 2.5 | 4.6 ± 2.8 | 8.0 ± 2.7 | 3.5 ± 3.7 | 6.4 ± 5.0 |
| fMetHb (%) | (2 ± 4) × 10−9 | (0.3 ± 1) × 10−7 | (0.9 ± 5) × 10−7 | 0.0 ± 0.1 | 0.2 ± 0.3 | 0.4 ± 0.4 | 0.1 ± 0.5 | 0.2 ± 0.7 |
| α' (cm−1) | 12.5 ± 2.2 | 8.4 ± 1.6 | 10.3 ± 1.2 | 8.8 ± 1.4 | 10.7 ± 1.5 | 11.4 ± 1.6 | 39.6 ± 20.1 | 28.0 ± 15.1 |
| bMie | 0.2 ± 0.1 | 0.3 ± 0.2 | 0.5 ± 0.2 | 0.5 ± 0.1 | 0.6 ± 0.1 | 0.7 ± 0.1 | 0.1 ± 0.2 | 0.2 ± 0.2 |
| fRay (%) | 45 ± 14 | 32 ± 13 | 27 ± 11 | 11 ± 13 | 10 ± 13 | 1 ± 4 | 14 ± 21 | 8 ± 14 |
4. Discussion
4.1. Impact of using a DRS spectral fitting model based on MC LUT and extended wavelength range
In this study, we assessed the effect of cooling on tissue microvascularity (total hemoglobin percentage THb, oxygen saturation StO2, average vessel diameter R, methemoglobin percentage fMetHb), hydration (fwater), lipid content (flipid), bile concentration (fbile), and microstructure (scattering amplitude α', Mie scattering power bMie and fraction of Rayleigh scattering fRay). The success of this assessment can be confirmed by expected trends of several parameters including (a) the increase of StO2 at CT due to metabolism reduction and less oxygen consumption, (b) decrease in average vessel diameter due to vasoconstriction and (c) bile production in liver during the cooling process, as liver metabolism is still active until it reaches low temperatures. With this assessment, we have demonstrated that DRS could potentially be used for multiparametric evaluation of organ function [30, 31, 42–47], and hypothermia effects associated with tolerated cold storage times. This evaluation could be applied at stages of the transplantation procedure where intervention may be required.
Although previous studies have used DRS and non-contact optical methods retrieving similar reflectance quantities to determine tissue THb, THC, StO2, fwater and flipid, studies evaluating the DRS extended wavelength range between 450 and 1590 nm such as the present study are scarce. The importance of considering the extended NIR wavelength range in the DRS spectral fitting algorithm has been demonstrated by Nachabe et al [37] through calculation of similar biochemical and microstructural parameters obtained in this study by using a diffusion-theory-based spectral fitting algorithm for wavelength ranges between 500–1000 nm and 500–1600 nm. Even though microvascular parameters (THb, THC, StO2) and bMie were not significantly affected by the wavelength range extension, fwater, flipid, α', and Mie-to-Rayleigh fraction of the scattering (i.e. 1 − fRay) experienced a significant change that would not be possible to consider without the extension. Hence, extracting biochemical and microstructural parameters by using the wavelength range between 450 and 1590 nm in this study allows a more accurate calculation of fwater,more accurate calculation flipid,more accurate calculation α' and fRay.
It is important to remember that this study was based on a MC LUT-based spectral fitting algorithm instead of a diffusion-theory-based algorithm and, thus, does not have diffusion-theory restrictions (including invalidity at highly anisotropic media, and when the reduced scattering coefficient  is not substantially higher than the absorption coefficient
  ) existent at spectral regions of high absorption by blood and water. With this in mind, the wavelength range extension may affect THb, THC and StO2. Even though no significant statistical differences were shown previously [36, 37], the absence of these differences may happen merely due to the lack of diffusion theory validity at spectral regions used to estimate microvascular parameters. Then, the determination of microstructural and biochemical parameters may be more accurate in our study, as these parameters are interdependent during their calculation by the DRS spectral fitting algorithm. The accuracy of this determination can be important to appropriately characterize heart, kidney, liver and lung tissues, which are commonly transplanted. Furthermore, understanding the effect of cooling in these organs can be relevant for several applications discussed in the next sections of this manuscript.
4.2. The effect of cooling on tissue metabolism reduction upon cooling
The combination of pathophysiological processes responsible for organ injuries is called ischemia/reperfusion injury (IRI). IRI can occur at different stages of transplantation process such as organ retrieval from the donor, organ preservation, and reimplantation in the recipient (reperfusion). However, alterations on tissue microstructure and biochemistry related to cooling alone have been poorly investigated, especially because the success of organ preservation through cold storage has been shown to depend on many variables including the type of death of the organ donor, vascular flushing organs with OPS of different compositions, cold storage times, and adoption of static or machine perfusion strategies [4, 5].
Although previous research has empirically investigated the contribution of these variables to the success of the transplantation procedure and organ preservation has been shown to be a major contributor to graft survival after revascularization [5], it is still unclear whether organ ischemia is caused by the cooling process or the actual cold storage. With this in mind, understanding the effect of cooling in the preservation of each type of organ is essential to determine whether organ preservation strategies based on cold storage are more effective than midthermic and normothermic strategies. Even though cooling has well known harmful consequences on tissues due to oxidative stress and inflammation [5] for relatively long cold exposure times, cold storage preservation techniques are still the most widespread in transplantation procedures [4, 5].
Using hypothermia to maintain organ viability was considered as one of the first strategies to contain repercussions of ischemia during organ transfer from donor to recipient [48]. Cooling is the first organism response against hypoxia, as metabolism reduction decreases the need for oxygen used in the aerobic respiration. Depression rate of metabolic reactions with cooling was quantified by using the Q10 rate created by Heilbrunn et al [49]. This rate indicates the drop of reaction rate for every 10 °C reduction in temperature. Zimmerman et al [50] and Fuhrman et al [51] showed that Q10 is approximately 2 from 20 °C to 40 °C for a number of reactions, and increases to between 3 and 5 for temperature ranges from 0 °C to 20 °C. Therefore, decreasing an organism temperature from 40 °C to 0 °C would reduce the metabolic reaction rate by 36–100 times, leading to structural and biochemical changes at subcellular level [52]. Structural changes happening within hours of cooling [52] include precipitation of F-actin microfilaments and depolymerization of microtubules upon storage of hepatocytes at 4 °C [53], while kidney cells experience microtubule disruption by cold [54]. In both liver [55] and kidney [56], mitochondria swelling and vacuolization was also observed. The aforementioned structural changes would be detectable by studies evaluating organs preserved using hypothermia, as storage may take 12–24 h. In this study, both kidney and liver tissue have already experienced microstructural changes leading to alterations in optical scattering (scattering amplitude and fraction of Rayleigh scattering) within 3 h.
Tissue/cellular biochemical changes due to cooling include inflammation (cytokine production) and oxidative stress (production of reactive oxygen species), cell edema, increased anaerobic glycolysis, cell membrane depolarization, disruption of the membrane permeability, breakdown of ion homeostasis, degradation of adenosine, accumulation of calcium, sodium, water, hypoxanthine and xanthine oxidase within the cell [5]. These changes lead to a sequence of membrane and intracellular events which culminate in protein degradation and membrane injury responsible for lethal cell injury [57], necrosis and apoptosis [58].
In this study, tissue metabolism could be assessed through parameters such as StO2, fbile, scattering amplitude (α'), bMie, and fRay shown in table 1. Based on these parameters, tissue oxygenation was higher for all organs at low temperatures, which suggests reduction of tissue metabolism and oxygen consumption in conditions where oxyhemoglobin is still present 3 h after animal death. In addition, α' decreases for heart, kidney and lung, bMie increases for liver and fRay decreases for heart, kidney and liver. In kidney, disruption of microtubules and membrane permeability/polarization (along with respective membrane structural changes) may be associated with the fRay decrease, as absence of microtubules (typical diameter of about 25 nanometers) reduces the amount of Rayleigh scattering and membrane depolarization may be accompanied by reduction of refractive index mismatches (plasma membrane thickness ranges from 5 to 10 nm). While the same changes may occur due to membrane depolarization in liver and heart, liver fRay reduction may be also related to F-actin microfilament precipitation and microtubules depolymerization. The mitochondria swelling and vacuolization of both kidney and liver may affect all scattering parameters α', bMie, and fRay due to the generation of Mie scattering which is the predominant type of scattering in biological tissues. In this case, larger mitochondria would generate (a) higher α' due to larger amount of refractive index mismatches within the same cell volume, (b) lower bMie characteristic from larger scattering particles, and (c) unknown effect on fRay, as more Mie scattering may happen depending on the increase of mitochondrial size while the generation of Rayleigh scattering increases due to a larger number of membranes (5–10 nm) within mitochondria. Finally, the increased fbile in liver shows that the liver tissue was viable during the entire period of our experiment. We cannot draw any conclusion about the bile production at CTs in this study, as temporal measurements were not considered. Still, we show that bile was produced by liver from the time of mice euthanasia to the end of the cooling process (as temperatures varied from a maximum of 37 °C to a minimum of 0 °C), even though it is well known that liver produce little bile during hypothermia (less than 0.1 mg per 50 h at organ constant temperatures of 4 °C) [41].
4.3. Microvascular effects of cooling
The oxidative stress produced by reactive oxygen species are hypothesized to be one of the factors involved in the microvascular and parenchymal cell injury during organ preservation [5]. According to Guibert et al [5], 'oxygen radicals increase microvascular permeability by creating large leakage sites predominantly in the small venules'. Parks et al [59] showed that these radicals are indirectly associated with circulatory shock, which means oxygen stress will have an effect on aerobic cellular respiration and related metabolic pathways including those discussed on the previous section of this manuscript. Metabolic reactions related to aerobic cellular respiration affect the cellular levels of adenosine triphosphate (ATP) during ischemia, while those associated to increased anaerobic glycolysis generate intracellular acidosis and changes in the mitochondrial membrane permeability [5]. A certain threshold of this permeability and ATP levels determines events of apoptosis or necrosis. The amount of these events decides whether organ dysfunction will occur after organ preservation at CTs.
When cold preservation is associated to warm re-oxygenation (reperfusion with blood at BT), liver cell injury causes dysfunction in the bile secretion, drug metabolism, mitochondrial function, cell volume [60]. In general, mitochondrial permeability transition associated with mitochondrial swelling is expected from most cells [5]. However, liver endothelial cells exhibited mitochondrial ultracondensation [61] which may be involved with apoptosis [62]. Upon rewarming to 37 °C after 2 h of cold incubation in Univeristy of Wisconsin (UW) solution, Kerkweg et al [62] showed that mitochondrial alterations were fully reversible and cells remained viable, while mitochondrial fragmentation was experienced by liver cells rewarmed after 18 h of cold incubation. Biochemical and microstructural changes associated with cold-induced injury were not well determined for other organs and still depend on the combinations of (a) cooling processes used, (b) OPS and (c) oxygen supply during preservation [5, 63]. These changes determine the tolerated periods of cold ischemia, which typically ranges between 6 and 24 h and is highly dependent on the organ (6 h for heart, 8 h for lung, 12–15 h for liver, 24 h for kidney) [5].
In the present study, we have shown that, upon cooling, THb was higher for heart, StO2 was higher for all organs, and the average vessel diameter (R) was smaller for heart, kidney and liver. Higher heart THb may be explained by the increase of vascular permeability due to the increase of oxygen radicals, as described by Guibert et al [5]. Once this permeability increases, leakage may happen on small vessels, which increases the amount of blood available in the tissue surface. Since the tissue surface is where most of the signal of our DRS probe is collected, an apparent rise in THb is sensed. In fact, a consistent increasing trend (on average) was observed for all organs, although this increase is not statistically significant. The leakage can be even more pronounced if we consider that statistically significant vasoconstriction is present in most organs (lower R values) and that small venules are more likely to leak [5]. A significant difference in THb may have been observed only in heart because it is the organ containing larger amount of blood vessels. Decreasing R is expected due to vasoconstriction at lower temperatures. Even though lung did not exhibit significant statistical difference in R, a decreasing trend was observed on average. Finally, we believe that hemoglobin molecules could still bind to oxygen to form HbO2 throughout the duration of our DRS measurements, as StO2 was higher for all organs upon reduction of the tissue temperature and, thus, its metabolism and oxygen consumption. We should emphasize that DRS does not only measure hemoglobin inside the blood vessels and red blood cells, but can also include free hemoglobin which may leak to tissues due to increase vascular permeability. Intra- or extracellular hemoglobin found closer to the tissue surface may bind to oxygen at higher rates. Therefore, the significant increase in StO2 for all organs may be explained by summing up increased formation of HbO2 and reduced oxygen consumption by tissues.
4.4. Tolerated periods of cold ischemia
Currently, tolerated times of cold ischemia are determined by empirical tests based on the outcome of conventional transplantation protocols [4, 5]. However, this outcome depends on many factors unrelated to the organ preservation such as organ donor demographics and available resources and there is no consensus on the best organ preservation strategy [5]. Since these strategies involve hypothermia in most of cases, understanding the effect of cooling alone is essential to build tools for real-time monitoring of organ function, which can be used to determine personalized tolerated cold ischemia times for each transplantation case. For instance, one can monitor tissue blood oxygenation prior to organ preservation and after reperfusion, but still not be able change negative outcomes of the transplantation procedure, as interventions to make the procedure successful should happen at organ preservation stage. These interventions include tailoring the procedure to accommodate the appropriate optimum cold storage period once this period is accurately determined by supporting medical devices.
Although tolerated times of cold ischemia are fixed by protocols, it is clear that optimum times may differ for donation after circulatory death (DCD) and donation after brain death (DBD), as DCD cases involve organs that experience cessation of blood flow for extended periods and, therefore, earlier lack of oxygenation. These times and their negative impact in kidney transplantation before machine perfusion preservation are discussed in detail by Paloyo et al [64], who showed that DCD transplants had higher (30.5%) overall incidence of delayed graft function compared to DBD transplants (7.3%). In addition, unfavorable effects were observed for SCS higher than 6 h for DCD recipients and hypothermic machine perfusion (HMP) times higher than 36 h for both DBD and DCD recipients. Yet, although detrimental hypothermic effects have been shown through graft survival in Kaplan–Meier curves, optimum SCS and HMP times could be specified.
By understanding the effect of cold ischemia, calculation of the optimum cold storage time in both DBD and DCD transplantation cases could be based on the parameters evaluated during real-time organ function monitoring. For example, by knowing the oxygen saturation (StO2) of each organ after circulatory death and their oxygen consumption between the interval between circulatory arrest and declaration of death, it may be possible to calculate how much tolerated cold storage time could be deduced for higher chances of transplantation success.
Our results suggest that, even though the oxygen is still consumed at body and cold storage temperatures, there may be an oxygen diffusion rate to hemoglobin inside or outside blood vessels which allows blood to be more oxygenated upon cold storage. With this in mind, StO2 information combined with determination of oxygen inflow into tissues could be used to calculate the oxygen consumption of each organ. Furthermore, we have demonstrated that DRS could be used to measure StO2 after cold storage in clinical settings for more precise determination of StO2 in diverse cases. It is important to note that StO2 can be combined with other parameters to evaluate organ viability such as fbile for liver.
4.5. The design of new OPSs
In general, OPS were developed to circumvent problems generated by vascular flush perfusion of cooled heparinized blood or diluted blood such as early vascular stasis upon graft reimplantation [4, 5, 48]. That way a replacement for blood solutions was sought by understanding the requirements of animal systems to adapt to cold exposure including (a) metabolic suppression, (b) metabolic pathways allowing minimal long-term energy supply and (c) improved defense mechanisms to revert the metabolism back to normal activity after hibernation [52]. While OPS can be designed to induce similar changes into human organs for survival during cold storage, OPS should ideally be synthetic solutions that could be available at short notice, reliably produced, and sterilized. With this in mind, Collins et al [65] designed one of the first OPS to resemble the intracellular electrolyte balance of the mammalian cells and, subsequently, other OPS were created with diverse compositions of electrolytes, buffers, impermeants and pharmacological agents [4, 5].
Ultimately, current OPS design would primarily consider empirical laboratory tests in cells or excised tissues, preclinical animal experiments, and outcome of clinical trials. Cell/excised tissue studies are typically centered on understanding the biochemical effect of OPS with a delay in analysis, whereas animal and human experiments are focused on the outcome of the transplantation. However, studies monitoring tissue biochemistry, especially in the cold storage phase are scarce, and novel OPS design may benefit from understanding biochemical and microstructural changes due to cold organ preservation at tissue level in real-time. Our study has shown that monitoring these changes with DRS is feasible and could potentially be applied in other preclinical/clinical settings. Based on our findings, metabolic changes can be evaluated during cold storage and, thus, results of metabolic modulation using OPS could be assessed using the same parameters associated with organ viability such as StO2 and fbile. Still, it is important to remember that changes in other parameters reported in this studied should be considered in that assessment, as variables extracted by our spectral fitting algorithm are interdependent.
With the development of the machine perfusion strategies, it is increasingly important to monitor biochemical parameters during organ preservation through hypothermic/midthermic/subnormothermic perfusion. Evaluated parameters should be related to processes improving perfusion effectiveness such as (a) prevention vasculature compression due to expansion of the interstitial space, (b) counteracting hypothermic cellular edema, and (c) in the case of oxygenated solutions, supply of appropriate gas atmosphere to reduce oxidative metabolism. Points (a) and (b) could potentially be monitored by fwater. Microvascular parameters would be challenging to monitor based on hemoglobin parameters of DRS, as blood will be replaced by OPS in perfused organs. Yet, the tissue average vessel diameter may be monitored if a chromophore with known absorption spectrum in the wavelength range probed by DRS is present in the OPS composition. Finally, DRS could be used to evaluate other OPS characteristics relevant to the success of graft survival such as the viscosity and colloid osmotic pressure (COP). COP counterbalances the filtration pressure in the bloodstream and equilibrates the water distribution between the interstitial space and vasculature. Therefore, it controls the intracellular and interstitial water content during hypothermic perfusion and postperfusion effects on blood flow, bile production and tissue injury [4]. Since COP effects influence fwater, fbile and potentially microvasculature parameters, DRS could be a potential tool used to monitoring those effects on organ grafts during HMP. In addition, viscosity may affect organ viability due to different diffusion rates of OPS components, while at times the viability is indirectly influenced by biological processes associated with OPS composition (such as added colloids and pharmacological agents). van der Plaats et al [66] showed that UW preservation solution containing hydroxyethyl starch caused red blood cell aggregation which affected organ washout. In this case, using lower viscosity meant lower vascular resistance and improved organ viability compared to organs flushed with cold UW solution (higher viscosity). However, even though OPS viscosity is strongly affected by the temperature and COP, the temperature dependence of the viscosity of different OPS formulations as well as resulting effects on transplantation has not been thoroughly investigated [4]. The knowledge gap that needs to be investigated presents a good opportunity for optimization of OPS formulation based on biochemical parameters extracted by optical techniques combined with other analysis methods. The flowchart shown in figure 6 summarizes the potential value of DRS parameters for transplantation procedures and optimization of OPS formulations.

Figure 6. Potential applications of DRS parameters for transplantation procedures and optimization of OPS formulations.
Download figure:
Standard image High-resolution image
4.6. Limitations and validity of our study
The animal model used in this study focused on evaluating the effect of temperature alone on tissue microstructure and biochemistry. In order to do this, we attempted to suppress the physiological changes induced by OPS constituents, and by exposure to the environment by keeping organs interconnected in the mice body. The model we used was not intended to resemble cold storage in a real clinical scenario because this storage can be changed by multiple variables which are the reason why no consensus on the optimal strategy for SCS has been achieved up to date. With this in mind, we provided tissue biochemical and microstructural parameters which constitute a baseline for the addition of physiological effects due to other factors such as OPS of different compositions, machine perfusion, and storage at different temperatures. To properly consider the effects of such baseline, we recommend taking into account the following differences between cooling in our animal model and that performed in a clinical setting:
- (a)Temperature distribution and heat conduction: in organ donation and preservation with cold storage methods, the first cooling process (prior to storage) happens due to perfusion of low-temperature OPSs, which cool organs starting from perfused tissue volumes reached by OPS within them (heat exchange from the inside to outside the organ). This cooling process is different from the homogeneous cooling performed in this study, as heat is exchanged from outside the organ to its inside. Due to differences in temperature distribution, changes in scattering properties during the cooling process will depend on the microstructure of each organ, as cooling from inside or outside the organs may shrink complex tissue structures in many different ways (e.g. position and thickness of tissue layers) and lead to different distributions of scattering particles over the tissue volume. In addition, tissue scattering is also expected to be affected by the state of lipid molecules which may transition from a 'liquid' to a 'solid' phase upon temperature reduction from BTs to cold storage temperatures. In this case, cooling from outside the organ might change the scattering locally at the tissue surface compared to cooling from the perfused locations, as cellular and subcellular structures containing lipids may have their scattering properties altered. However, it is worth noting that we would not expect variations in the tissue lipid content due to differences in temperature distribution within the organ during relatively short cooling procedures.
- (b)Cooling interval: Perfusing the organ with OPS cools organs faster than cooling organs by placing them in a cold environment, as perfusion is constantly replacing the OPS volumes which exchanged heat with tissue (higher OPS temperatures after heat exchange) by new volumes with low-temperature OPS. Thus, the cooling interval from BT to CT may be reduced in medical settings. We expect faster cooling to be associated with quicker stabilization of StO2 (dependent on oxygen consumption) and water content (fwater; dependent on organ dehydration rates). With this in mind, absolute StO2 and fwater values obtained in our study are not relevant to the reality of transplantation procedures, as short-term StO2 and fwater readings in the real case scenario will depend on the time interval taken for organ removal and transportation prior to be perfused with OPS. Yet, we believe that the StO2 and fwater variation investigated in this study are important to be considered.
- (c)Organs interconnected in the body: The variation of StO2 is not completely separated for each organ if there is interaction between organs due to connection molecular diffusion within blood vessels. However, we believe that this interaction is limited, as there is no blood flow or circulation in our animal model, and the molecular diffusion is expected to be relatively slow to cause StO2 differences during the cooling process.
- (d)Organ viability: The impact of factors described above on organ viability is still unknown. The short-term physiological effects induced by these factors during cooling may affect organ viability and, thus, impact viability-associated parameters such as fbile in liver tissue.
Finally, the probed depth of DRS in the tissues targeted in this study is estimated to be up to 1 mm slightly depending on the wavelength. The probed depth can be increased by using fiber optic probes with larger source-to-detector distances or by using time-resolved techniques. We would like to emphasize that our study provides only a proof-of-principle for the DRS technology to be deployed in organ preservation monitoring and characterizes the effect of temperature alone during cold preservation of mouse organs, which can be further translated into technology involving human organs in future research.
5. Conclusions
In this study, we determined tissue microstructural and biochemical parameters of mouse organs at temperatures between 30 °C and 37 °C and following cooling to 0 °C–8 °C. The effect of cooling alone at temperature ranges close to those used in SCS and HMP procedures was investigated in commonly transplated organs including heart, kidney, liver and lung. To the best of our knowledge, we are the first to assess this effect on multiple tissue parameters such as THb, StO2, R, fwater, flipid, fbile, α', bMie, fRay, which were monitored simultaneously based on the extended wavelength range between 450 and 1590 nm used in our spectral fitting algorithm, and our MC LUT including a wide range of tissue optical properties compared to previous studies. From a fundamental research perspective, this study can be used to understand the impact on biological processes of the tissue cooling process alone without the induced effects of OPS of different compositions. By understanding these processes, it may be possible to propose new strategies involving optimized cold storage times and OPS composition for minimized cellular and tissue damage. From a practical perspective, the effectiveness of these strategies could potentially be monitored at several transplantation phases with DRS using the extended wavelength range and tissue parameters of this study. In fact, continuous monitoring of organ function may be possible if DRS is used with compact devices such as microchips working from 0 °C to 40 °C that could be attached to the organ. Since these devices may have lower sensitivity, the chromophore concentration and scattering properties may be useful to simulate whether sufficient sensitivity can be achieved for detection of the desired parameters in order to improve the device design. Ultimately, research may result in improved patient prognosis resulting from reduced organ failure and increased survival rates.
Acknowledgments
This study received financial support from Science Foundation Ireland (SFI): Grant ID SFI/15/RP/2828. We would also like to acknowledge Dr Mark Tangney and members of his research group for the help in the logistics of the mice experiments.
Data availability statement
The data that support the findings of this study are available upon reasonable request from the authors.
Author contributions
M S N Conceptualization, Methodology, Software, Validation, Formal analysis, Investigation, Resources, Data Curation, Writing—Original Draft, Writing—Review & Editing, Visualization, Supervision, Project administration, M R Conceptualization, Methodology, Software, Validation, Formal analysis, Writing—Review & Editing, K K Conceptualization, Methodology, Investigation, Resources, Data Curation, Writing—Review & Editing, K G Methodology, Investigation, Resources, Visualization S A E Conceptualization, Methodology, Resources, Software, Validation, Formal analysis, Investigation, Data Curation, Writing—Original Draft, Writing—Review & Editing, Visualization, Supervision, Project administration, Funding Acquisition.
Conflict of interest
The authors declare no conflicts of interest.