

Abstract
The temporal dynamics of the spatial distribution of atomic hydrogen and oxygen in a lean methane–air flame, forced by a nanosecond repetitively pulsed discharge-induced plasma, are investigated via femtosecond two-photon absorption laser-induced fluorescence technique. Plasma luminescence that interferes with the fluorescence from H and O atoms was observed to decay completely within 15 ns, which is the minimum delay required for imaging measurements with respect to the discharge occurrence. During discharge, H atoms in the excited state rather than the ground state, produced by electron-impact dissociation processes, are detected at the flame front. It was found that the temporal evolution of H and O fluorescence intensity during a cycle of 100 µs between two discharge pulses remains constant. Finally, the decay time of O-atoms produced by the discharge in the fresh methane–air mixture was about 2 µs, which suggests a faster reaction between O-atoms and methane than in air.
Export citation and abstract BibTeX RIS

Original content from this work may be used under the terms of the Creative Commons Attribution 4.0 license. Any further distribution of this work must maintain attribution to the author(s) and the title of the work, journal citation and DOI.
This article was updated on 26 October 2021 to correct the funding information.
1. Introduction
Glow discharge-induced non-equilibrium plasma, particularly by nanosecond repetitively pulsed (NRP) discharge, has been explored for various applications such as controlling thermo-acoustic instabilities of turbulent flames and enhancing combustion efficiency through intermixed thermal, chemical, and electric field effects [1]. Most of these applications share a common need for measurements of temporally- and spatially-resolved distributions of key atomic and intermediate species, such as H, O, OH and CO, in order to understand the kinetics of reacting gas-plasma mixtures. For instance, the generation of H and O atoms in low-temperature flames under plasma forcing initiates chain-branching reactions, and thus reliable data of concentrations and distributions of these species would benefit the validation of kinetic models. Over the past few years, the femtosecond two-photon absorption laser-induced fluorescence (fs-TALIF) technique has been increasingly utilized to perform such measurements [2, 3], due to its superiority over nanosecond TALIF (ns-TALIF) in terms of more efficient excitation, reduced sensitivity to photolytic interferences, and capacity to directly measure the quenching rates of the excited states. In addition, fs-TALIF can be extended to two-dimensional (2D) imaging of atomic species while maintaining sufficient laser intensity in more challengeable environments compared to ns-TALIF [4, 5].
Plasma-assisted combustion (PAC) can be studied in various flame zones where some are more relevant in terms of energy conversion than others. The effect of plasma stimulation in the post flame region is of least interest for combustion stimulation and control whereas plasma reforming of the unburned gas mixtures, upstream of the reaction zone, can have an effect on combustion kinetics. Effects of high-voltage exposure of gas mixtures are dependent on (a) the gas composition, (b) physical conditions such as temperature and pressure as well as (c) the spatiotemporal high-voltage characteristics, which is dependent on electrode configuration as well as pulse duration. The chemical dynamic effects from pulsed high voltage stimulation starts developing after the initial electron-related reactions cling out and the effect of a subsequent high voltage pulse could thus be very different from the preceding one. Investigations of how NPR discharges affect gas compositions can therefore be performed after a single event or a sequence of pulse stimulations where different results are expected in different regions of the flame. Furthermore, investigations of how plasma affects different gas compositions also yield information on what kind of plasma forcing can be achieved in certain experimental conditions. Even though this information is of utmost important for implementing plasma forcing for combustion enhancement and control in industrial combustors it makes the parameter space rather large.
A few investigations of plasma formation have been carried out in various gas compositions at different temperatures and pressures with ns-pulsed high voltage of different characteristics. Stancu and Rusterholtz et al monitored the immediate buildup and decay of excited molecular nitrogen, N2(A), N2(B) and N2(C) when preheated air (1000 K) was exposed to nanosecond high voltage pulses at atmospheric pressure [6–8]. They simultaneously monitored the O-atom build-up by TALIF and saw indications that O-atoms were formed by dissociative quenching of O2 by excited N2 in their experimental conditions. Uddi et al exposed stoichiometric methane/air and ethylene/air gas mixtures to a 25 ns high voltage pulses at ∼0.08 atm [9]. They also presented modelling results which display that the two primary channels of O-atoms were provided by electron impact dissociation and by dissociative quenching of O2 by excited N2. Their experiments displayed that the decay time of O-atom concentration strongly relates to the gas composition which was well predicted by the simulated results. These results pinpoint the need to consider residence times between plasma discharge stimulation and combustion in order to take advantage of the enhanced reactivity of the plasma-produced oxygen atoms in the actual combustion process which was investigated separately by Ju et al [10]. Buildup of O-atom concentration during multiple high voltage pulse stimulation was investigated by Lanier et al [11] at 0.053 atm in C2H4–O2–Ar gas compositions. They used up to 30 kV high voltage pulses with a temporal duration of 50–100 ns and a repetition frequency of 40 kHz, and showed that the oxygen concentration reached a peak after about 100 pulses. Sun et al investigated the O-atom concentration in an O2–Ar–He–CH4 gas mixture at 0.079 atm with 32 kV ns pulses (12 ns pulse duration) showing that the oxygen atom concentration monotonically increases with the pulse repetition frequency (PRF) [12]. Formation of atomic species in bursts of ns-discharge formations were also conducted by Yin et al who focused on hydrogen [13]. They carried out their investigation in Ar–O2–H2 gas mixtures at 0.053 atm at 300 K using a burst of 100 ns long high voltage pulses yielding diffuse filaments. Their results indicate that the H-atom concentration reached a plateau value already after 20 pulses and that the H-atom concentration decays and is beyond the detection limit of 2 ms after the last pulsed discharge in the burst.
All these investigations [6–13], have been carried out by studying gas reforming of stable gas mixtures and they all displayed a steep rise of atomic H and O after plasma forcing, followed by a rapid decay. Recent work by the current authors demonstrated 2D fs-TALIF imaging of atomic hydrogen in a lean premixed methane–air flame under 10 kHz NRP discharge-induced plasma forcing of the unburned gas mixture, flame front and post flame region [14]. Significant deformation of the flame as well as the spatial distribution of H atoms towards the cathode was observed in the case of NRP glow discharge forcing. Under plasma forcing, the H-atom fluorescence was increased by up to ∼50%. It was noticed that within a time window of dozens of nanoseconds after the discharge occurrence, strong broadband discharge-induced plasma luminescence overwhelmingly concealed the rather weak fluorescence signal of H-atoms. Therefore, great care has to be taken while selecting the detection timing of the H-atom fluorescence in order to make sure that the plasma luminescence has decayed completely.
In the current work, a spectroscopic method was employed to study the temporal evolution of fs-TALIF of H and O atoms in order to acknowledge the influence of NRP discharge on the flame, particularly within the short time period around the discharge occurrence. Spectrally resolved detection along a vertical line through the centre of the flame allows improved discrimination of contributions from laser-induced H or O atom fluorescence from broadband plasma luminescence as it provides a higher ratio between the two components in a specific wavelength window. In addition, the spatial resolution along the vertical axis allows identification of the spatial locations of the emitted signals. With this spectroscopic method, we are also able to measure the temporal evolution of H and O fluorescence during the short period of strong plasma luminescence, which was previously not possible for 2D imaging.
2. Experimental setup
A picture and a schematic of the PAC burner are shown in figures 1(a) and (b). The burner is composed mainly of a laminar stagnation plate burner fed with a lean methane–air pre-mixture and a nitrogen co-flow. The gas flow rates were set to 5.24 slpm for air, 0.41 slpm for methane and 8.82 slpm for N2, which provides an average bulk velocity of 1.2 m s−1 for the pre-mixture and an equivalence ratio of 0.76. As shown in figure 1(b), the V-shaped flame operates under atmospheric pressure and stabilizes in the middle of a 10 mm gap between the nozzle and a quartz stagnation plate.
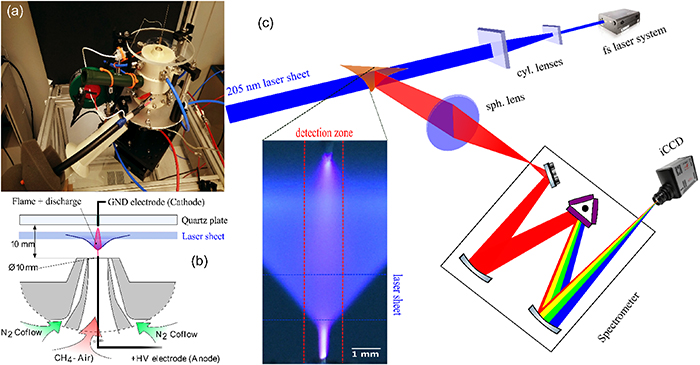
Figure 1. (a)–(b) Picture and schematic illustration of the PAC burner. (c) Schematic illustration of the experimental setup. The inset shows a conventional digital-camera photo of the flame under pin-to-pin glow discharge forcing with a voltage amplitude of 8.0 kV. The scales of laser sheet and detection zone are also depicted in the inset.
Download figure:
Standard image High-resolution imageThe plasma is created with NRP discharges in a pin-to-pin configuration and crosses the flame through its centre. The voltage pulses have 10 ns duration, 10 kHz PRF and 3.0–9.0 kV amplitude. For an applied voltage of 8.0–8.4 kV, the average plasma power is roughly 1–2 W, which is less than 1% of the thermal power of the flame (∼220 W).
The deep ultraviolet laser pulses for exciting H and O atoms are provided by a wavelength-tunable fs-laser system. The laser pulses have a duration of 125 fs, pulse energy of ∼40 µJ at 205 nm (for H-atom excitation) and ∼100 µJ at 226 nm (for O-atom excitation). More detailed information about the PAC flame, NRP discharge device, fs-laser system and 2D fs-TALIF imaging setup can be found in our previous work [14].
The experimental setup for the spectroscopic measurements is shown in figure 1. The fs laser beam passes through two cylindrical lenses (f1 = −150 mm, f2 = 500 mm) to form a vertical 6 mm wide, 100 μm thick laser sheet. The generated fs-TALIF signal is imaged with a spherical lens onto the vertical slit (maximum width of 3 mm) of a spectrometer (Princeton Instruments, Acton SP2500, 500 mm focal length). The spectrometer disperses the collected signal using a grating (1200 grooves/mm blazed at 500 nm) before it is detected by an intensified charge-coupled device (iCCD) camera (Princeton Instruments, PI-MAX4 1024f). Since the light collected onto the slit is a one-dimensional image of the signal emitted from the centre of the flame, the iCCD image comprises spectral resolution along the horizontal axis and spatial resolution along the vertical axis.
3. Results and discussion
3.1. Study of atomic hydrogen
The experiments were conducted after the PAC system had reached the steady-state regime, during which the thermal and chemical properties of the system remain stable with continuous energy deposition by NRP discharges. The minimum time from initiating the discharge to reach the steady-state regime was determined to be 50 ms in our experiments.
The temporal evolution of H and O-atom fluorescence in the temporal vicinity of the discharge occurrence was studied using the 1D spectral imaging system described in the previous section. Figure 2 shows the spatially and spectrally resolved fs-TALIF signal of H atoms, recorded at the time of maximum plasma luminescence intensity for two different cases, namely off-resonant laser excitation with a wavelength of 207 nm (a), and resonant laser excitation at 205 nm (b). Both panels exhibit a broadband spectral continuum covering essentially the entire spectral range from 646 to 665 nm. This broadband emission is the plasma luminescence instead of laser-induced fluorescence. From a comparison with a simulation in PGOPHER [15] it can be concluded that the observed plasma luminescence is mainly N2 fluorescence in the B3Πg–A3Σu + band. The signal ranging from 650 to 655 nm is the v' = 7 → v'' = 4 band and the signal in the range 657–663 nm is the v' = 6 → v'' = 3 band [7, 8]. In addition to the broadband signal, figure 2(a) also exhibit a signal around 656 nm present at a vertical position of ∼3 mm, corresponding to the location of the flame tip. This signal corresponds to the Balmer-α line (3D → 2P) of H atoms [16, 17]. This signal is not observable from the flame without discharge, suggesting that the concentration of H atoms in the 3D state is negligible in the base flame and the discharge generates excited H atoms (H*) in the flame tip. Rusterholtz et al [8] observed H-atom Balmer-α fluorescence in an NRP pin-to-pin discharge in atmospheric air. In their experiment the voltage pulses had a duration of 10 ns, an amplitude of 5.7 kV, a PRF of 10 kHz, and the separation between the electrodes was 4 mm. The origin of the H atoms was attributed to electron-impact dissociation of water vapour present in the laboratory air. In the methane-air flame, the main precursors of H atoms are H2O, CH* and OH* molecules [18], which is also confirmed in our experiments. Similarly, in our case we assume that the generation of H* atoms is from electron-impact dissociation of H2O, CH* and OH* molecules via processes [19]
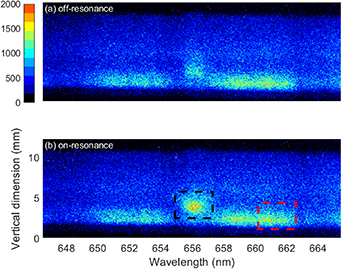
Figure 2. Spatially- and spectrally resolved emission of the flame under plasma forcing at the time when plasma luminescence is the strongest for the cases of (a) off-resonance and (b) on-resonance excitation of H atoms. Red box: plasma luminescence; black box: 656 nm emission in the flame tip. The applied voltage was 8.4 kV with PRF at 10 kHz.
Download figure:
Standard image High-resolution imageIn the electron-impact dissociation of H2O molecule, the contribution of OH* is neglected because the cross section of OH* production is about ten times less than OH in the ground state [20]. A comparison between panels (a), which corresponds to the laser wavelength tuned off-resonance, and (b), corresponding to the laser wavelength tuned on resonance, shows that the most obvious difference is that a higher signal intensity appears in the flame tip when the laser is tuned on resonance (b), while the intensity and shape of the plasma luminescence remain the same. The higher signal intensity at 656 nm in the flame tip with the laser wavelength tuned on resonance is due to the laser-induced fluorescence from the ground state H atoms present in the flame tip.
To study the temporal dynamics of the H-atom concentration, we recorded emission spectra of the flame while varying the time delay between the discharge onset and the triggering signal of the spectrometer detection. Particular focus was put on the flame tip region through which the discharge channel penetrates, and therefore the signal present from 2 to 5 mm along the vertical axis was integrated. This area is displayed in the black box in figure 2(b). Figures 3(a) and (b) show spectrally resolved signals versus the delay time. Panel (a), in figure 2, corresponds to the laser wavelength off resonance while panel (b) corresponds to the laser wavelength on the H-atom resonance. These two images are acquired at time zero which is defined as the time at which the maximum emission from the discharge is observed. With the laser tuned off resonance, the broadband luminescence signal purely originates from the discharge-induced plasma and thus it can be treated as an indicator of the evolution of the plasma. In figure 3(a) it can be seen that the plasma luminescence lasts for about 15 ns. The decay time of the plasma emission is close to that in air reported in [8]. In the present case the plasma emission decays mainly due to fast ns-timescale quenching through collisions with naturally present species, primarily the major species, i.e. N2, O2, CO2, H2O and CH4, but also with trace atoms like N and O. In addition, species created by the discharge, such as CH3, CH2, and CH also affect the quenching rate of the plasma emission, but the overall contribution of the collisional quenching is marginal. With the laser tuned on resonance, i.e. figure 3(b), it is evident that there is a distinct signal due to H-atom fluorescence during the entire investigated temporal range (about 100 ns). The H-atom signal is fairly constant throughout the whole temporal window except during the discharge period at around the time zero, where it overlaps with the plasma luminescence.
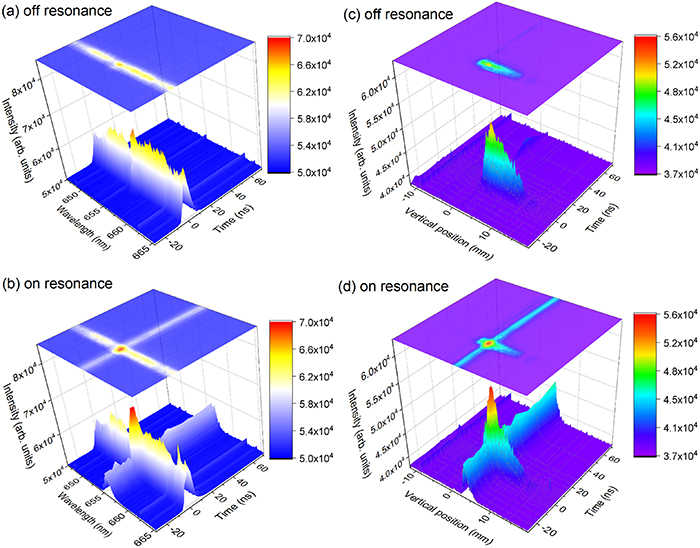
Figure 3. Spectrally- and temporally-resolved emission integrated in the flame tip (from 2 to 5 mm in vertical dimension) with laser (a) off-resonance and (b) on-resonance. (c) and (d) shows spatially- and temporally-resolved flame emission with laser off-resonance and on-resonance, respectively. The selected spectral range is about 2 nm.
Download figure:
Standard image High-resolution imageInstead of studying the fluorescence from the flame tip region spectrally resolved, the spectral resolution was sacrificed in exchange for spatial resolution. The signal in a 2 nm wide spectral region around the 656 nm wavelength, displayed in the black box in figure 2(b), was integrated while varying the delay time. The result of this study is shown in figures 3(c) and (d), where panels (c) and (d) correspond to the laser tuned off and on resonance, respectively. From this result, it is clear that the spatial range of the flame is from 2 to 6 mm. Over the temporal range investigated, the position of the flame tip keeps virtually unaltered and stable.
In order to extract the enhancement of H-atoms due to NRP discharge the signal recorded with the laser tuned off resonance was subtracted from the signal recorded with the laser tuned on resonance. The data in figure 4 shows such a subtracted signal versus delay during a discharge cycle of 100 µs. The signal remains fairly constant across the entire discharge cycle, which shows that the H concentration level remains rather constant after each individual discharge. The red dashed line corresponds to the H atom fluorescence signal recorded without discharge, i.e. it reflects the natural H atom concentration in the base flame. Comparing this fluorescence level with the black data points suggests that the H atom concentration roughly doubles when the discharge is applied. The strong signal variation around the discharge peak was probably the result of subtracting two large variables.
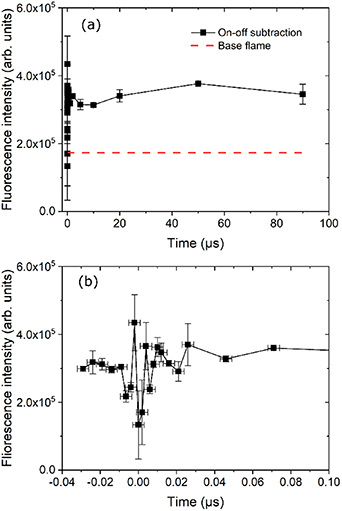
Figure 4. (a) Integrated H-atom fluorescence signal in the flame tip as a function of the time in a discharge cycle of 100 µs. (b) Zoomed time zone around zero.
Download figure:
Standard image High-resolution imageOur previous reports on temporal dynamics of H-atom production due to plasma forcing in a flame, could not resolve the first 50 ns directly after plasma discharge [14]. The spectroscopic method presented in this work, however, grants access to this temporal domain. As mentioned before, H* atoms are formed during this short period in the flame tip via electron-impact dissociation processes. The natural question is that whether H atoms in ground state are formed or not. The result in figure 4 answers the question, i.e. the amount of ground-state H atoms, produced during the 15 ns period by electron-impact dissociation, are below the detection limit of these measurements. Based on measurements in the flame without plasma forcing and chemical kinetics simulations, the detection limit could be estimated to 300 ppm of the natural occurrence of H-atoms. The increase of H atoms concentration by discharge compare to the base flame is solely a result of averaged electric energy deposited.
3.2. Study of atomic oxygen
In this section, we present and discuss the results obtained for atomic oxygen. Atomic oxygen plays an important role in the kinetics of hydrocarbon oxidation. As it can be produced in large quantities by NRP discharges, it is a key species to study to fully understand PAC. Oxygen atoms were excited from the ground state (2p3P) to the excited (3p3P) state through two-photon absorption using 226 nm fs laser pulses. The 845 nm fluorescence emitted upon relaxation to the intermediate 3s3S state was recorded [21]. Preliminary 2D fs-TALIF imaging of O-atoms recorded under same experimental conditions (10 kHz, 8.5 kV) have been reported in our previous work [22], where significant enhancement of O-atom fluorescence and thus concentration due to NRP discharge was observed. To study the temporal dynamics of this enhancement, 2D fs-TALIF images at different times within the discharge cycle of 100 μs were recorded using the same method as in [14]. A few examples are shown in figure 5. Two features can be noticed: (a) the flame shape, flame tip position, strength of O-atom fluorescence and its distribution remain basically unchanged during the cycle; (b) O-atom fluorescence appears in the discharge channel that connects the flame tip and the bottom electrode, and its lifetime lasts for approximately 4 μs.
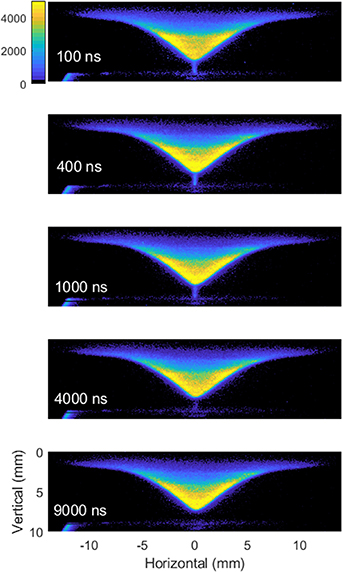
Figure 5. 2D fs-TALIF images of O-atom recorded at 100, 400, 1000, 4000 and 9000 ns after the discharge onset.
Download figure:
Standard image High-resolution imageThe temporal dynamics of O-atom fluorescence in a discharge cycle was studied using the spectroscopic method previously discussed. Figure 6(a) shows the spatially- and spectrally-resolved results of fs-TALIF of O-atoms recorded at the time when the plasma luminescence is the strongest, for two different cases, i.e. off- and on-resonant laser excitation. With laser tuned to off-resonance, a broadband plasma luminescence covering the entire 17 nm wide window is observed. Interestingly, there is no observation of 845 nm O-atom fluorescence with laser off-resonance, which is different from the case of atomic hydrogen in figure 2. These results suggest that the discharge-induced plasma significantly enhances the ground-state O-atom concentration, but the kinetic energies of the electrons are not high enough to excite the O-atoms from the ground-state to the 3p3P state. With laser on-resonance, strong 845 nm fluorescence from the O-atom group is detected.
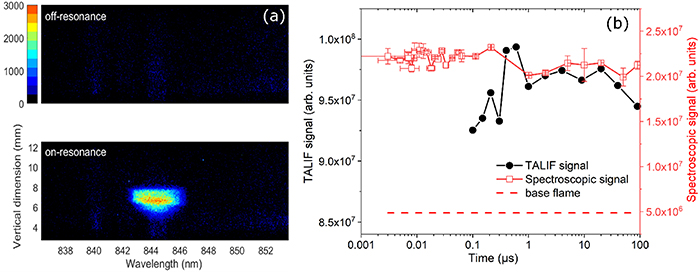
Figure 6. (a) Spatially- and spectrally resolved flame emission at the time when plasma luminescence is strongest for the cases of off-resonance (upper panel) and on-resonance laser excitation of O-atoms. The accumulation number by iCCD is 250 and the gate width is set to 4 ns. (b) O-atom fluorescence signals measured using fs-TALIF and spectroscopic methods as a function of the time within a discharge cycle of 100 μs. The red dashed line represents the fluorescence signal in the unperturbed flame.
Download figure:
Standard image High-resolution imageWithout the interference of plasma-induced O-atom 845 nm signal, the subtraction of net fluorescence enhancement becomes simpler. The subtracted signal, together with the integrated fluorescence over the full image using fs-TALIF technique, are plotted as a function of time in figure 6(b). The red dashed line represents the O-atom fluorescence signal recorded using spectroscopic technique without discharge. Comparing it with the red square data points indicates that the average O-atom concentration is quadrupled under plasma forcing. As can be seen, the results obtained by both techniques show a fairly constant signal level over the whole cycle, i.e. similar behavior as for the H-atom signal shown in figure 4. The stable behavior of the H and O-atom concentrations during a discharge cycle shows that the plasma-assisted-flame system is insensitive to individual discharge pulse forcing once a steady state has been established. Our results further validates the assumption that the steady-state plasma-assisted-flame system does not respond to each discharge pulse forcing but is only affected by the average electrical power deposited by the plasma [23, 24]. In terms of practical applications, the stability of NRP discharges is beneficial in, for example, combustion instability control [25].
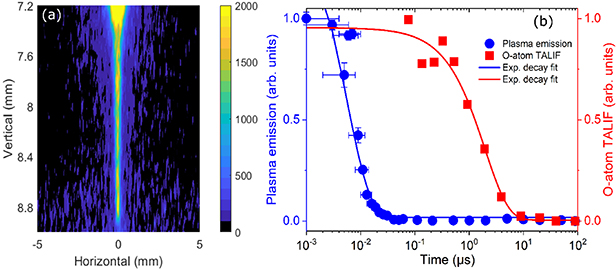
Interestingly, O-atom fluorescence can be detected in the narrow discharge channel that connects the flame tip and the bottom electrode in the fresh unburned gases. Figure 7(a) shows the detailed image of the channel recorded at 150 ns after the plasma emission peak. The channel is approximately 1.6 mm long and 0.2 mm wide. Using 2D imaging method, we studied the decay of O-atom fluorescence signal in the channel. Compared to 2D imaging method, the spectroscopic method shows a lower sensitivity and it is not capable to detect the presence of O-atom in the discharge channel. The decay of plasma emission around 845 nm wavelength in the channel was measured using the spectroscopic method, and we compare the decays of O-atom fluorescence and plasma emission in figure 7(b). One can see that O-atom is detectable within 10 μs and its concentration shows a much slower decay compared to the fast decay of plasma emission. Exponential fitting to the data suggests a decay constant of about 2.0 ± 0.3 μs whereas plasma emission shows a decay constant of only approximately 5 ns.
Figure 7. (a) 2D fs-TALIF imaging of O-atom fluorescence recorded at 150 ns after the plasma emission peak. (b) Decay of O-atom 845 nm fluorescence and plasma emission in the discharge channel in the fresh gases, separately measured by 2D TALIF imaging and spectroscopic methods.
Download figure:
Standard image High-resolution image
Note that Stancu et al reported that the O-atom density produced by NRP discharges in atmospheric air quickly builds up in a few tens of ns and then decays in about 25 μs [6, 18]. These results were obtained for 10 ns high-voltage pulses applied at 10 kHz, but the discharges were generated in pure air, preheated at 1000 K. In the present study, the conditions in the inter-electrode area are somewhat complex, with layers of cold methane-air mixture, flame, and burned gases at about 1900 K. It is expected that these very different initial conditions will induce different discharge characteristics. However, the difference in O-atom lifetime in the post discharge chemistry, for NRP discharges in air and in methane–air mixture, suggests that O-atoms reacts in a very fast manner with methane. This O-atom lifetime measured for NRP discharges in a methane–air mixture could be valuable for the validation of chemical models in PAC.
4. Summary
The temporal evolution of fs-TALIF of atomic hydrogen and oxygen in a lean methane–air flame under NPR discharge-induced plasma forcing have been investigated during a discharge cycle using the spectroscopic method. Two factors that affect reliable measurements; the waiting time for the discharge-flame system to reach the steady-state regime and the influence of broadband plasma luminescence, were studied beforehand. Under current experimental conditions, the PAC system requires 50 ms to reach steady state. Plasma luminescence that interferes with the fluorescence from H and O atoms was observed to decay completely within 15 ns, which provides the required minimum delay from the discharge occurrence for imaging measurements. We found that H atoms in the excited state are produced in this short period by electron-impact dissociation processes in the flame rather than H atoms in the ground state.
Spectrally-, spatially- and temporally-resolved H-atom fluorescence has been presented, and discussed. Similar observations also apply for O-atom measurements. 2D fs-TALIF images of O-atoms were shown together with the results obtained by the spectroscopic method, which shows obvious advantages of measurement near to discharge. From these measurements, it was found that in the steady-state regime the temporal evolution of H and O concentration remains fairly constant between two consecutive discharges. In addition, the decay time of O-atom in the discharge channel generated in the fresh mixture is approximately 2 μs. It suggests that O-atom reacts with methane in a faster manner compared to to the condition of atmospheric air, which could be useful for post-discharge chemistry studies in PAC.
Acknowledgments
This research work was sponsored by the National Science Foundation for Young Scientists of China (Grant No. 12004147), the King Abdullah University of Science and Technology (KAUST), the Knut and Alice Wallenberg Foundation, the European Research Council (ERC) through the advanced grant TUCLA (No. 669466), the starting grant LAPLAS (No. 852394), the Swedish Research Council (VR), the Swedish Foundation for Strategic Research (SSF, ITM17-0309), and the Swedish Energy Agency through the Centre for Combustion Science and Technology (CECOST).
Data availability statement
The data that support the findings of this study are available upon reasonable request from the authors.