
Abstract
A two-camera fluorescence system for indocyanine green (ICG) signal detection has been developed and tested in a clinical feasibility trial of ten patients, with a resolution in the submillimetre scale. Immediately after systemic ICG injection, the two-camera system can detect ICG signals in vivo (∼2.5 mg  or 3.2 ×
  M). Qualitative assessment has shown that the fluorescence signal does not always correlate with the cancer location in the surgical scene. Conversely, fluorescence image texture metrics when used with the logistic regression model yields good accuracy scores in detecting cancer. We have demonstrated that intraoperative fluorescence imaging for resection guidance is a feasible solution to tackle the current challenge of positive resection margins in breast conserving surgery.
Export citation and abstract BibTeX RIS

Original content from this work may be used under the terms of the Creative Commons Attribution 4.0 license. Any further distribution of this work must maintain attribution to the author(s) and the title of the work, journal citation and DOI.
1. Introduction
1.1. The unmet challenge in breast conserving surgery
Breast cancer is the most prevalent cancer among the female population worldwide [1]. The preferred surgical intervention in the majority of women with small unifocal tumours is breast-conserving surgery (BCS), which when combined with radiotherapy provides equivalent cancer treatment outcomes when compared to mastectomy (removal of the entire breast) [1]. Compared to mastectomy, BCS is a less traumatic surgery, associated with fewer complications, quicker recovery time, as well as improved cosmetic outcome [2].
BCS entails resecting the tumour en bloc, inclusive of a layer of normal tissue (a.k.a. 'the margin'). However, if the post-operational histopathology reveals positive resection margins, which occurs if the excised specimen's margins contain malignancy, re-operation may be indicated. Cancer recurrence has been shown to correlate with positive margins, as without further surgery to resect the remaining tumour burden, local control of the disease is not achieved [3]. However, reoperation comes with a cost for both the patient and the healthcare system. It has been associated with additional physiological and psychological distress, poor cosmesis, risks post-operative complications (e.g. surgical site infection) and the need for increased human and financial resources [4]. Therefore, it is crucial to improve the intraoperative assessment of resection margins to better guide the index surgery towards decreasing re-operation rates, which are reported to be as high as 27% in the UK [5] and 21.6% in the USA [6].
1.2. Fluorescence guided surgery
Despite the plethora of available methods for tumour guidance and intraoperative margin assessment, re-operation remains an unresolved challenge [7]. To date, there is no clinically accepted technology capable of providing the surgeon with real-time intraoperative visual feedback on tumour location, size, and invasiveness. However, fluorescence guided surgery is a promising contender in tackling the existing challenge of high BCS re-operation rates. Fluorescence imaging involves the use of a clinically approved contrast agent (fluorophore), often given via injection. Most of the available agents are considered safe and have minimal side effects [8]. Upon excitation of this agent with non-ionising illumination, the fluorescence is captured with the use of ergonomic and user-friendly camera equipment [9]. The fluorescent signal is then processed and displayed so that the surgeon can infer whether further resection is required and if so, where. Fluorescence guided surgery is capable of yielding good cancer sensitivity scores [10] and has the potential for quantitative outcomes [11].
1.2.1. Previous work and contribution.
Fluorescence imaging has previously been evaluated in vivo for breast tumour identification, breast reconstruction and sentinel lymph node (SLN) biopsy. Clinically-available contrast agents such as indocyanine green (ICG) and methylene blue are considered passive in their targeting [8]. Many novel specific targeting agents are being developed, however these are not yet commercially available. The majority of the aforementioned clinical work concerns passive targeting fluorophores and uses fluorescence image pixel values to classify tumour tissue. Passive fluorophores are thought to accumulate within cancerous tissue due to the enhanced permeability and retention (EPR) effect [12], whereby the contrast agent extravasates due to the porous nature of blood vessels within tumours and accumulates due to compromised lymph drainage. In addition to the EPR effect, other factors which have been proposed to increase contrast include tumour neo- and hyper-vascularity, tumour cell density and proliferation [13].
Given the existing uncertainty about the underlying mechanism of contrast in fluorescence image pixel values as well as the low specificity scores of this solution, reported across the current literature [14, 15] an alternative method exploiting fluorescence image texture metrics has been proposed [16].
To provide an optimal design of the fluorescence imaging device aimed at application in BCS, it is important to study the absorption and fluorescence ICG properties in the breast tissues. After intravenous injection, the majority of ICG binds to blood plasma proteins [17] and the absorption properties for this state were studied by Landsman et al [18]. Absorption spectral shape, number and position of the maximum depends on concentration, environment, solvent etc. For low ICG concentration, the absorption maximum was reported to be in the range of 800–805 nm. However, as ICG has a tendency to form aggregates, investigation of fluorescence excitation spectra helps to determine the optimal choice of excitation wavelength.
In this work a compact two-camera system for real-time acquisition of both ICG fluorescence and colour images has been developed and used for fast intraoperative data collection in BCS. As part of the preliminary work we recorded fluorescence excitation spectra in bovine plasma. Fluorescence texture metrics reflect tumour vasculature architecture which is different from healthy tissues due to the fast tumour growth [12], thus could yield high detection accuracy. We explore further the detection accuracy of texture metrics in the context of intraoperative tumour resection guidance during BCS, using ICG as a contrast agent for tissue structure visualisation.
2. Methodology
2.1. Camera system development
Both the hardware and software have been iteratively developed in collaboration with the clinical team. The hardware encompasses a filtered Xenon light source (Asahi Spectra Max-303, Asahi SpectraCo., Ltd, Tokyo, Japan) for surgical field illumination via a flexible fibre optic illuminating ring (Mini Annular Ringlight MA3172, Vision Light Tech B.V., Protonenlaan, Netherlands) and a two-camera setup that captures colour (FLIR Grasshoper3 GS3-U3-28S5C-C, FLIR Systems, Inc., Wilsonville, OR, USA) and monochrome (FLIR Grasshoper3 GS3-U3-28S5M-C, FLIR Systems, Inc., Wilsonville, OR, USA) images simultaneously. Both cameras have 2/3'' CMOS sensors with a resolution of 1920 × 1440 pixels. The light path was divided into two branches corresponding to the two cameras, using a 50:50 beam-splitter (CCM1-BS013/M, Thorlabs, Inc., Newton, NJ, USA). For ICG fluorescence excitation, a bandpass filter 500–750 nm (combination of 500 nm long-pass and 750 nm short-pass) was used (TECHSPEC OD4, Edmund Optics, Inc., Barrington, NJ USA). For the fluorescence emission, a bandpass filter (825 nm central wavelength, 50 nm FWHM, Edmund Optics, Inc., Barrington NJ, USA) was installed in front of the monochrome camera. A 35 mm SLR camera photographic lens with variable focal length 28–70 mm (Sigma Co, Japan) was used for focusing and imaging. The user interface for setting up an acquisition and visualisation was developed in LabVIEW™ software. A schematic diagram explaining principal functions of the device and its use in the operating theatre for the experiment is shown in figure 1.
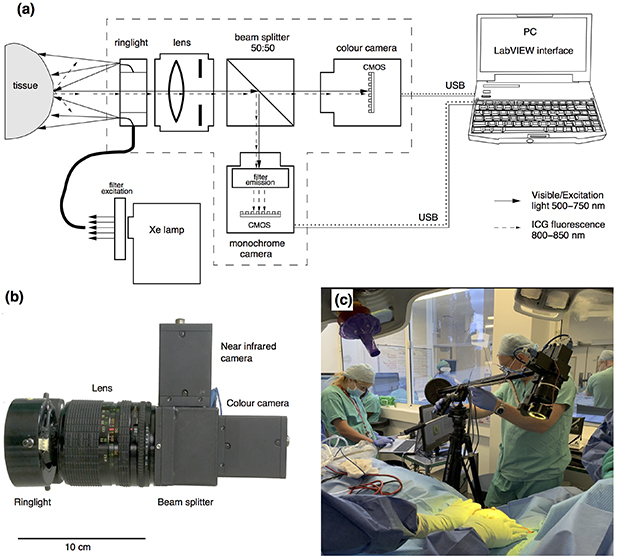
Figure 1. Device for simultaneous intraoperative registration of colour and ICG fluorescence images. (A) Schematic diagram of the system. (B) Picture of the two-camera system. (C) Use of clinical set-up for intraoperative data acquisition upon ICG injection in the operation theatre. (Trial ID: 01 of round:02, REC 19/LO/0927.)
Download figure:
Standard image High-resolution image2.2. Clinical trial
The system described above has been tested during BCS in a 6 month clinical feasibility trial (research ethics committee, REC 18/LO/2018). Overall, ten patients provided informed consent and were recruited with a mean age of 56 (range 15–70) years, and a mean body mass index of 24.2 (range 19.2–30.2). Eight of the patients had invasive ductal carcinoma, and of those, five had concomitant ductal carcinoma in situ, one had invasive lobular carcinoma with concomitant DCIS, and one had invasive mucinous carcinoma. Receptor status was 90% ER-positive, 70% PR-positive and 10% Her2-positive.
Patients were injected with 12.5 mg of ICG (Verdye, Diagnostic Green GmbH, Otto-Hahn-Str. 20, 85609 Aschheim-Dornach Germany) intravenously, once the skin flaps had been raised to expose the tumour. The excised tumour specimens were imaged from six projections: anterior, posterior, superior, inferior, medial and lateral. At least three images for each projection were acquired to decrease the probability of blurring due to motion. The sample surface was perpendicular to the optical axis to reduce the image distortion due to sample surface curvature. Image sequences were acquired of the tumour in situ, the resected tumour, any resected SLNs, and the surgical cavity post-resection. The excised tumour specimen was also imaged using the gold standard 'FaxitronTM OR Specimen Radiography' system (Hologic, Marlborough, USA) for intraoperative evaluation by the operating surgeon. These high-resolution images using ionising radiation (similar to preoperative mammography) enable rapid assessment of tissue density, as cancer and precancerous conditions are more dense than normal breast tissue. These images are formally reported by radiologists postoperatively. All specimens were sent for formal histopathology for the final identification of specimen margin status. Histopathology results served as the gold standard for the evaluation of the classification models used. A summary of the workflow is presented as a schematic overview in figure 2.

Figure 2. Summary of the clinical workflow and image processing.
Download figure:
Standard image High-resolution image2.3. In vitro and ex vivo ICG spectroscopy
ICG emission and absorption spectra, together with breast autofluorescence spectra, were needed to optimise the imaging setup, especially the combination of fluorescence excitation and emission filters. Spectral acquisition of fluorescence emission and excitation spectra in bovine plasma was obtained via a laboratory spectrofluorometer (Fluorolog-3, model FL-21 HORIBA Instruments Inc., Edison, NJ USA). ICG was prepared by dilution in distilled water according to the manufacturer's instructions. It was then diluted in reconstituted bovine plasma (P4639, Sigma-Aldrich Co. LLC, USA) down to a concentration of 2.5 mg  or 3.23 ×
  M. This is the expected in vivo ICG concentration in blood, assuming that patients are injected with 12.5 mg of ICG, that the total blood volume for an average adult is 5 l and that the ICG molar mass is 774.96 g
  . We recorded fluorescence excitation spectra in the range of 400–820 nm of three samples of ICG in bovine plasma, with the emission maximum at 840 nm.
ICG fluorescence spectra in breast samples ex vivo were recorded using a compact spectrometer (Flame, Ocean Optics Inc. Rochester, NY, USA) with fitted 800–850 nm bandpass filter (Edmund Optics, Inc., Barrington NJ, USA). The illumination source was identical to that for intraoperative imaging. Thirty spectra of connective tissues, fat and tumour from a freshly excised specimen from one patient were collected after angiographic phase ICG administration at a dose of 0.25 (mg kg−1). An example is presented in figure 4(b) of section 3.1.
Breast tissue autofluorescence was recorded using a compact spectrometer (USB4000, Ocean Optics Inc.) with a 425 nm long-pass filter installed (Edmund Optics). For excitation we applied a home-built setup with 405 nm laser diode (DL5146-101 S, Thorlabs Inc., NJ, USA) and autofluorescence was collected using a bifurcated Y-shaped fibre optic probe (LEONI Fiber Optics GmbH, Germany). Twenty spectra were collected from connective tissues, fat and tumour of freshly excised breast cancer specimen and lymph nodes. Normalised typical spectra, collected from three separate macroscopically normal sites of the specimen, are presented in figure 4(b).
2.4. Data processing
The raw fluorescence images were processed using image texture metrics as predictors for the classification models to allow a comprehensive investigation of tumour classification accuracy. The results from this image texture-based classification were evaluated for their accuracy with the use of the receiver operating characteristic (ROC) analysis. Raw fluorescence signal intensity overlays on the colour images of the surgical scene were also used for qualitative comparison with the image texture classification results and ground truth data. All image processing was implemented in Matlab software (Mathworks, Inc., Massachusetts, USA) and a summary of the image processing steps is presented in figure 2.
2.4.1. Extraction of ground truth.
To train and evaluate the classification models and overlays, ground truth data indicating tumour and healthy tissue locations were required. This ground truth was derived from the histopathology results after identification of the specimen locations in the fluorescence images. This procedure was aided by the comparison between the specimen fluorescence images and the intraoperative specimen radiography images, which provided an anterior–posterior view of the specimen in its entirety. In the example in figure 3(A), the tip of the wire indicates the location of the tumour core while the double and triple staples indicate the superior and lateral aspects of the specimen, respectively. The corresponding histopathology results for this case determined that the tumour was 1 mm from the posterior margin, 3 mm from the anterior margin and more than 5 mm from the remaining superior, inferior, medial and lateral margins. Therefore, the tumour location (red contour, figure 3(D)), as well as the healthy tissue (green marks, figure 3(D)), were only marked in the fluorescence and colour images of the posterior side of the specimen—as the tumour was considered too deep (3 mm) on the anterior side. For the same reason cases 3–6 and 10 were excluded from this analysis since the cancer was too deep for NIR detection.
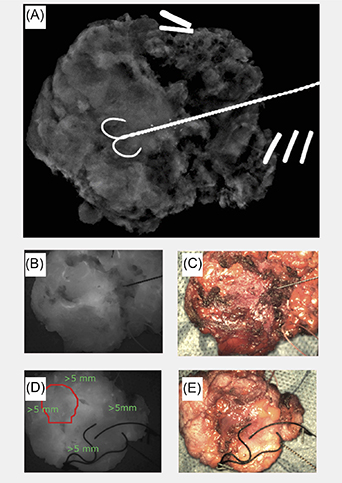
Figure 3. (A) Specimen radiography in the anterior–posterior projection of the tumour ex vivo. (B) Fluorescence image of the anterior aspect of the tumour ex vivo. (C) Colour image of the anterior aspect of the tumour ex vivo. (D) Fluorescence image of the posterior aspect of the tumour ex vivo with the tumour location indicated in the red circle. (E) Colour image of the posterior aspect of the tumour ex vivo. (Trial ID: 09, REC 18/LO/2018.)
Download figure:
Standard image High-resolution image2.4.2. Texture metrics.
The extracted texture metrics used for classification, based on previous literature [16], are the following:
- (a)Euler number (image feature connectivity)
- (b)Fractal dimension (image feature self-similarity)
- (c)Slope and intercept of the linear fit of the power spectral density (PSD) curves (relative amplitude of image spatial frequencies).
These metrics have been extracted from square-shaped patches [16] for both the identified (ground truth) and unidentified parts of the image. This procedure was repeated for different sized square patches varying from 32 to 64 pixel edge length with an increment of 8, to partially account for the physical size of the corresponding real area varying between experiments (table 1). This range has been chosen since a pixel edge length <32 would result in a high number of samples, thus in a computation intensive task, while a pixel edge length >64 would yield larger patches than the ground truth tumour region.
Table 1. The corresponding real dimensions of the square-shaped patch in mm for all the cases included in the texture metrics analysis (rows) and for all the different square-shaped patch dimensions in pixels (columns).
| Case ID | 1 Pxl | 32 Pxls | 40 Pxls | 48 Pxls | 56 Pxls | 64 Pxls |
|---|---|---|---|---|---|---|
| 1 | 0.033 | 1.05 | 1.31 | 1.57 | 1.83 | 2.09 |
| 2 | 0.052 | 1.65 | 2.07 | 2.48 | 2.89 | 3.30 |
| 7 | 0.028 | 0.89 | 1.12 | 1.34 | 1.56 | 1.79 |
| 8 | 0.050 | 1.61 | 2.01 | 2.41 | 2.81 | 3.21 |
| 9 | 0.054 | 1.72 | 2.15 | 2.58 | 3.01 | 3.44 |
To investigate whether the tumour vascular architecture is different from that in the healthy tissue, the Whitney U test was implemented with the Matlab function 'ranksum'.
Subsequently, both logistic regression (Matlab function 'fitglm') and support vector machine (Matlab function 'fitcsvm') classification models were employed for tissue classification, using as predictors the texture metrics extracted from the image patches. The accuracy, using the area under the curve (AUC), and the optimal operating point (classification threshold) were evaluated with the use of the ROC curves. The optimal classification threshold noted in table 3 as 'threshold' was the classification model score used to decide whether an observation is cancer or not. When comparing this decision with the ground truth classification derived from the histopathology report, a single value of true positive rate (TPR) and false positive rate (FPR) was found per classification model. These values were points lying on the ROC curve as noted in table 3 as Opx and Opy, respectively. For each classification model, the ROC curve is the plot of TPR versus FPR when varying the classification threshold and the area under the ROC curve is the overall accuracy of the model. The trained models were used to predict the tissue class in unknown parts of the image. This procedure was repeated twice. Firstly, for a patient-wise approach which we refer to as 'case-wise' analysis. In this analysis, the model training and testing were implemented with texture metrics extracted from a single clinical case. The second approach was leave-one-out cross-validation, which we call throughout this work as 'cross-validation' analysis. In this case, the training was implemented on all clinical cases apart from the one being tested.
The final prediction scores for each of the square image patches were displayed as a green overlay map on the visible surgical scene. A global threshold suppression was identified per image and the prediction scores were converted to a green pseudo-colour map transparency scale.
3. Results
3.1. Breast tissue ICG spectroscopy in vitro and ex vivo
We recorded fluorescence excitation spectra of three ICG samples in bovine plasma with a concentration 2.5 mg  (3.2 ×
  M). A normalised and filtered excitation spectrum is presented in figure 4(A) (spectral intensity variance was of the order of several per cent, accepted as negligible, not shown) alongside a normalised absorption spectrum of ICG in plasma in concentration 6.5 ×
  M (5 mg
  ) adapted from Landsman et al [18]. Figure 4(B) presents a typical normalised ICG spectrum in plasma in vitro and an example ICG spectrum from a freshly excised breast specimen ex vivo showing a maximum at 814 nm. Certain ICG spectra from fat and connective tissues demonstrated variability of the maximum position in the range 815–820 nm (not shown for clarity). Breast autofluorescence spectra are also presented for 405 nm excitation.
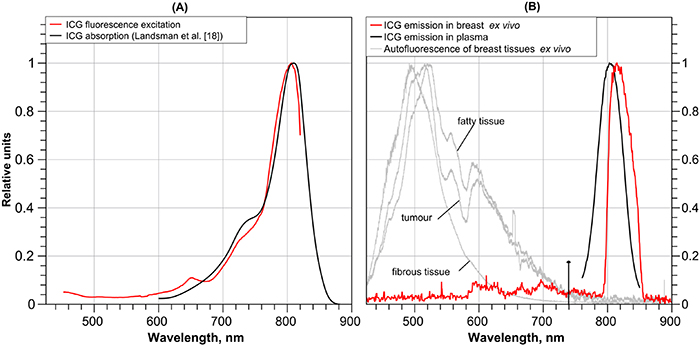
Figure 4. (A) Normalised absorption [18] and fluorescence excitation spectra for ICG in bovine plasma. (B) Normalised ICG fluorescence (red, the spectral shape is distorted due to use of passband filter 800–850 nm) and examples of breast tissue autofluorescence at 405 nm excitation (grey) in the freshly excised breast specimens, and ICG emission in bovine plasma (black).
Download figure:
Standard image High-resolution image3.2. Assessing device sensitivity and resolution
The NIR system resolution was estimated using a USAF 1951 resolution test target (Thorlabs Inc. Newton, NJ, USA). With a field of view of 6.3 × 8.5 cm at 40 cm working distance the device resolution is seven line pairs per mm. Thus, the device is potentially capable of recording features at sub-mm scale as demonstrated in figure 5.

Figure 5. (A) Raw fluorescence image of ex vivo specimen upon 12.5 mg ICG injection, (B) expanded raw image (indicated by red box in A) where arrows point to distinguished blood vessels as small as 0.2–0.3 mm in diameter and (C) complex quasi-fractal blood vessels highlighted in green with details at sub-mm scale (example-vessels branch inside dashed circle with diameter 1 mm).
Download figure:
Standard image High-resolution imageThe in vitro system sensitivity has previously been shown to reach concentrations down to the nanomolar scale using aqueous ICG solutions. The intraoperative raw fluorescence images of the tumour in vivo further show that the system is sufficiently sensitive for in vivo ICG detection, as shown in figure 6 and supplementary video 1 (available online at stacks.iop.org/JPD/54/194005/mmedia). Specifically, at a working distance of 10 cm (the minimal acceptable safe distance in the operating theatre), an in vitro concentration of 40 ×  M (0.14 mg
  ), was the lowest detected, considering as a threshold a signal to background ratio of 3.28 [19]. Thus this setup was able to detect ICG down to a concentration that is approximately 20 times lower than that expected in blood. Apart from the images of the tumour in vivo in figure 6, overlaid images of the fluorescence ex vivo are presented in figure 7. Both of the figures show the overlay of the green colour map extracted from the raw fluorescence image pixel values for qualitative comparison with the image texture classification results and cancer ground truth as described in section 2.4.

Figure 6. The raw fluorescence signal (A), (D), and (G), colour (B), (E), and (H) and fluorescence augmented images (C), (F), and (I) of the tumour in vivo upon intravenous injection of ICG (Trial ID: 09, REC 18/LO/2018). Three progressive time points are presented (from top to bottom): 00:53, 01:50, 02:08 min after the injection. Field of view: 40 × 54 mm.
Download figure:
Standard image High-resolution image
Figure 7. Raw fluorescence image (A), (C), (E), and (G) and fluorescence augmented image (B), (D), (F), and (H) with a varying suppression threshold of the tumour ex vivo (Trial ID: 09, REC 18/LO/2018). Both anterior (top two) and posterior (bottom two) specimen sides are shown. Field of view: 56 × 75 mm.
Download figure:
Standard image High-resolution image3.3. Image texture metrics, accuracy and overlays
The results of Whitney U tests upon 'case-wise' analysis are highlighted in table 2 for the cases where extraction of cancer ground truth was feasible.
Table 2. Results of Whitney U test (per case and texture metric) for cancer versus healthy image regions at 5% significance level (p < 0.05 values indicated with bold font). The sample pixel edge length was 64.
| Case ID | Euler | Fractal dimension | Slope | Intercept |
|---|---|---|---|---|
| 1 | 0.09 | 0.00 | 0.01 | 0.01 |
| 2 | 0.37 | 0.15 | 0.46 | 0.46 |
| 7 | 0.85 | 0.56 | 0.00 | 0.00 |
| 8 anterior | 0.58 | 0.47 | 0.01 | 0.01 |
| 8 posterior | 0.27 | 0.36 | 0.16 | 0.14 |
| 9 | 0.77 | 0.47 | 0.00 | 0.00 |
p-Values showed a similar trend irrespective of the side length of the sampled squares and only the 64-pixel results are presented in the main paper with full results in table 1S of the supplementary material. In most of the cases, the slope and intercept of linear fit of PSD curves were significantly different between cancer and healthy tissue. When p < 0.05 (in bold) we conclude that there is a significant difference between cancer and healthy samples.
Table 3 presents the ROC analysis results for the different combinations of classification models and predictors. The results were found to be independent of the size of the square-shaped patch and only the results for the side length of 64 pixels are presented in this section since this outperformed the others in most cases. Moreover, both the 'case-wise' and the 'cross-validation' approach are depicted for comparison. As an example of the ROC data, the curve for the 9th case is presented in figure 8 for the logistic regression model and 'case-wise' analysis.
Table 3. AUCs of the ROC analysis in the 'case-wise' and 'cross-validation' analysis. Opx and Opy are respectively the false positive and the true positive rates at the optimal operating point, and the threshold is the corresponding score used for binary classification. An AUC > 0.7 is considered a good classification accuracy and indicated with bold font. Worse than random classification (AUC < 0.5) is indicated with an asterisk, although the model prediction could be reversed [20].
| Image primitives | Power spectral curves | |||||||
|---|---|---|---|---|---|---|---|---|
| Case ID | AUC | Opx | Opy | Threshold | AUC | Opx | Opy | Threshold |
| Case-wise analysis with the logistic regression model | ||||||||
| 1 | 0.87 | 0 | 0.17 | 0.55 | 0.84 | 0 | 0.17 | 0.38 |
| 2 | 0.88 | 0.13 | 1 | 0.47 | 0.59 | 0 | 0 | 0.51 |
| 7 | 0.59 | 0 | 0 | 0.28 | 1 | 0 | 1 | 1 |
| 8 anterior | 0.58 | 0.83 | 1 | 0.67 | 0.88 | 0.83 | 1 | 0.26 |
| 8 posterior | 0.65 | 0.5 | 0.91 | 0.77 | 0.65 | 0.5 | 1 | 0.66 |
| 9 | 0.83 | 0 | 0.5 | 0.72 | 1 | 0 | 1 | 1 |
| Case-wise analysis with the support vector machine model | ||||||||
| 1 | 0.55 | 0.79 | 0.94 | 0.49 | 0.72 | 0.22 | 0.65 | 0.60 |
| 2 | 0.45* | 0 | 0 | 0.43 | 0.45* | 0 | 0 | 0.43 |
| 7 | 0.64 | 0.46 | 0.73 | 0.48 | 0.66 | 0.26 | 0.60 | 0.53 |
| 8 anterior | 0.52 | 0 | 0 | 0.40 | 0.38* | 0 | 0 | 0.33 |
| 8 posterior | 0.64 | 0.16 | 0.31 | 0.34 | 0.26* | 0 | 0 | 0.36 |
| 9 | 0.44* | 0 | 0 | 0.46 | 0.65 | 0 | 0 | 0.43 |
| Cross-validation analysis with the logistic regression model | ||||||||
| 1 | 0.70 | 0 | 0.33 | 0.65 | 0.5 | 0 | 0 | 2E-16 |
| 2 | 0.78 | 0.25 | 1.00 | 0.21 | 0.5 | 0 | 0 | 1 |
| 7 | 0.54 | 0 | 0.00 | 0.78 | 0.5 | 0 | 0 | 1 |
| 8 anterior | 0.32* | 1 | 1.00 | 0.15 | 0.5 | 1 | 1 | 1 |
| 8 posterior | 0.32* | 1 | 1.00 | 0.15 | 0.5 | 1 | 1 | 1 |
| 9 | 0.55 | 0 | 0.00 | 0.54 | 0.5 | 0 | 0 | 1 |
| Cross-validation analysis with the support vector machine model | ||||||||
| 1 | 0.52 | 0 | 0 | 1 | 0.5 | 0 | 0 | 1 |
| 2 | 0.50 | 0 | 0 | 0 | 0.5 | 0 | 0 | 0 |
| 7 | 0.56 | 0 | 0 | 1 | 0.5 | 0 | 0 | 1 |
| 8 anterior | 0.50 | 1 | 1 | 0 | 0.5 | 1 | 1 | 0 |
| 8 posterior | 0.50 | 1 | 1 | 0 | 0.5 | 1 | 1 | 1 |
| 9 | 0.50 | 0 | 0 | 0 | 0.5 | 0 | 0 | 1 |
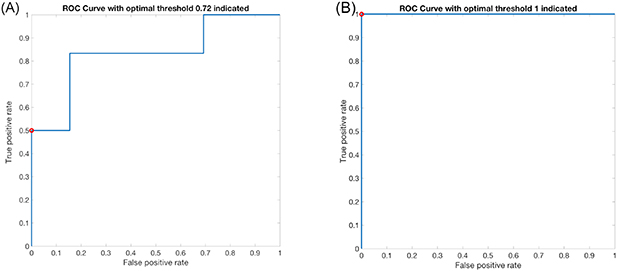
Figure 8. ROC curve when the logistic regression model was applied with model predictors: (A) the image primitives (Euler number and fractal dimension) with an AUC of 0.83 and an optimal operating point at (0, 0.5) for classification threshold 0.72, indicated by the red circle. (B) The PSD parameters (linear fit slope and intercept). The AUC is 1 while the optimal operating point (0, 1) for classification threshold of 1 indicated with the red circle. (Trial ID: 09, REC 18/LO/2018.)
Download figure:
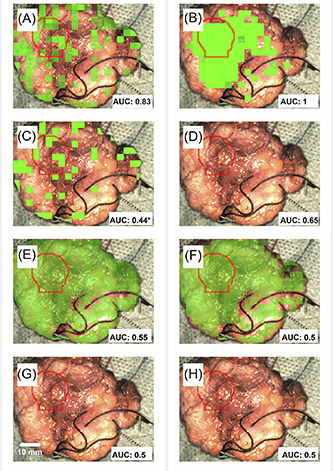
Standard image High-resolution imageThe prediction scores calculated with the use of the trained models described in section 2.4.2 are displayed as green overlay maps on the corresponding colour image of the field of view in figure 9. The example is case ID: 09 to match figure 7.
Figure 9. The final green overlay result for the 'case-wise' analysis (A)–(D) and for the 'cross-validation' analysis (E)–(H) for the logistic regression model (A), (B) and (E), (F) or the SVM model (C), (D) and (G), (H). Image primitives have been used for predictors in the left column and PSD slope and intercept in the right column. The ground truth location of tumour, derived from the histopathology report, is indicated with a red circle to ease comparison with the overlay result. The AUCs from table 3 are given in the bottom right corner of each image. Field of view: 56 × 75 mm.
Download figure:
Standard image High-resolution image
4. Discussion
4.1. In vitro and breast tissue ex vivo ICG spectroscopy
There is good similarity between the excitation and normalised absorption spectral shapes in figure 4(A). The excitation maximum is at 806 nm, while the absorption peak is shifted toward a slightly longer wavelength of 810 nm. Some spectral shape differences are observed between 700 and 750 nm and the fluorescence excitation efficiency is lower for this region than the absorption spectra, but the difference is not dramatic. This similarity between absorption and excitation spectra justifies the use of the band 700–750 nm for ICG fluorescence excitation in plasma.
Regarding figure 4(B), the maximum of ICG emission in plasma excited at 720 nm is observed at 804 nm. It is shifted toward shorter wavelength compared to ICG emission maximum in plasma in vitro (820 nm), reported by Ruiz et al [21]. One possible reason for this difference could be the ICG concentration. The observed ICG emission maximum in vivo correlates with results reported by Haj-Hosseini et al [22] for freshly excised lymph nodes, namely maxima were in the range around 820 nm, although in some cases the maximum was in the range 850–860 nm. The observed emission maxima shift, perhaps, could be explained by ICG redistribution between serum proteins and the surface components or within the vascular endothelium [23].
To estimate how tissue autofluorescence could potentially affect ICG fluorescence we performed autofluorescence measurements at 405 nm excitation. Tissue autofluorescence could affect the contrast in the fluorescence images. This suggested that the autofluorescence excited by the short wavelength end of the Xe lamp would mostly be observed in the range 425–750 nm, but in the case of weak ICG fluorescence signal the autofluorescence could potentially interfere in the 800–850 nm range. To avoid such artefacts, we limited the excitation/visualisation broadband light bandpass range to 500–750 nm.
4.2. Device sensitivity and resolution
As demonstrated in section 3.2, the system can detect ICG in vitro down to an aqueous concentration in the nanomolar range as well as in vivo during BCS. Patients were injected with 12.5 mg of ICG which corresponds to an ICG concentration in blood of 2.5 mg  (3.2 ×
  M), however, the qualitative review of the fluorescence images has shown that the fluorescence signal does not always correlate with the location of the tumour. This can be observed by comparing the ground truth cancerous tissue marked in figure 3 with the simple overlays of the fluorescence signal in figure 7. One possible explanation for this is that the in vivo and ex vivo images of the tumour were acquired immediately after the ICG injection during the angiography phase, thus not providing sufficient time for any EPR to take effect. The timing aspect of the imaging protocol requires further investigation.
Instead, in this work, we assume that the fluorescence signal may indicate the local vasculature and not necessarily the tumour. ROC analysis will be used to investigate the EPR effect using immediate and delayed ICG injection during an ongoing clinical trial of the system (REC 19/LO/0927).
4.3. Fluorescence image texture metrics
There is a significant difference in the slope and intercept of the linear fit of the PSD curves between the cancerous and normal tissue, as shown in table 2. This is not the case for the Euler or fractal dimension values (p > 0.05, with the exception of case ID: 01) in contrast with [16]. However, p-values here are extracted on a patient-wise approach whereas in [16] inter-patient bias has not been investigated due to small sample size. The above behaviour is observed independently of the dimensions of the square-shaped patch used (supplementary table 1S). In agreement with the above, the PSD-derived slope and intercept outperform the Euler and fractal dimension metrics as classification model predictors, as shown in table 3. Furthermore, the logistic regression can achieve a better classification accuracy than the SVM model across all predictors and cases, as well as for both 'case-wise' and 'cross-validation' analysis (table 3). In the optimal operating point of the logistic regression model ROC curves both sensitivity and specificity reached values as high as 100%. Recent FGS work in BCS capitalising on the ICG EPR effect has reported a sensitivity that could also reach up to 100% [14]. However, there were some false positives and lower specificity, with the highest value of 73.9% having been reported by Pop et al [15]. AUC results of 'cross-validation' may indicate that this analysis is of low classification value. However, no conclusion can be made at this point since more data are needed to train the model to account for inter-patient variation (samples from only five patients have been used here).
The classification models do not produce calibrated probability scores [20], thus a classification threshold of 0.5 may not be the optimal choice for classifying the data used in the ROC analysis. The optimal classification thresholds (table 3) were chosen by equalising the cost for false positives with the cost for false negatives and only accounting for the relative number of cancer patches in our ground truth dataset [20]. Therefore, the suggested thresholds vary from more preservative (e.g. 0.72 for case 9, logistic regression model and 'case-wise' analysis) to more liberal (e.g. 0.47 for case 2, logistic regression model and 'case-wise' analysis).
When the logistic regression model was used in combination with the PSD-derived slope and intercept model predictors and with the 'case-wise' analysis (figure 9(B)), the indication for the location of the tumour coincides with the ground truth, indicated with the red circle in figure 3(D). On the other hand, the rest of the combinations fail to yield a meaningful overlay correspondence as confirmed by the AUC results. For example, in case ID: 09 an AUC < 0.7 was observed for the 'cross-validation' analysis which justifies the absence of correspondence for the overlays. However, although the logistic regression model in combination with the image primitives predictors and the 'case-wise' analysis yields a good AUC score, the corresponding image (figure 9(A)) has no meaningful overlay correspondence. One possible explanation for this disagreement could be that the ROC analysis has been implemented only with the use of the ground truth data, whereas for the overlay creation, the model has been used for predictions over the entire image.
4.4. Study limitations
In this feasibility study 10 patients were recruited overall and more data is required to improve the statistical reliability and the training of the classification models. However, the statistical analysis can be used to calculate the required sample size of an in vivo clinical validation study (REC 19/LO/0927) to achieve a study power (probability to correctly reject the null hypothesis) of 90%. Moreover, the use of ICG NIR imaging for tumour demarcation to obtain information of tissues located under superficial layers is limited. In our case, the ideal depth of interrogation to visualize tissue structure is up to several mm. As Ruiz et al [21] demonstrated on tissue mimicking phantoms, ICG fluorescence could be detected from a depth up to 3 mm. Therefore, ex vivo samples with a tumour deeper than 3 mm could not be considered in our analysis. Surface curvature (resulting in variation in surface normal or working distance) may affect and distort the images due to length scale variations from surface orientation, limited depth of field and image aberrations. To minimise these effects, we oriented the specimens such that the surface was as flat as possible. The images acquired from the six projections partially overlapped while curvature distortions were kept low. Finally, imaging of the histopathology cut up instead of the whole excised specimen would allow for more reliable ground truth extraction. In this work, the intraoperative specimen radiography images have served as the connection between the histopathology results and the fluorescence images.
5. Conclusion
An ergonomic and patient-safe two-camera system capturing both ICG fluorescence and colour images has been developed. The system has been tested as a guidance system to optimise resection during BCS, demonstrating the feasibility of this approach. The system allows the microvasculature to be visualised from sub-mm to multi-cm scales and has been proven sensitive to the in vivo signal from an estimated ICG concentration of 2.5 mg  (3.2 ×
  M).
M).
The ICG fluorescence signal has been visualised as an overlay on top of the colour images of the surgical scene. However, the vascularity highlighted by ICG administered in the angiography phase does not accurately indicate the tumour location. As another approach, complimentary to simple fluorescence intensity signal-to-background analysis, we capitalise on ICG as a fluorescent contrast agent to visualise fine microvasculature and tissue structures. We extracted ICG fluorescence image texture metrics for the first time in a human study to improve the diagnostic accuracy.
Only the slope/intercept of the linear fit of the PSD curves were significantly different between cancer and healthy samples, whereas Euler number and fractal dimension did not show statistical significance in contrast with [16]. The ROC analysis correspondingly indicated that when logistic regression is used along with the PSD-derived slope and intercept, good accuracy can be achieved. Corresponding sensitivity and specificity scores of the logistic regression model reach values better than those currently reported across the ICG FGS literature [14, 15].
We demonstrated that combined NIR ICG fluorescence for visualisation of the micro-vascularisation and advanced image pattern analysis at sub-mm scale has a potential for use in intraoperative breast tumour border demarcation.
Acknowledgments
This paper is independent research funded by the National Institute for Health Research (NIHR) Imperial Biomedical Research Centre (BRC), the Cancer Research UK (CRUK) Imperial Centre, and the Imperial Confidence in Concept (ICiC) Joint Translational Fund (Imperial College's Medical Research Council [MRC] Confidence in Concept fund and the Engineering and Physical Sciences Research Council [EPSRC] Impact Acceleration Account scheme). The views expressed in this publication are those of the author(s) and not necessarily those of the NHS, the National Institute for Health Research or the Department of Health. Maria Leiloglou would like to acknowledge the support by the Greek Foundation for Education and European Culture (IPEP).
The authors have confirmed that any identifiable participants in this study have given their consent for publication.
Supplementary data Supplementary_Video_1.mov