

Abstract
Shock waves generated by arc plasma in supercritical (SC) CO2 have the potential to create novel reaction fields. However, there have been few studies of shock-wave characteristics in SC-CO2. This study provides the results of visualization of shock-wave propagation in SC-CO2 generated by nanosecond-pulsed arc plasma. A propagating cylindrical shock wave originating from a discharge channel was observed using time-resolved shadowgraph imaging. The shock wave separated from the cylindrical dark-region induced by pulsed arc plasma within 64 nanoseconds. The Mach numbers of the shock waves were investigated against the medium density of the CO2 ranging from a high-pressure gas phase to the SC phase. The Mach number reached a local maximum at the critical CO2 density level. The anomaly in the Mach number can be explained by the local maximum of the specific heat capacity ratio of the CO2 at close to the critical condition of SC-CO2.
Export citation and abstract BibTeX RIS
1. Introduction
The dynamics of shock waves in supercritical (SC) fluids can be optimized easily by controlling the density of these fluids by changing temperature and pressure. Shock waves in SC fluids have the potential to create new reaction fields in a wide range of applications, e.g. valuable constituent extraction [1], material synthesis [2], cleaning [3], and polymer processing [4]. In addition, elucidation of the mechanism of the shock wave helps to understand the process of material synthesis in SC fluids by plasma, e.g. metal oxide nanoparticles [5, 6], metallic nanoparticles [7–10], silicon nanoclusters [11], carbon materials [12], diamondoid [13–16], and phenol polymerization [17]. However, the formation of shock waves induced by pulsed arc plasma has never been studied in sufficient detail.
A fundamental understanding of shock-wave characteristics is not possible without considering Mach numbers. The Mach number of a shock wave is determined by pressure, density, and temperature. In this study, the propagation processes of pulsed arc-induced shock waves in high-pressure gas CO2 and SC-CO2 were observed using time-resolved shadowgraph imaging to investigate the spatiotemporal variation of Mach numbers.
2. Experimental setup
Figure 1 shows the experimental setup. Pulsed arc plasma was generated between a needle-to-plane electrode in the high-pressure chamber. The needle was made of tungsten to prevent erosion of its tip. The temperature inside the chamber was kept at 305 K. The pulsed voltage was supplied by a pulsed power generator (MPC3010S-25LP, Suematsu Denshi Co. Ltd.) with a magnetic pulse compression (MPC) circuit. This MPC circuit is described in detail in our previous study [18]. The output voltage of the pulsed power generator was boosted by a pulse transformer. Meanwhile, the secondary voltage of the pulse transformer was applied to a capacitor (100 pF) that was connected in parallel to the needle-to-plane electrode. To determine the shock-wave initiation time, the pulsed voltage and current were measured by a high-voltage probe (EP-100 K, Nissin Pulse Co, Ltd) and a current monitor (Model 6585, Pearson Electronics Inc.), respectively. The backlight source of the shadowgraph images was a Q-switched Nd:YAG laser (second-harmonic wavelength λ = 532 nm; pulse width 5 ± 2 ns), which was triggered via a delay generator (Model 9520, Quantum Composers, Inc). The images were taken by a complementary metal oxide semiconductor (CMOS) camera (D610, Nikon Co, Ltd) through a neutral-density filter placed between the chamber and the camera. The pulsed laser light (5 ± 2 ns) was recorded on the CMOS sensor while the camera shutter was open for a period of 0.5 s. Therefore, the time resolution of the images was 5 ± 2 ns.
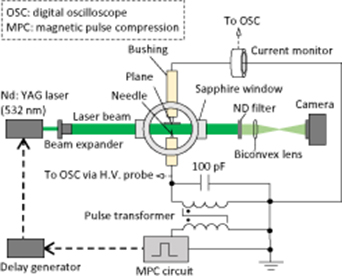
Figure 1. Schematic diagram of the shock-wave observation system using the shadowgraph method and a high-voltage pulsed power-supply system.
Download figure:
Standard image High-resolution image3. Experimental results and discussion
3.1. Voltage and current waveforms
Figure 2 shows the voltage and current waveforms in the SC phase (T = 305 K, P = 7.53 MPa). The pulsed voltage increased with the rise in the voltage rate of 0.5 kV ns−1. We previously reported that the branched streamer discharge initiates at the needle tip and develops toward the plane electrode as the applied voltage increases [19–22]. The large pulsed current suddenly began to flow when the voltage collapsed at the moment the streamer reached the plane electrode. A local thermodynamic equilibrium was established ranging from 1 ps to 1 ns [18]. Owing to the high conductivity of the arc channel, the inductance–capacitance–resistance series damped oscillation of the waveforms continued during approximately 700 ns.

Figure 2. Voltage and current waveforms while occurring the pulsed arc plasma in the SC phase (T = 305 K, P = 7.53 MPa).
Download figure:
Standard image High-resolution image3.2. Time-resolved shadowgraph images of shock wave in SC phase
The shadowgraph images were taken after the ignition of the pulsed arc discharge. The pulsed arc ignition time t = 0 was determined by the start of the pulse-arc current, as shown in figure 2. Figure 3 shows the shadowgraph images of the post-breakdown phenomena in the SC phase (T = 305 K, P = 7.50 MPa) during the period between t = 64 ns and t = 7 μs. Figures 3(b)–(f) show images from different arc discharges. The cylindrical shock wave began to propagate before t = 64 ns, as shown in figures 3(b) and (g). The delay from the ignition of the pulsed arc plasma to the separation of the shock wave was almost independent of the CO2 density. Furthermore, in figure 3(b), the residual branched streamer channels were observed with the pulsed arc plasma. The shock wave expanded together with the dark-region caused by the discharge plasma, as shown in figure 3(c). The dark-region was larger than the light emission region of the plasma, as shown in figure 3(d). The schematic diagram of figure 3(d) is shown in figure 3(h). The black portion of the shadowgraph image can be seen because the backlight did not reach the detector due to refraction. The reason for the appearance of the dark-region could be due to the extreme difference refraction index between dark-region and background (SC-CO2). The variation of the refraction index in dark-region was caused by the pulsed arc plasma; however, further investigation of the plasma parameter should be done to elucidate the detailed conditions of the dark-region in the future. The dark-region collapsed after the end of its expansion (2 μs ∼), as shown in figures 3(e) and (f).

Figure 3. resolvedTime- shadowgraph images of post-breakdown phenomena in the SC phase (T = 305 K, P = 7.50 MPa). The time resolution of the images is 5 ± 2 ns. The images visualize the light emission of the pulsed arc plasma, the dark-region caused by heating of the discharge plasma, and the cylindrical shock-wave propagation. (a) Background. (b) Beginning of the shock-wave propagation. (c)–(e) Propagation of the shock wave and expansion of the dark-region. (f) Collapse of the dark-region. (g) Magnified image of (b). (h) Sketch of the shock-wave propagation.
Download figure:
Standard image High-resolution image3.3. Characteristics of shock-wave propagation and Mach number
Figure 4 shows the characteristics of the shock-wave propagation and the expansion of the dark-region in the high-pressure gas phase (figure 4(a); T = 305 K, P = 1.59 MPa) and the SC phase (figure 4(b); T = 305 K, P = 7.53 MPa). In general, the propagation characteristics of the cylindrical shock wave generated by lightning or a spark discharge can be described by the weak shock-wave theory (1.16 < Mach number < 3) [23–27]. The overpressure (where the pressure ratio through the shock front is less than 10) and the trajectory of the shock wave can be formulated by application of the weak shock-wave theory. However, the application of this theory to pressurized CO2 is problematic because the theory assumes perfect gases at constant specific heat levels. In this study, the shock-wave propagation with respect to the time t was approximated by the quadratic polynomial approximation (equation (1)) to estimate the Mach number in the pressurized CO2.


Figure 4. Time evolution of the propagation length of the shock wave and the expansion length of the dark-region heated by the plasma channel in (a) the gas phase (T = 305 K, P = 1.59 MPa) and (b) the SC phase (T = 305 K, P = 7.53 MPa).
Download figure:
Standard image High-resolution imagewhere a, b, and c are constant, and R is the propagation length of the shock wave. Although the physical characteristics of the gas and SC phases are completely different, it was found that the quadratic polynomial approximation fits the shock-wave propagation of both gas and supercritical phases well. This agreement suggests that shock-wave propagation in both gas and SC phases is governed by the same physical mechanism. The velocity of the shock wave v was expressed by differentiating equation (1) as follows:
The Mach number for t was calculated by dividing equation (2) by the sound speed and is shown in figure 4. The ts, which is the separation time between the shock wave and the dark-region, was then assigned to t in equation (2) to determine the initial Mach number.
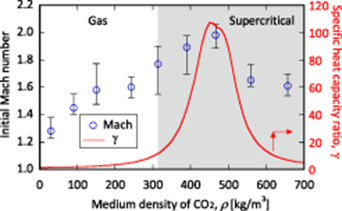
Figure 5 shows the initial Mach number as a function of CO2 density ranging from 1.59 to 8.0 MPa. The error ranges indicate the maximum and minimum values of the shot-to-shot variations. The sound speed of CO2 was calculated based on the literature [28]. The Mach number reached a local maximum (T = 305 K, P = 7.53 MPa) at close to the critical anomaly condition in the SC phase. The anomaly of the Mach number is explained by the specific heat capacity ratio γ, which is one of the physical parameters related to shock-wave propagation [23]. The γ is a dimensionless quantity. Figure 5 shows the γ reached a local maximum at critical density, which can affect shock-wave propagation. The γ of CO2 was calculated by the equation of state expressed in form of the Helmholtz energy [28].
Figure 5. Mach number of a cylindrical shock wave as a function of CO2 density (T = 305 K). The region above the density of 314 kg m−3 is the SC phase.
Download figure:
Standard image High-resolution image
4. Conclusions
The detailed research on the shock-wave anomaly is of great importance, as is with the case with the existing knowledge of the anomalous behavior of the breakdown voltage and plasma parameters near the critical point. Since there are few experimental examples of shock-wave characteristics in SC fluids, this paper has described the cylindrical shock wave propagation induced by nanosecond pulsed arc plasma and its Mach number in high-pressure CO2 including the SC phase. The Mach number reached a local maximum at close to the critical condition of CO2. The large Mach number implies the generation of the intense shock waves because the Mach number is associated with the physical properties of the shock wave, e.g. pressure, density, and temperature. Our experimental results will contribute to the clarification of the physical parameters of shock wave in the future. In addition, the shock wave will be a powerful tool for future applications of the SC fluids, e.g. material fragmentation, material synthesis, and valuable constituent extraction.
Acknowledgments
This work was supported by the Japan Society for the Promotion of Science KAKENHI Early-Career Scientists Grant Number JP19K14966.