
Abstract
ImageJ is a versatile and powerful tool for quantitative image analysis in microscopy. It is open-source software, platform-independent and enables students and researchers to obtain an easy but thorough introduction into image analysis. Especially the image processing package Fiji is a valuable and powerful extension of ImageJ. Several plugins and macros for single-molecule localization microscopy (SMLM) have been developed during the last decade. These novel tools cover the steps from single-molecule localization and image reconstruction to SMLM data postprocessing such as density analysis, image registration or resolution estimation. This article describes how ImageJ/Fiji can be used for image analysis, reviews existing extensions for SMLM, and aims at introducing and motivating novices and advanced SMLM users alike to explore the possibilities of ImageJ/Fiji for automated and quantitative data analysis.
Export citation and abstract BibTeX RIS

Original content from this work may be used under the terms of the Creative Commons Attribution 3.0 licence. Any further distribution of this work must maintain attribution to the author(s) and the title of the work, journal citation and DOI.
1. Introduction
Super-resolution microscopy has the potential to widely enhance our understanding of the structural organisation of cells [1]. Among other powerful super-resolution imaging techniques such as stimulated emission depletion (STED) microscopy [2] and structured illumination microscopy (SIM) [3], single-molecule localization microscopy (SMLM) stands out as it provides access to quantitative information [4]. The advent of photoswitches, i.e. fluorophores that can be reversibly or irreversibly transferred from a non-fluorescent to a fluorescent state, paved the way for the development of SMLM [5–10].
Common representatives of SMLM are (fluorescence) photoactivated localization microscopy (PALM/FPALM) [11, 12] and (direct) stochastic optical reconstruction microscopy (STORM/dSTORM) [13, 14], which are all based on separating single photoswitchable fluorophores in a densely labelled sample in time and localizing them with a precision much higher than the optical resolution of the imaging system. Under experimental conditions the majority of fluorophores is kept non-fluorescent while sparse subsets are stochastically transferred to their fluorescent state. An alternative version of SMLM without employing stationary photoswitches is points accumulation for imaging in nanoscale topography (PAINT) [15] and DNA-PAINT [16], which utilize fluorescent probes that are transiently bound to the structure of interest through diffusion. All of these concepts acquire image stacks over time that contain stochastic single-molecule emissions. Finally, the data is analysed and converted into a graphical representation that is no longer limited by diffraction.
Image analysis is key to SMLM. The main image processing steps consist of localizing each recorded emission of a single molecule and store it in an output file that finally contains the coordinates of thousands to millions of single molecules, followed by rendering this intermediate result into an image. Localizing a single molecule means fitting an ideal point spread function (PSF) to its recorded intensity pattern, which is often done with a 2D Gaussian function of the form

with A as amplitude, xc and y c the molecule's centre coordinates, σx and σy as standard deviation of the Gaussian in the x- and y -directions, and B as offset. The uncertainty in determining the position depends mainly on the total number of detected photons per event (N) and the standard deviation of the Gaussian (σ) and scales with σ [17].
[17].
It is worth mentioning that many analytical approaches in localization microscopy such as centre of mass approximation were already well researched in astronomy. For instance the analysis of stars in crowded fields by the program DAOPHOT [18] inspired the development of the SMLM tool DAOSTORM, in which overlapping emitters are fitted with multiple model PSFs [19] (section 3.1).
When SMLM was invented in 2006, the main task of image processing was the reconstruction of the super-resolution image. Today, the analysis just continues on the level of single-molecule coordinates after the localization step. Various analysis methods exist such as cluster analysis, image registration, intensity analysis, 3D visualization, as well as experimental precision and resolution estimation. For all these steps software is required and one would assume that for these various techniques and processing steps different software solutions are necessary. Fortunately, a powerful software platform exists now that combines many SMLM related applications in one toolkit: ImageJ.
1.1. The rise of ImageJ
The driving force in developing ImageJ was Wayne Rasband and the importance of his contribution to this platform-independent and open-source image analysis software cannot be overestimated. One of his early software products was NIH Image, an image analysis software for the Macintosh II that was released over 30 years ago [20]. This software became highly valued among Mac users, but with the personal computer becoming ever more popular, Rasband began to create ImageJ, which was written in Java and released in 1997. His vision was an open-source image analysis software that could be used on any platform independent of the operating system [20].
A key feature of ImageJ and also of its predecessor NIH Image was their extensibility. It allowed users to automate image processing steps by writing macros or to add new functionality by developing plugins. Albeit ImageJ already offered a broad range of image processing tools, this option led to the integration of an abundance of novel features and was one of the main reasons for the tremendous success of ImageJ.
ImageJ became very popular and found widespread use in different fields of science such as biology, medicine, astronomy and microscopy [21]. It has a simple but well-arranged graphical user interface (GUI) and can be directly used by non-experts for basic and advanced image processing (figure 1(a)). Today, several hundreds of plugins for ImageJ exist. Moreover, extensive tutorial material is available owing to the huge user community of ImageJ.

Figure 1. ImageJ GUI and macro programming. (a) Top: Fiji interface, bottom: script editor for programming. (b) Left: Macro GUI, right: visualized localizations within the image stack using the Fiji macro LocFileVisualizer (operation 'ShowLocalizations' or 'Import&Show').
Download figure:
Standard image High-resolution imageI first used ImageJ in an advanced physics lab course on stellar spectroscopy back in 2005. We recorded the spectra of stars with a telescope on a CCD camera and used ImageJ for the analysis. We plotted each spectrum and identified the absorption lines to allow for stellar classification. I was truly amazed about the simple interface yet powerful functionality that the software offered. When I started my PhD in 2007 in the group of Markus Sauer, I used ImageJ for several applications on image analysis, and some years later (as Fiji) it became a standard tool in our lab.
1.2. From ImageJ to Fiji
Several applications and adoptions of ImageJ were generated to satisfy the various needs of users in different fields [20]. For example, AstroImageJ can be applied for the analysis of astronomical images with an emphasis on photometry [22]. The ImageJ related software µManager can be used to control microscopy hardware [23], such as driving a variety of microscope stands, controlling laser emission and camera acquisition. It also comes with a range of tools, e.g. a localization microscopy plugin (table 1), which can be used for SMLM image reconstruction. For microscopy users, Fiji (Fiji is just ImageJ) became a valuable integration of ImageJ in biological image analysis [24]. It is a distribution of ImageJ with a huge collection of plugins and can be described as a software project. It incorporates modern software-engineering principles such as an integrated updating system, the usage of third-party libraries, and a script editor supporting various scripting languages [24]. Therewith, Fiji is suitable to the requirements of a broad range of users from biology researchers to professional software engineers. It has been used to develop analysis tools for standard fluorescence microscopy such as wide-field and confocal microscopy, but also for electron microscopy, single-plane illumination microscopy and super-resolution microscopy.
Table 1. Plugins for ImageJ/Fiji for localization and image reconstruction. HDA: high density analysis, GPU: graphics processing unit, MLE: maximum likelihood estimation, MMSE: minimum mean square error estimator, PSF: point spread function.
| Name | Description | 3D | HDA | Year | Ref. |
|---|---|---|---|---|---|
| DoM | Localization software, 3D: astigmatism, drift correction, channel alignment for correction of chromatic aberration using B-spline registration | ✓ | — | 2016 | [54] |
| GraspJ | Localization software, GPU processing, 3D: astigmatism, MLE, drift correction | ✓ | — | 2012 | [85] |
| Hawk | Preprocessing tool for high spot densities, outputs an image stack containing an increased number of frames with a reduced number of spots per frame | — | ✓ | 2018 | [51] |
| µManager LM | Plugin facilitating localization microscopy analysis for µManager with 3D capability, MLE | ✓ | — | 2014 | [86] |
| M2LE | Localization software, MLE | — | — | 2012 | [87] |
| MaLiang | Localization software, GPU processing, MLE | — | — | 2010 | [88] |
| NanoJ-SRRF |
High-density super-resolution method, GPU processing, drift correction | — | ✓ | 2016 | [52] |
| Octane | Localization software | — | — | 2014 | [89] |
| PALMER | Localization software, GPU processing | — | ✓ | 2012 | [90] |
| PeakFit | Localization software as part of the GDSC SMLM plugin collection (table 2), MLE | — | ✓ | [43] | |
| pSMLM-3D | Add-on for ThunderSTORM, implements phasor based localization algorithm | ✓ |
✓ |
2018 | [42] |
| QuickPALM | Localization software, centre of mass calculation, drift correction | ✓ | — | 2010 | [26] |
| SMLocalizer | Localization software, GPU processing, 3D: PRILM, biplane, astigmatism, double-helix; drift correction, channel alignment, cluster analysis | ✓ | — | 2018 | [91] |
| SOSplugin | Software for single-molecule tracking and localization, drift correction, cluster analysis | — | ✓ | 2014 | [92] |
| ThunderSTORM | Localization software, 3D: astigmatism and biplane; MLE, drift correction, coordinate-based co-localization | ✓ | ✓ | 2014 | [30] |
| UNLOC | Localization software for high spot densities, current version requires Matlab compiler runtime (9.2), MMSE | — | ✓ | 2018 | [50] |
| ZOLA-3D | Localization software, GPU processing, 3D: image reconstruction of phase modulated PSFs (by a deformable mirror), MLE, drift correction | ✓ | — | 2018 | [44] |
aAlthough SRRF is technically not a localization software, it can be applied on SMLM data to produce a super-resolved image. bFeature through ThunderSTORM.
In the following, I show how Fiji can be used for SMLM data analysis, how localization data can be handled using home-built macros and review available plugins for SMLM. Finally, I conclude this review with a list of recent additions to super-resolution microscopy and desirable applications for SMLM that will be potentially forthcoming in Fiji.
2. Analysing SMLM data with Fiji
The raw data in SMLM consists of a time series of images most often stored as TIF files. These files contain the emission of fluorophores on a certain background level. The first data processing step is to localize the emissions. A plethora of localization software packages have been developed over the years and several plugins for ImageJ are available (see section 3.1). In the early days image reconstruction was particularly time consuming, but already the first efforts were made to allow for real-time computation [25–27].
In general, these software packages attempt to find the centre of fluorescence emissions (hereafter called 'spots') in noisy images. This is first done in a coarse mode where rough estimates of candidate positions for further in-depth analysis are obtained. Often, this step is performed though the application of an image smoothing filter to the raw data, serving as noise reduction that facilitates finding of maxima in the image. These spot positions are then used for an approximate fit to the PSF of the microscope, usually a 2D Gaussian function applied to a finite region that contains the spot in the raw image. The obtained coordinates along with other fitting parameters are then finally stored in a text file.
Novices to SMLM can reproduce the basic steps of the localization software by using core functions in Fiji. By loading an image stack into Fiji (File ➣ Open...) a filter such as a Mean, Median or Gaussian (e.g. Process ➣ Filters ➣ Gaussian blur...) can be applied. Then the maximum finder can be used (Process ➣ Find Maxima...) to find spots above a certain noise level. With this, one can get an overview of the performance gain of individual filters. In addition the user can also investigate the background level of a SMLM raw image by defining a region of interest with the rectangle selection tool followed by a measurement (Analyze ➣ Measure). By selecting 'mean gray value' and 'standard deviation' (Analyze ➣ Set Measurements...) the measurements will return these values in Fiji's Results table together with other selected parameters.
2.1. Automated analysis and macro programming
The image processing steps described in the above example can be also automated by producing a macro. Fiji provides a macro recorder for this purpose, which once opened records each step done (Plugins ➣ Macro ➣ Record...). The macro can be simple and e.g. just contain the steps of (i) image filtering, (ii) maxima detection and (iii) measurement, applied to any selected image (figure 1(a)). But it can be also extended through the use of scripting language such as the ImageJ macro language [28]. This can be used to, for example, automate the detection of a spot and perform a measurement on an entire image stack or multiple files that are contained in a folder. Macros can also be programmed with a GUI (figure 1(b)), which allows the adaption and proper installation of parameters in Fiji.
An example for this is the visualization of single-molecule localizations within the raw image stack. This is illustrated in a macro that is provided as Supplementary Software ('LocFileVisualizer') (figure 1(b)). After loading an image stack into Fiji, the macro can be executed (as Script or after installation via Plugins ➣ Macro ➣ LocFileVisualizer). The user then selects the operation mode 'Import&Show' and the type of localization file. After confirming, a GUI appears in which visualization options and the pixel size of the raw image stack can be specified. This macro is entirely based on Fiji core functions written in ImageJ macro language. It opens a text file (the localization file) and converts it into a Results table. Then a selection (circular, rectangular or cross section) of chosen size is drawn for each localization within the image stack using the coordinates and time information of the molecule from the Results table. Importantly, different headers of localization files such as from rapidSTORM [29] and ThunderSTORM [30] are supported. This macro has been written because our in-house standalone localization software rapidSTORM did not support the graphical visualization of the localizations in the raw image. It thus helped to verify the settings in the localization software and could provide assistance for judging important issues, e.g. whether the threshold was set too high or too low or overlapping emitters were successfully sorted out by the software, or if localizations could be also made in noisy regions.
2.2. Generation of 2D and 3D SMLM images
There are multiple ways to reconstruct a super-resolution image from single-molecule coordinates such as (i) a simple scatter plot, (ii) rendering each coordinate as a Gaussian whose standard deviation is determined by the localization precision, or (iii) binning the coordinates into a histogram with a pixel size in the range of 10 nm or less. Both, Gaussian rendering and histogram are applied in the majority of localization software packages. Nieuwenhuizen et al compared five different visualization methods and reported that Gaussian rendering provides best resolution, but histogram binning achieves a similar resolution in a shorter computation time [31].
Once localization data has been obtained, basic function in Fiji can be used to visualize single-molecule localizations in two and three dimensions as demonstrated again by the macro LocFileVisualizer. Upon execution the user can select the operation 'Import&Generate' and specify the localization file as well as the desired lateral pixel size. An image is then generated as 2D histogram (figure 2) whose size is based on the desired pixel size and structural dimensions, whereas the intensity of each pixel depends on the number of localizations that are assigned to the pixel. The image can then be further processed, e.g. using a heat map for visualization (Image ➣ Lookup Table ➣ ...). Optionally, the image can be convolved with a Gaussian kernel (Process ➣ Filters ➣ Gaussian Blur...) with a standard deviation determined by the average localization precision of the experiment as recommended for histogram binning [31]. If the localization file contains also axial coordinates, the macro option 'z-stack' can be selected and the pixel size in z-direction has to be specified leading to a 3D super-resolution image stack, i.e. a series of images with defined axial sectioning (figure 2(c)). 3D stacks can also be further processed in Fiji, e.g. by rendering the image with Fiji's 3D viewer or Volume viewer (e.g. Plugins ➣ 3D Viewer) (figure 2). The macro LocFileVisualizer was developed in order to reconstruct localization files easily without running the full localization software (rapidSTORM in this case). It also allows to evaluate the optimal pixel size, which is determined by the localization precision.

Figure 2. Image visualization and rendering with Fiji using different options. (a) A localization file is imported into Fiji using the macro LocFileVisualizer and a 2D image generated. (b) Localization file imported and z-colour-coded with the plugin ZOLA. (c). A series of images with different axial range (z-stack) is generated using the macro LocFileVisualizer (operation 'Generate images' or 'Import&Generate'). (d) The z-stack is rendered in 3D using the plugin ClearVolume.
Download figure:
Standard image High-resolution imageFurthermore, the macro allows to create quantitative images in which every localization increases the associated pixel value by one. Then, the number of localizations per region or subcellular compartment can be determined using further image processing steps in Fiji. The quantitative image can be duplicated, smoothed with a Gaussian filter, and adjusted to an intensity threshold to produce a binary image (all done in Fiji). This image can then be analysed with the particle analyser (Analyze ➣ Analyze Particles...). According to their size and geometry the contours of the particles are extracted and added to Fiji's ROI manager. These region of interests (ROIs) can then be applied to the original, unmodified image where the amount of localization (density) is determined. It is possible to automate all steps again and save them as macro. This method was the foundation for the quantification of the presynaptic protein Bruchpilot in the active zone of Drosophila neuromuscular junctions [32].
The above mentioned examples are only two out of many how Fiji can be used for SMLM data visualization and analysis. Macros have the advantage to be easily adaptable through modifying the source code. Numerous additional macros are available, e.g. the package ChriSTORM that supports the translation of localization files from commercial setups and facilitates the usage of the Fiji plugin ThunderSTORM [33]. In case of more complex analysis procedures plugins form a more extensive yet more powerful option to be integrated into Fiji.
3. Plugins for SMLM
While macros automate specific tasks within Fiji, plugins add new functionality. For ImageJ and Fiji, several hundreds of plugins have been developed. In this chapter, I review available plugins that were developed for SMLM. Most of them were developed for the task of single-molecule localization, but more and more plugins focus on data postprocessing. Additionally, I also present some Fiji tools that were not exclusively designed for SMLM, but which can be advantageously applied on single-molecule data.
3.1. Single-molecule localization software
From the early days of SMLM, there was a clear focus on fluorophore engineering and manipulation, i.e. on the creation of photoactivatable and photoswitchable fluorophores [8, 34]. Consequently, the handling of large image stacks with thousands to millions of single-molecule events became imperative. Especially the advances in detector design in terms of chip size and speed led to increased data sets. So far, many localization algorithms have been developed and a detailed topical review by Small and Stahlheber is available [35]. Most research groups working on SMLM developed their own localization software and published them early on.
Today, a large number of localization software packages is available, most of them written in Python or MatLab, some available as ImageJ plugins, and a few even as stand-alone software. Most of these software packages were tested and compared by Sage and colleagues in 2015 [36], where many parameters for benchmarking were defined for the first time. This is an on-going initiative and now concentrates on 2D and 3D analysis [37], also including several ImageJ localization plugins. The most supported 3D technique is astigmatism [38], followed by the concepts of biplane imaging [39, 40] and double-helix PSF [41]. For a full overview on the choice of appropriate software, I refer the reader to these comparative studies [36, 37]. A list of localization software packages available as Fiji plugins can be found in table 1. Here below I describe some important packages in more detail.
QuickPALM was the first ImageJ SMLM plugin published in 2010 [26]. It determines the centroid of diffraction limited spots and refraines from Gaussian fitting. It also features the generation of 3D images and has a tool for drift correction. Albeit not as accurate as with fitting it allows processing of image stacks in real-time. This demonstration—open-source and ease of use—was indeed very impressive, as SMLM analysis at this time seemed to be far away from being implementable in ImageJ. QuickPALM can be seen as a door opener for both developers and users entering the field of SMLM.
ThunderSTORM was published in 2014 [30]. It is a very comprehensive plugin with a palette of different features such as 2D and 3D image reconstruction. It also contains explanations within the GUI on different settings. It has many important options for instance different image filters such as median, Gaussian or wavelet filter. Spot localization can be performed by Gaussian fitting routines using least squares (LSE), weighted least squares (WLSE) or maximum likelihood estimation (MLE). A phasor-based localization algorithm as model-free localization approach (pSMLM-3D) with improved execution speed was recently added to ThunderSTORM [42].
PeakFit, developed by Alex Herbert, is a Gaussian fitting routine that is embedded in the GDSC SMLM ImageJ plugins [43]. It is a valuable set of ImageJ plugins for SMLM analysis, which is well documented and easy to install and maintain by simply adding it to the Fiji update sites (see section 3.2 for localization postprocessing). PeakFit is also comprehensive, supports standard smoothing filters and LSE, WLSE and MLE for localization with many adaptable parameters.
The ZOLA plugin is a relatively new addition for 3D SMLM analysis [44]. It is installable through the Fiji update sites. The method Zernike optimized localization approach in 3D (ZOLA-3D) enables the analysis of PSFs that are engineered by a deformable mirror placed in the Fourier plane of the microscope and allows for 3D imaging over increased axial ranges (5 µm) when compared to astigmatism or biplane. The plugin also allows the import and 2D/3D visualization of ThunderSTORM localization files (figure 2).
In 2015, both ThunderSTORM and PeakFit performed very well in the localization challenge [36] and especially ThunderSTORM became very popular among SMLM users. As can be seen in table 1, some localization plugins feature multi-emitter analysis of high spot densities, such as the aforementioned methods, albeit with varying performance. When single Gaussian kernels are used for fitting high density data, i.e. overlapping spots, this usually leads to image artefacts caused by false-positive localizations [45, 46] (section 3.4). It has been shown that a large fraction of artefacts can already emerge well below one spot per µm2 [47]. The extent to which artefacts are present depends on the localization algorithm and the spot density. The latter is determined by the label density and the photoswitching kinetics of the fluorophores [8]. Different concepts have been proposed to handle this problem [19, 48, 49]. Two ImageJ plugins with improved multi-emitter analysis were recently released, i.e. UNLOC [50], a parameter free-algorithm based on iterative multi-Gaussian fitting, and HAWK [51], which is based on temporal band-pass filtering of high density data. The HAWK (Haar wavelet kernel) analysis separates overlapping spots on the basis of their blinking behaviour but does not perform single-molecule localization. It can be used instead as a preprocessing tool for high density data that deconstructs raw emissions into low density data, which can then be processed with conventional localization software.
The NanoJ-SRRF plugin, which stands for super-resolution radial fluctuations [52], is an alternative to localization based algorithms for high spot densities. The method analyses radial and temporal fluctuations of spot intensities in an image sequence and is similar to super-resolution optical fluctuation imaging (SOFI), which is based on the temporal analysis of intensity fluctuations using higher order statistics [53]. It can be used on low and high spot density datasets that are not suitable for conventional SMLM localization software. Moreover, it enables super-resolution imaging without photoswitchable fluorophores, as demonstrated for live cells expressing conventional GFP [52].
Many localization plugins come with additional analysis tools such as drift correction, but only a few support channel alignment. Chromatic aberration is always a big issue when fluorophores of two or more colours are used in SMLM. The resulting distortion of the channels is obvious at the high resolution provided by SMLM and demands image registration. This feature is for instance included in the localization plugin DoM [54], where a calibration with reference structures is required, e.g. multi-fluorescence beads that are imaged on the two colour channels. Then the distortion is calculated on the basis of a B-spline grid registration and the resulting transformation can then be applied on the SMLM data.
3.2. Localization data postprocessing
Postprocessing SMLM data is becoming increasingly important, especially for extracting quantitative information [32, 55–57]. Table 2 gives an overview of SMLM postprocessing plugins that are available for Fiji. Postprocessing can be done on all three levels, i.e. on raw image stacks, localization data, and on the super-resolution image, which is illustrated in figure 3.
Table 2. Plugins for ImageJ/Fiji for postprocessing of SMLM data. FRC: Fourier ring correlation.
| Name | Description | Year | Ref. |
|---|---|---|---|
| bUnwarpJ | 2D image registration; channel alignment by elastic transformation, deformations are represented by cubic B-splines | 2006 | [64] |
| ClearVolume | Multi-channel visualization package; rendering of image stacks for 3D and multi-colour representation | 2015 | [67] |
| FIRE | Resolution estimation; first ImageJ plugin for FRC analysis | 2013 | [59] |
| GDSC SMLM | Collection of plugins; many features such as drift correction, local density analysis, pair correlation analysis, and FRC | [43] | |
| MosaicIA | Cluster analysis; calculates an interaction potential that is most likely to generate the observed object distribution | 2013 | [62] |
| NanoJ-core | Drift correction and multi-colour channel alignment | 2015 | [93] |
| NanoJ-SQUIRREL | Benchmarking SMLM images; generates error map and FRC map, uncovers local differences in resolution | 2018 | [60] |
| QuASIMoDOH | Cluster analysis; divides images into tiles (tessellation), pattern analysis done by analysing the distribution of tile areas | 2016 | [63] |
| TRABI | Intensity analysis; macro that determines spot intensities in SMLM data by temporal analysis; can extract 3D information from 2D data | 2017 | [69] |

Figure 3. Image processing options on SMLM data. Standard operations of localization software is highlighted in grey, i.e. workflow from raw image stacks, containing single-molecule emissions, over localization files, listing single-molecule coordinates, to super-resolution images (solid arrows). Postprocessing options are depicted with dashed arrows. For example, resolution can be estimated on super-resolution images using FRC, error analysis through comparison of raw and super resolution image via NanoJ-SQUIRREL, intensity analysis through molecular positions and frame information from the localization file applied on the raw image (TRABI).
Download figure:
Standard image High-resolution imageA first example is the determination of localization precision and image resolution. The precision can be calculated by the estimated photon number per molecule, which also determines the maximum achievable image resolution. The precision can also be determined experimentally, i.e. from localization patterns that originate from isolated dyes or labels [13, 14]. Localizations of these patterns are separated, aligned and summed up into a single distribution, which is then statistically analysed or fitted to a Gaussian function. This can be automated in ImageJ by graphical selection and extraction of coordinates from the localization file [32].
The actual image resolution is also determined by the label density and structural complexity. A comprehensive method to estimate the resolution is the Fourier ring correlation (FRC) [58, 59], in which single-molecule localizations are split into two halves, e.g. from odd and even frames, to reconstruct a set of two images. Then their Fourier transforms are calculated and correlated along a radial coordinate (i.e. different ring sizes). The correlation is then plotted against the spatial frequency in a FRC curve, and where the curve just falls below a threshold of 1/7 the inverse spatial frequency is stated as global resolution of the image.
The GDSC SMLM ImageJ plugin collection, to which the localization software PeakFit belongs, comes with several postprocessing tools like drift correction, blink estimator for quantitative PALM measurements, local density analysis, pair correlation analysis and Fourier image resolution using FRC, to name only a few. The comprehensive manual is recommended for a full overview of available features [43].
Another analysis package is NanoJ, developed by the Henriques lab. The core plugin can be used for drift correction and channel alignment, and several extension plugins such as NanoJ-SRRF [52] (section 3.1) and NanoJ-SQUIRREL [60] were released, where the latter acronym stands for super-resolution quantitative image rating and reporting of error locations. NanoJ-SQUIRREL can be used to extract error maps, which are produced through the comparison of a super-resolution image with its diffraction-limited reference image. It further features FRC analysis for local resolution measurements. For this purpose the image is divided into image segments and a FRC map is obtained that gives evidence of the local resolution (figure 4). A comparison of both FRC and error maps can then give information on image artefacts that might lead to high resolution at the cost of structural integrity [60]. NanoJ and its extensions can be installed through the Fiji update sites.

Figure 4. SMLM resolution estimation with Fiji. Left: A dSTORM image on the nuclear core complex is reconstructed from a localization file. Middle: To estimate the resolution via FRC the localization data is split into two dSTORM images, e.g. by using the odd frames for the upper and even frames for the lower image. Right: Using the NanoJ-SQUIRREL plugin a FRC map is generated, showing different FRC resolutions depending on structural complexity and NPC density. Split images were reconstructed with 7 nm pixel size, the plugin calculated from 350 blocks a mean FRC resolution of 50.1 nm (min = 15.0, max = 745.7, st.dev. = 88.0 nm).
Download figure:
Standard image High-resolution image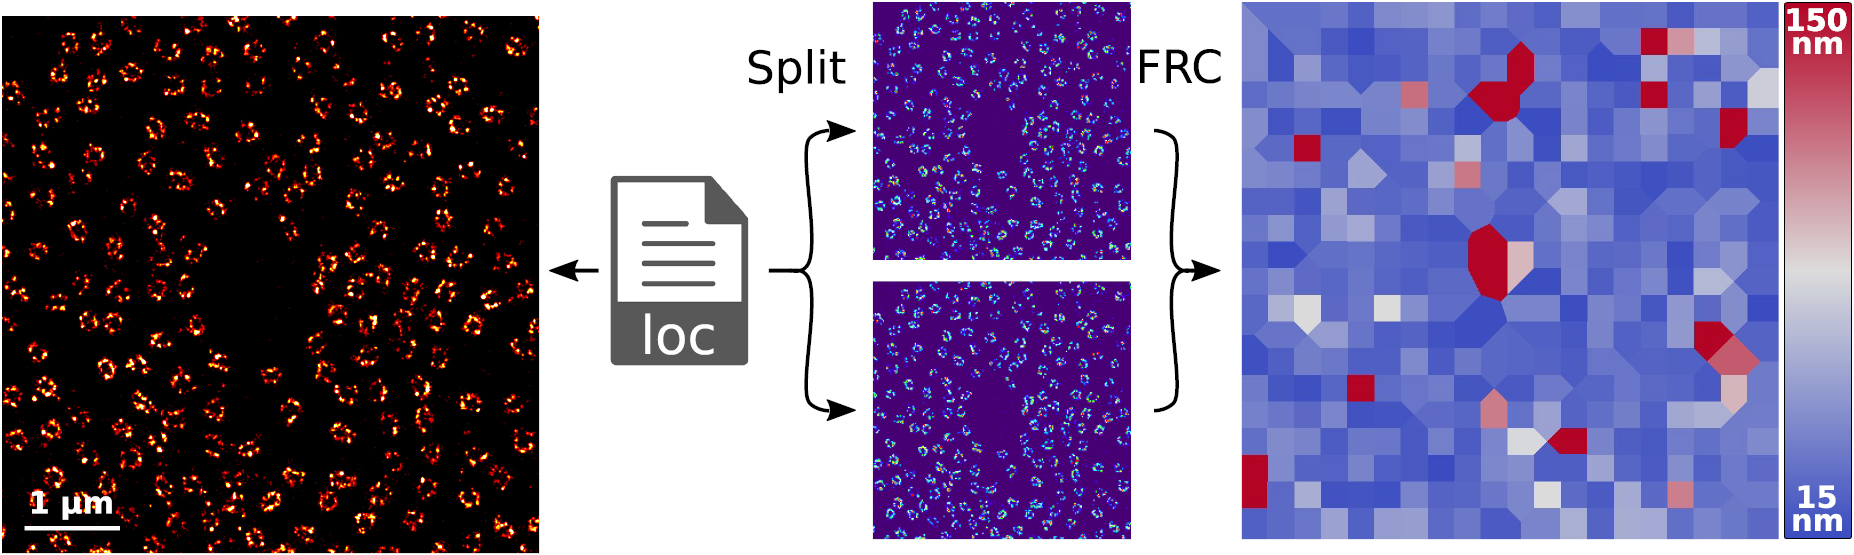
The distribution of proteins in nanodomains can be well investigated with SMLM by analysing the spatial distribution of single-molecule localizations [61]. This type of analysis is often referred to as cluster analysis, in which the amount of neighbours in varying distance from each localization is used to determine the degree of clustering such as in Ripley's K-function, nearest neighbour and pair-correlation function analysis. Some localization plugins already feature cluster analysis such as the GDSC SMLM ImageJ plugin collection, SOSplugin and SMLocalizer, but there are only a few plugins solely designed for cluster analysis, such as MosaicIA [62] and QuASIMoDOH [63]. Both can be used for standard microscopy images and SMLM data. For instance, QuASIMoDOH uses a geometrical approach called tessellation, in which images are divided into tiles, whose area distribution is analysed using both neighbour and intensity information.
3.3. Additional tools for SMLM
Several other microscopy tools that can be used for SMLM analysis are either already available in Fiji or can be easily added. For instance bUnwarpJ, which can be used for registration of multi-channel images [64]. It calculates a cubic B-spline transformation by evaluating two images. This can be done for a set of images serving as calibration, e.g. a bead sample that is fluorescent on different colour channels. The calibration file can then be used to register two-colour SMLM images. The plugin can also be directly applied to microscopy images without having performed a calibration, provided that both channels contain sufficient structural similarity. bUnwarpJ has been successfully used for multi-colour dSTORM imaging of the nuclear pore complex, where the resulting chromatic aberration required image registration [65]. It was further used for aligning images from correlative dSTORM and scanning electron microscopy (SEM) [66].
The representation of 3D SMLM data is challenging. Often, 2D images are shown with a 3D colour-code. But 3D rendering can be done in Fiji as well. Therefore, a 3D localization data stack with x-, y - and z-coordinates must be loaded into Fiji as z-stack (e.g. using the macro LocFileVisualizer). A region of interest can be selected and rendered by the Fiji plugin '3D viewer'. Another option is the plugin ClearVolume, a GPU accelerated multi-channel visualization package originally developed for light-sheet microscopy data that can create multi-view and multi-colour renderings [67]. An example of 3D rendering of SMLM data is shown in figure 2(d).
As mentioned, the spot intensity in SMLM is an important parameter for the localization precision [17, 68]. Many software packages calculate the spot intensity, which is determined from the area under the 2D Gaussian function. These photon numbers are underestimated on experimental single-molecule emissions [68] and depend heavily on the molecule's axial position [69]. A Fiji macro called temporal, radial aperture based intensity estimation (TRABI) has been developed that delivers a constant spot intensity over an increased axial range [69]. It estimates the intensity of spots within a certain circular aperture and corrects for the background intensity by means of temporal analysis. Furthermore, it allows extracting of axial information from 2D localization data when compared with the intensities of the underestimated Gaussian fit.
3.4. Artefacts related to SMLM image analysis
In general, super-resolution microscopy methods and SMLM in particular are very prone to errors, which can occur at the stage of (i) sample preparation, (ii) data acquisition and (iii) image analysis. This includes errors originating from blinking characteristics of the fluorophore (over- and under-counting), fixation and labelling issues, high label densities and inadequate software settings [46, 56, 70–73].
Potential artefacts in quantitative SMLM are over- and under-counting, i.e. molecules that are counted more than once or not at all during the localization process, respectively [56, 70, 71]. Over-counting can emerge from false-positive localizations due to a low intensity threshold or if fluorophore blinking was not corrected. On the other hand under-counting can originate from a threshold that is set too high or when high density data is inappropriately analysed. In addition, a resolution bias can be expected if high spot densities are not analysed with appropriate tools [19, 50, 51]. This can result in distorted filamentous structures [45] or increased cluster sizes [46].
Image analysis should not be seen as the final stage to fix errors that could have been avoided during sample preparation and data acquisition. An inspection of the spot density at the stage of data acquisition can already indicate the need for a revision of the sample preparation. Although software for high spot densities is available, it is always beneficial to keep the spot density as low as possible to obtain the best localization precision.
A successful strategy for high quality quantitative SMLM results should therefore optimise all parts. This comprises the sample preparation by testing different label densities, inspecting artefacts that occur due to fixation [74], the data acquisition itself (e.g. laser intensities and camera parameters) and finally the SMLM image analysis by optimal localization software settings and the application of multi-emitter algorithms. Currently, Fiji offers well established localization software packages along with options for high density analysis and super-resolution image evaluation.
4. Summary and outlook
ImageJ has become a successful software for platform independent open-source image analysis. Especially the Fiji distribution became very popular in the life sciences and integrates important tools in biological imaging. An abundance of plugins has been developed and can be used for a broad range of different microscopy methods, such as confocal, wide-field, light-sheet, and electron microscopy as well as super-resolution imaging.
After the development of PALM and STORM in 2006, it took some time until the first ImageJ plugins for SMLM were available. But then the first plugins appeared and more and more functionality was added and especially during the last five years we have seen a substantial increase in novel Fiji tools for SMLM. Recently, the first ImageJ plugins for SIM, another wide-field based super-resolution technique, have been released. fairSIM enables image reconstruction of SIM images [75] and SIMcheck, a package of plugins, features benchmarking and calibration tools for SIM [76]. Research no longer depends solely on commercial SIM software and have now the possibility to compare their results.
Fiji became altogether a comprehensive platform for super-resolution microscopy analysis. It is anticipated that many more tools will be added in the future. The entry barrier for SMLM was further reduced as the construction of cost-effective but still single-molecule sensitive wide-field setups is feasible [77–79]. Even if some plugins of the early days may become less important due to a lack of support, further development or better and more advanced alternatives, the open-source idea behind ImageJ might allow the community to maintain these nevertheless, especially those that found wide-spread use.
Finally, the question arises what functionality is currently missing or desirable to have in Fiji for SMLM as comprehensive software packages are already available. A good example is the GDSC SMLM ImageJ plugin collection. Further tools, in particular novel routines on segmentation and density analysis that are solely designed for SMLM data with graphical representation would definitely enrich the toolbox, especially with regard to cluster analysis in three dimensions [80], allowing users to compare results obtained by different methods [62, 63, 81].
New challenges for SMLM data analysis are on the rise, predominantly with regard to large data sets and their quantitative evaluation. SMLM measurements can be automated and permit high throughput super-resolution imaging [82, 83]. Quantitative assessment of this data often requires manual evaluation and is thus time consuming. It will be interesting to explore how machine learning can be adapted to super-resolution data as first machine learning tools in ImageJ were just developed [84].
Acknowledgments
I would like to thank the ImageJ and Fiji community for doing a great job that allows us researchers to enter the fascinating field of microscopic image analysis. I am also very grateful to Oliver Henrich (University of Strathclyde, Glasgow) and Christian Franke (MPI-CBG, Dresden) for critically reading the manuscript and Lucas Herdly (University of Strathclyde, Glasgow) for comments on the macro. This work was supported by the Academy of Medical Sciences/the British Heart Foundation/the Government Department of Business, Energy and Industrial Strategy/the Wellcome Trust Springboard Award (SBF003\1163).
Supplementary information
The macro LocFileVilualizer is available as supplementary software. Updates will be available from http://bcp.phys.strath.ac.uk/photophysics/super-resolution/software/.