

Abstract
The clade of Myxogastria, commonly described as true or plasmodial slime molds, contains more than 1000 species. During their life cycle many of these slime molds develop extended networks of connected veins, known as unicellular (phanero)plasmodia. Among those, Physarum polycephalum gathered by far the most attention of biologists and physicists. Via oscillating cytoplasmic streams nutrients as well as signaling factors spread through the adaptive plasmodial network. These properties have rendered it not only a model organism for acellular slime molds, but also a model to investigate network dynamics, biological fluid-dynamics and food foraging behavior. Here, we studied parameters of plasmodial growth and network development, including chemotactic responses, in three slime mold species: Physarum polycephalum, Badhamia utricularis, and Fuligo septica. We discovered significant variations in chemotaxis, velocity, and oscillatory behavior of plasmodia among and within these species. Interestingly the patterns of the variations also reflect phylogenetic relationships of the species. In contrast to a common notion, phaneroplasmodia of slime molds develop diverse and specifically organized networks by triggers yet to be explored. This work lays the ground for studying more of these organisms to understand basic features of planar network organization and their variations, which evolved as successful solutions of nature.
Export citation and abstract BibTeX RIS
1. Introduction
The group of Myxomycetes is a clade within the Amoebozoa and consists of more than 1000 species [1, 2]. Many of them form a spatially extended plasmodium as a part of their life cycle. These phaneroplasmodia, typical in the order Physarales, are generally defined as a single but multinucleated cell, which is migratory and can spatially expand from a few square millimeters to even as large as square meters [3]. Morphologically, the plasmodia consist of tube like veins forming an interconnected network. Across these plasmodial tubes nutrients, signaling molecules etc are transported via an oscillatory cytoplasmatic flow [4]. The cross section of these plasmodial tubes can be distinguished into a sol like interior and an exterior comprised of an actin myosin network [5, 6]. By contracting the plasmodial tube periodically, the actin–myosin network drives the flow in a shuttle streaming manner [7, 8].
Among the variety of slime molds, by far the most extensively studied species is Physarum polycephalum (figures 1(a) and (e)). A large variety of questions was investigated on P. polycephalum ranging from cell biology to network theory. It therefore became a model organism for plasmodial slime molds itself, biofluiddynamics and lastly for information processing in a complex environment without a nervous network [9]. While research on cell biology also focused on Didymium iridis [10], biophysical research was centered almost exclusively on P. polycephalum. A few exceptions are comparing studies on the food foraging behavior of P. polycephalum and species of the Didymium genus [11, 12]. Otherwise comparative studies are scarce, because only a fraction of all known slime molds can be transferred to and investigated in the laboratory, using moist chambers [13]. For quantitative comparisons even further conditions have to be matched, calling for plasmodia which can be cultured and maintained under laboratory conditions (ideally the same as P. polycephalum). Here, we extend the quantitative analysis of migration related and oscillatory properties of the phaneroplasmodium to two further species of the family Physaraceae, namely Badhamia utricularis (figures 1(b) and (f)) and Fuligo septica (figures 1(c), (d) and (g)). Both are natural isolates that were successfully transferred to and maintained under laboratory culturing conditions. These slime molds have rarely been studied, despite both generally being well recognized for their ability to secrete exoenzymes. This allows them to fully absorb food [13]. Consequently, the attraction of B. utricularis towards extracts of several basidiomycetes was investigated [14, 15]. Fuligo septica gained most attention for its yellow color, caused by pigments, identified as fuligorubin A and dehydro- fuligoic acid [16, 17].
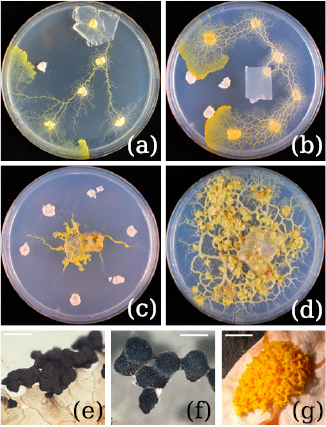
Figure 1. Variety of the used strains as plasmodia and respective fruiting body. (a)–(d) Images of the phaneroplasmodia of Physarum polycephalum (Strain Japan) (a), Badhamia utricularis (Isolate 1) (b), and Fuligo septica (Isolate 1) (c) and (d), on Petri dishes ( cm) containing 1.2% agar. The fruiting bodies used for taxonomic identification are shown in (e)–(g). (e) Sporocarps of Physarum polycephalum (Strain Japan), (f) Sporocarps of Badhamia utricularis (Isolate 1) and (g) Immature aethallium of Fuligo septica (Isolate 1). Scale bars: (e) 500 μm, (f) 500 μm, (g) 5 mm. (e), (f) and (g) Reproduced with permission from [18].
Download figure:
Standard image High-resolution imageMeasurable quantities of an expanding plasmodium are for instance its area over time, the velocity of the expanding front [19] and the oscillatory shuttle flow, which is reflected by intensity oscillations in the gray scale images [20]. In the present study, we used these descriptors to investigate similarities and differences of the plasmodia of two related genera (Badhamia and Physarum). F. septica's distinction from the other two, in terms of migration and morphology, is already apparent at first glance. Furthermore, F. septica lacks self-avoidance distinguishing itself even further. During exploratory migration of P. polycephalum the plasmodium avoids its own trails and therefore regions it visited already. Hence, the examination of F. septica required the additional definition of a further measurable quantity.
Finally, a phaneroplasmodium, potentially of a large size, may be exposed to a variety of different chemical stimuli. The plasmodium of P. polycephalum is known to respond to a variety of chemicals with migration towards or away from the chemical, a process commonly described as chemotaxis. As such complexity is likely for both other species, we evaluated those in their chemotactic behavior towards (or against) different sugars. These are known to cause a response in P. polycephalum, which therefore served as a control [21–23]. In summary, we present the evaluation of two further plasmodial slime molds of the Physaraceae family in terms of their growth and oscillatory patterns. In comparison to the well studied Physarum polycephalum, this comparative biophysical study shows similarities in plasmodial growth but also the diversity of some features across a family within the myxomycetes.
2. Material and methods
2.1. Cell culture
The investigated myxomycete strains, their origin (see table A1) and taxonomic as well as phylogenetic identification can be found in appendix A. All specimens were cultured in the dark at room temperature on 1.2% agar filled Petri dishes and fed with oat flakes (Kölln Flocken). The Badhamia utricularis and Physarum polycephalum cell cultures were renewed every 1–2 d. Fuligo septica could be cultured on the same Petri dish for longer intervals (2–4 weeks). Sclerotia were created for each strain of B. utricularis and P. polycephalum by drying plasmodia carrying wet filter paper [24]. Each B. utricularis and P. polycephalum cell culture was restarted once per month by regrowing plasmodia from sclerotia. Preparation of an experiment with these strains could be handled in the same way for both: One day prior to an experiment a sufficient amount of plasmodia was transferred to a large (9 × 9 cm) Petri dish filled with 1.2% agar. The pieces of plasmodia were aligned along one side, fed with oatflakes and incubated as described above in order to create a large plasmodial front. On the contrary, plasmodia of F. septica had to be harvested directly from the cell culture.
2.2. Growth assay
An agar piece (approximately 2 × 2 cm), carrying a part of the growing plasmodial front, was transferred to a new Petri dish containing 1.2% agar. The dish was placed into the experimental set-up (see appendix B.1 for a detailed description) and the recording was started immediately afterwards. Images were recorded once per minute and each image was recorded 3 times (total recording time approximately 1 s) and averaged afterwards in order to reduce noise.
The growth assay could be extended to include faster recording of images (1 frame per second, 1000 frames, no frame averaging). These episodes of fast recording were triggered once the plasmodium reached a pre-defined region (see appendix B.1 and figure B2). This could include the application of ∼1.5 ml 0.1 M glucose, once the plasmodium reached the vicinity of the inlet (figure B2(b)).
2.3. Chemotaxis assay
The experiments were carried out in a glass culture chamber (24 × 12 cm) filled with 1.2% agar (detailed description of the experimental set-up in appendix B.2). 24 h prior to the experiment, 300 μl of the respective sugar solution were filled into pre-punched wells (figure B3(C)). The culture chamber was covered and kept for 24 h to allow for diffusion of the sugars (see figures B4 and B5 for the evaluation of the sugar gradients). Four pieces of agar (1 × 1 cm), carrying a plasmodial front, were placed onto the agar in approximately 1.5 cm distance to the sugar source (figure B3(C)). The agar pieces were placed such that the plasmodia on top faced different directions. The culture chamber was sealed with transparent foil and the recording was started right afterwards. Images were recorded once per minute. Similar to the growth assay each image was recorded three times (total duration approximately 1 s) and averaged afterwards. The maximal duration of an experiment was limited to 24 h due to the constant diffusion of the sugar solutions.
2.4. Image processing
The first frame in each time series (i.e. recorded directly after transferring the plasmodium) is defined as the background frame. This frame is subtracted from every consecutive frame. In order to reduce noise growth, each frame and the background frame itself are median filtered prior to subtraction. Furthermore, the background intensity may not remain stable over a 1–2 d experiment. Each current frame's background level is therefore estimated by maximum filtering (the slime mold network is darker than the background and as such removed from the image). The average of the maximum filtered image describes the offset of the current frame's background intensity to the first frame and is thus subtracted as well. The resulting image serves as the input for all intensity based analysis.
The initial threshold for binarizing the background corrected image was defined as follows: a Gaussian distribution was fitted to the histogram of the background corrected image and subtracted of that histogram. The binary threshold is defined close to the point at which this difference turns positive (a bias away from a Gaussian distribution is caused by the dark pixels of the network). The binarized image unavoidably still contains noise and is therefore filtered such that only pixels remain which occur in five consecutive frames. Finally, the time series was filtered sequentially by labeling connected components. This left only pixels which were either connected to the start region or connected to the detected network of the previous frame.
2.5. Data analysis
The area of the plasmodium is calculated by MATLAB's bwarea function on the binary mask. Additionally, the explored area at time t is defined by the area at which the plasmodium was detected at least once until this time. The signal was counted as oscillatory, if a section of at least 4 full oscillation cycles was present. The explored area timeseries was then detrended by filtering it with a Savitzky–Golay filter [25] (MATLAB, signal processing toolbox) and subtracting the filtered signal from the original one. The oscillatory part was cut in phase and the dominant frequency was obtained from the FFT.
The velocity was calculated for both the expanding and the retracting regions. The growth/migratory speed was only calculated on the expanding plasmodial front, while all regions, which were larger than 10 px, were considered for calculating the retraction velocity. The velocity at a certain point  of the boundary was defined as
  , where
  min,
min,  is the distance of
  to the closest point of the boundary B(x, y, ti+5) and vice versa
  the shortest distance to any point of B(x, y, ti−5). Distances were calculated using MATLAB's internal bwdist routine. To investigate the growth of Fuligo septica the time profile of each pixel, which was visited by the network at least once, was scanned for strong changes by findchangepts (MATLAB, signal processing toolbox). Such a changing point reflects a network passing by and thereby decreasing / increasing the intensity. The binary masks for image series, recorded at 1 Hz, were created as described above. Additionally, the intensity profile over time of each pixel, which is present over the entire 1000 frames, was used to compute a periodogram. All periodograms were then averaged and the two dominant peaks were used to compare the intensity oscillations.
3. Results
3.1. Chemotaxis assay shows similarities between P. polycephalum and B. utricularis
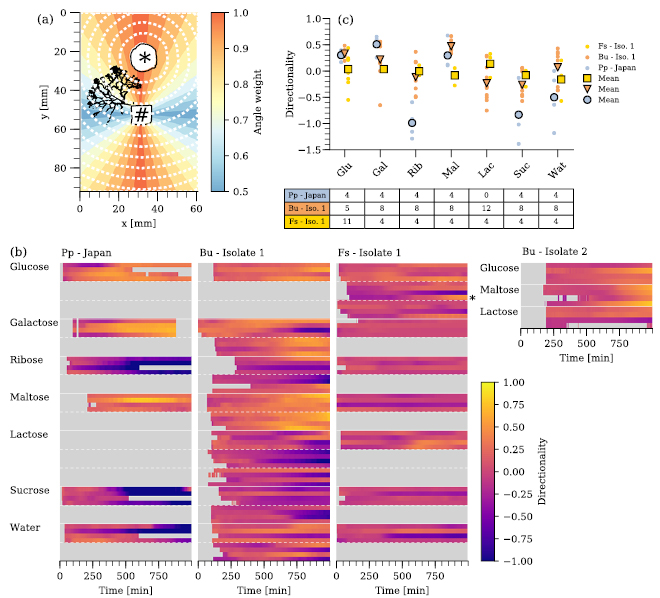
Prior to the quantification of the different plasmodial growth patterns, Badhamia utricularis Isolate 1 and Fuligo septica Isolate 1 were tested for their response towards gradients of different mono- and di-saccharides. These are either known to be attractants or repellents to Physarum polycephalum, which therefore served as a control [22, 23]. Figure B6(b) shows all recorded responses with their directionality over time color coded. A direct comparison of the different species is shown in figure B6(c). Each data point marks the directionality at the end of an experiment, or if reached, the directionality at t = 800 min.
Badhamia utricularis responds to the same chemoattractants (glucose, galactose, maltose) as P. polycephalum, while the response towards the repellents of P. polycephalum is less clear. 0.1 M ribose acted five times as repellent and three times as attractant (out of eight experiments). Based on the average (directionality = −0.3 ± 0.26), 0.1 M sucrose acts as chemorepellent on B. utricularis as well. F. septica, however, did not show an average response towards or against most of the respective sugar gradients. Only 0.1 M lactose appears to act as a weak attractant causing a directionality of 0.1 ± 0.07.
3.2. Growth and oscillatory expansion differ across species and isolates
The growth/migration of the phaneroplasmodium from the initial transferred culture is first characterized by the evolution of its area as a function of time. Two exemplary growth patterns, resolved in space, are shown in figure 2 for P. polycephalum (a) and B. utricularis (b). The outlines (plotted every 10 min) of both examples indicate an oscillatory expansion. A similar behavior was observed during the growth under the influence of an external sugar gradient (see figure 2(c)) for an exemplary evaluation of B. utricularis on a gradient towards 0.1 M glucose).

Figure 2. Exemplary growth patterns. The expansion of the different plasmodia is illustrated by drawing the outline of the growing front. Time between each plotted outline is 10 min. (a), (b) Growth assays of Physarum polycephalum (strain Japan) and Badhamia utricularis (Isolate 1), respectively. (c) Growth of 4 B. utricularis plasmodia on a gradient of 0.1 M glucose. Total time: (a) 830 min, (b) 2450 min, (c) 1150 min.
Download figure:
Standard image High-resolution imageThe growth of all investigated species is displayed in figure 3. (a) shows the averaged area over time for four different isolates and (b) the averaged explored area over time for the same data sets. Clearly, P. polycephalum (Strain Japan) increases its area fastest ((a), linear growth rate between t = 200 and t = 600 min equals 1.1 mm2 min−1), while the two B. utricularis strains grow at a slower rate (0.57 and 0.6 mm2 min−1 between t = 200 and t = 600 min). Each plasmodium eventually reaches a state of nearly constant covered area, but the point at which this transition occurs varies strongly within and between the different isolates (figure 3(c)). If the timeseries of the explored area are plotted individually, see figure 3(d), it becomes evident that even though growing at a similar rate, only the Isolate 1 of B. utricularis shows the oscillatory expansion (in 5 out of 5 growth and 46 out of 57 chemotaxis assays), while all samples of Isolate 2 grow steady (23 assays in total).

Figure 3. Plasmodial growth over time. (a) Averaged area (every 100 min) for Physarum polycephalum Strain Japan (n = 4, blue circles), Badhamia utricularis Isolate 1 (n = 5, orange downward triangles) and Isolate 2 (n = 11, salmon upward triangles) and Fuligo septica Isolate 1 (n = 8, yellow squares). The same data sets are plotted (b) by means of explored area over time. In (a) and (b), the errorbar indicates the standard deviation. The averages were calculated from t = 200 min on and as long as the number of experiments, contributing to the mean, remained the same. (c) Individual time traces of the explored area as a function of the area covered by the plasmodium (P. polycephalum (Strain Japan)—blue, Isolate 1 and 2 of B. utricularis—orange and red dashed). (d) The individual explored area signals plotted as a function of time. (e) Detected period in the expansion of the plasmodium (if oscillatory) during the undisturbed growth and the growth/migration under the influence of a sugar gradient. Small dots give the individual detected period and the corresponding circle (P. polycephalum—Strain Japan) and triangle (B. utricularis—Isolate 1) the respective means. The number of all oscillatory time traces is shown in the table below. Abbreviations give the three letter code for the sugars and Wat—water, GA—growth assay.
Download figure:
Standard image High-resolution imageThe oscillatory expansion of the plasmodial front can be compared between the two species for both the growth and the chemotaxis assay (figure 3(e)). Interestingly, for B. utricularis the measured period of oscillation decreases from 60 ± 8.6 min (undisturbed growth, GA—growth assay, Wat—water control of chemotaxis assay) to 41 ± 2.8 min in the presence of a gradient of 0.1 M glucose, to 39 ± 3.3 min in the presence of 0.1 M galactose, and to 41 ± 7.1 min for 0.1 M maltose, which all act as chemoattractants to B. utricularis.
3.3. The velocity over time allows insight into the strain difference
The growth of the plasmodial front as well as the retraction of the plasmodium elsewhere, can be further characterized by their velocities. Figures 4(a) and (b) show two spatially resolved examples of the growth velocity for P. polycephalum (Strain Japan) and B. utricularis (Isolate 2). The color scale represents the respective velocity at each point of the plasmodial front. In accordance with the growth patterns, the velocity maps show also oscillating patterns. This is more evident for P. polycephalum, but also the Isolate 2 strain of B. utricularis grows in an oscillatory manner. The dense outlines of the B. utricularis plasmodium indicate an oscillation of a shorter period, which gives the apparent steady growth pattern also seen in figure 3(d). This is best displayed and investigated in detail by drawing the velocity histograms (i.e. the histogram of all velocities at a certain time t) for both growth and retraction as a function of time (figures 4(c) and (d)). For P. polycephalum the phases of fast growth and rest are clearly visible in the histograms over time. The retraction shows a similar oscillatory pattern. Phases of stronger retraction go along with phases of growing the plasmodial front, but are shorter compared to those. Regarding the B. utricularis Isolate 2, the velocity histograms over time show that neither the growth nor the retraction drop to zero during the expansion and migration (the only exception is the plasmodial front reaching the boundary of the Petri dish at t = 970 min). Yet, the periodicity in the growth of Isolate 2 is visible in both histograms and can be calculated using the time profile of the median growth velocity (i.e. number of counts of that velocity over time). It results in a period of ∼20 min, which is considerably shorter compared to the other isolate of B. utricularis (60 ± 8.6 min, see section 3.2).
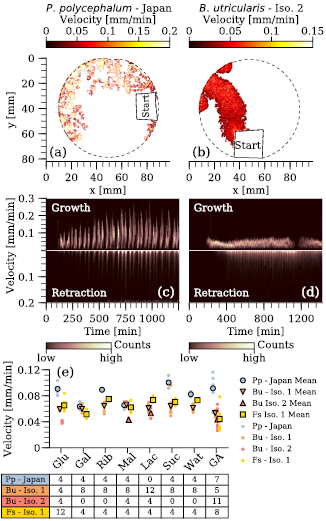
Figure 4. Velocity of the expanding front. The outlines of the growing plasmodial front (Physarum polycephalum—strain Japan (a) and Badhamia utricularis Isolate 2 (b)) are colorcoded by their velocity. (c), (d) Velocity histograms for both growth and retraction over time of the two samples shown in (a) and (b). The color indicates the counts within each histogram. (e) Mean velocities shown for both: undisturbed growth (GA—growth assay) and during chemotaxis assay (three letter code indicates the different sugar gradients and Wat—water). Each individual point represents one experiment and the total number of experiments per condition is shown in the table below. Pp— Physarum polycephalum, Bu— Badhamia utricularis, Fs— Fuligo septica.
Download figure:
Standard image High-resolution imageFinally to compare all different species, the mean of all detected velocities per experiment is plotted in figure 4(d) (small dots) with respect to the experimental condition (i.e. growth with or without an external sugar gradient). The average over all experiments of one strain and one external condition is given by the larger symbols. In five out of eight cases P. polycephalum shows the largest average velocity (above 0.08 mm min−1), while both isolates of B. utricularis as well as F. septica extend their plasmodial front with a similar velocity (0.05–0.07 mm min−1). Interestingly, F. septica expands its plasmodium at the same rate while the net growth rate of the covered area is much slower (0.14 mm2 min−1, figure 3(a), yellow squares). This is due to the expansion pattern of F. septica. It lacks self-avoidance, but consists of multiple re-growths and retractions along previously visited areas.
3.4. Fuligo septica shows a growth pattern without self-avoidance
The pattern of multiple re-growths and retractions of F. septica, required a different analysis approach to quantify its plasmodial expansion. First, all pixels at which the plasmodium was at least detected once are displayed in figures 5(a) and (b) with their color indicating the relative time the plasmodium spent at the particular position. This relative time is computed by the fraction of time the plasmodium was detected at the evaluated pixel divided by the total duration from the first detection to the end of the experiment. The resulting images show that F. septica forms a plasmodial network with major and interconnected veins over time. However, even the major veins may fully retract several times, before becoming stable. Furthermore, with each re-growth along the existing routes, the plasmodium extends its explored area, as shown in figure 5(c). Here, each outline represents the maximal extension reached during one particular re-growth cycle. In (d) and (e), the intensity profiles of each pixel, at which the plasmodium was at least detected once, are plotted over time. The y-axis is given by the linear indexing of the binary mask, meaning that neighboring indices are likely but not necessarily neighbors in the binary mask. The re-growth/retraction behavior is visible for practically every part of the plasmodium (see the supplementary materials for a movie of this experiment (stacks.iop.org/JPhysD/51/344001/mmedia)). The first stable veins form after 2000 min (straight darker horizontal lines with no further interruption). In the particular experiment shown in (a), (c) and (d), the plasmodium forms two parts, which remain fully connected, but their re-growth and retraction cycle are anticorrelated.
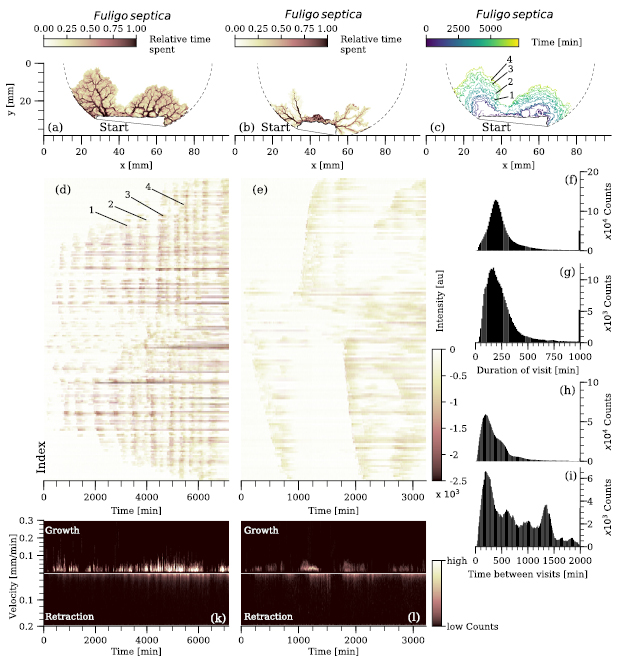
Figure 5. Re-growth pattern of Fuligo septica. (a), (b) Two growth assays of F. septica are displayed with the color indicating the relative time (normalized to the remaining time of the experiment), which the plasmodium was detected at that particular pixel. (c) The expansion of the explored area of (a). The colored lines show the maximal outline reached by the plasmodium at the certain time. (d), (e) The intensity profile of each pixel plotted as a function of time for both cases (a) and (b). The y-axis follows the MATLAB matrix indexing and the color gives the intensity at this position after background subtraction. The numbers 1–4 represent four different outlines of the maximal extension (c) and their respective approximate counterparts (i.e. the position in time of the darker vertical stripes) in (d). (f), (g) Histogram of the time, which the plasmodium spent at a certain pixel for a single continuous visit. The histogram includes all pixels at which the network was detected at least twice. (h), (i) Histogram over all pixels regarding the duration until the plasmodium returned. (f), (h) Correspond to the experiment displayed in (a) and (g), (i) correspond to (b), respectively. (k), (l) Velocity histograms for both growth and retraction over time of the two samples shown in (a) and (b). The color indicates the counts within each histogram.
Download figure:
Standard image High-resolution imageTo further analyze similarities and differences between the two exemplary F. septica experiments, the time the plasmodium spent continuously at a certain position is counted in a histogram for all pixels and all individual visits of the plasmodium. Corresponding to experiments (d) and (e), the histograms are shown in (f) and (g) with the most occurring durations (peak) 191 min and 221 min, respectively. Yet, the time between visits of the plasmodium, detected on a particular pixel, differs (figures 5(h) and (i)). In the regular expanding case, see (a), (c) and (d), the histogram over all intervals in between visits also peaks at 191 min, indicating that the continuous presence of the plasmodium at a certain position was as long as the time the plasmodium was not detected. However, the distribution of this histogram is much broader. The second shown plasmodium, (b) and (e), regrows with an irregular pattern along the pre-existing routes, displayed by the histogram (i), which contains several different peaks and many intervals larger than 1000 min. Finally, figures 5(k) and (l) show the velocity histograms of the two displayed plasmodia. Similar to the other two investigated species, the plasmodium, shown in (a), (c) and (d), is almost continuously growing, migrating, and retracting its network (k). The velocity spikes (growth) are irregularly distributed and do not correlate with the very regular expansion pattern (d). The more irregular expanding plasmodium, (b) and (e), partially follows this observation. However, the velocity histogram shows several time intervals in which either growth or retraction were not detectable (l).
3.5. Intensity oscillation period is longer in Badhamia utricularis
The tube oscillations in Physarum polycephalum, which generate the shuttle flow of intracellular material, can be connected to intensity oscillations of the plasmodium [20]. To study these oscillations, the growth assay (1 frame min−1, see appendix B.1) was interspaced by faster recording (1 frame s−1), once the plasmodium reached a pre-defined location (figure B2, orange outline). The resulting averaged periodogram contains multiple dominant frequencies, of which the two largest are shown in figures 6(a) and (b). The graph is plotted with respect to the area of the plasmodium at the point of recording and additionally shows the full width half maximum (FWHM) for each plotted peak position (indicated by the errorbars). Stronger variations in the oscillation frequency across the plasmodium would lead to a larger FWHM. The dominant frequency (a) of the intensity oscillations show both Badhamia utricularis strains oscillate on a shorter frequency, i.e. on a longer period (8.9 ± 1.30 mHz ≈112 s, n = 8) compared to the three investigated Physarum polycephalum strains (10.8 ± 1.70 mHz ≈93 s, n = 12). This holds true for the second most prominent frequency within the periodogram ((b), B. utricularis: 18.0 ± 2.46 mHz ≈56 s, n = 7, P. polycephalum: 21.4 ± 4.22 mHz ≈47 s, n = 11).

Figure 6. Intensity oscillations across different phaneroplasmodia. The two dominant frequencies of the averaged periodograms, calculated from the intensity oscillations of each pixel within the detected plasmodium, are shown in (a) dominant frequency and (b) second dominant frequency. The errorbars indicate the full width half maximum (FWHM) of the individual peaks. The peak amplitude of the dominant frequency is given in (c) and the amplitude of the second dominant frequency in (d), respectively. Errorbars in (c) and (d) indicate the standard deviation of the averaged periodogram at the peak position. Pp— Physarum polycephalum, Bu— Badhamia utricularis. Different data points may origin from the same sample, recorded at different points in time. Number of data points: Pp-USA n = 1, Pp-Australia n = 7, Pp-Japan n = 4, Bu-Iso.1 n = 4, Bu-Iso.2 n = 4. In two cases, the second dominant frequency was not detected between 100 and 6.6 mHz (10–150 s). These cases were not included. (e) The dominant frequency of the intensity oscillations as a function of the mean velocity, measured at the time of recording the intensity oscillations. Vertical errorbars indicate the FWHM of the frequency peak and horizontal errorbars the standard deviation of the mean velocity.
Download figure:
Standard image High-resolution imageThe amplitude of the dominant and second dominant frequency in the averaged periodogram are shown in figures 6(c) and (d). A smaller variation (errorbars in (c) and (d) are the standard deviation) would hint to a tighter control of the oscillation within the plasmodium. However, the averages and their deviations remain in the same range among the different isolates and organisms. A small dependence of the oscillation frequency on the area, covered by the plasmodium, is measurable but not likely (Pearson correlation coefficient (PCC) = −0.27, P = 0.24). Interestingly, there is a strong correlation between the frequency of oscillation and the mean velocity of the leading front across the different species and isolates (PCC = 0.59, P = 0.007, n = 19, figure 6(e)). Here, the mean velocity was calculated as the mean of the respective velocity histogram at the time of recording the intensity oscillations.
Finally, experiments involving the application of a sudden stimulus of a chemoattractant or repellent, are a key to investigate the immediate response of the plasmodium. In a first set of experiments, ∼1.5 ml 0.1 M glucose were applied to the two different isolates of B. utricularis. The stimulus induces a local response first [26] and therefore the histograms of the detected dominant periods within the individual periodograms are required, in addition to the averaged periodogram, to describe the stimulus response (figure 7: (a) Isolate 1, (b) Isolate 2). If applied directly, glucose at a concentration of 0.1 M can act as a repellent [23], thus decreasing the frequency of oscillation in P. polycephalum [27]. Both B. utricularis strains follow this observation. The exemplary case of Isolate 1 decreases the oscillation frequency from 9.5 mHz ((a) yellow) to 7 mHz ((a) blue), corresponding to an increase of the oscillation period from 105 s to 142 s. Accordingly, Isolate 2 responded with a decrease from 10.5 mHz to 9.5 mHz (b), equaling an oscillation period increase from 95 s to 105 s. Following the analysis displayed in figure 6, figures 7(c)–(f) show the analysis based on the averaged periodogram. Other recorded time series taken over the course of the experiment are displayed for the sake of completeness. The amplitude of the dominant frequency in the averaged periodogram remains in the same range, see (c) and (e), while the frequency drop after the application of a stimulus (red dashed line) is clearly visible, see (d) and (f).
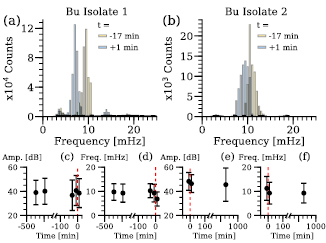
Figure 7. Change of oscillation frequency under stimulus for Badhamia utricularis. (a), (b) The two recorded image series (1 Hz, 1000 frames) prior and after application of the stimulus are displayed by a histogram, which shows the distribution of all dominant frequencies across the entire plasmodium. The stimulus (∼1.5 ml 0.1 M glucose) was applied right after recording an image series (yellow, t = −17 min) and was immediately followed by a second recording (blue,  min). Bu— Badhamia utricularis (a) Isolate 1, (b) Isolate 2. The dominant frequency peaks of the averaged periodograms are shown in (c) and (d)— B. utriclaris (Isolate 1) and (e) and (f)— B. utricularis (Isolate 2). (c), (e) Amplitude of the peak ±standard deviation. (d), (f) Peak position with the full width half maximum indicated by the errorbars. All peaks are plotted with their recording time relative to the stimulus application (
 min, red dashed line).
Download figure:
Standard image High-resolution image4. Discussion
In this work, we investigated the variation of growth parameters of phaneroplasmodia representing three different slime mold species. Variations concerned the chemotaxis, velocity, and oscillatory behaviour of the plasmodia. In contrast to the claim that phaneroplasmodia do not provide differential features (like for instance the fruiting body or the spores), we could demonstrate that species- and strain-specific differences exist, when the plasmodia are subjected to controlled conditions for biophysical characterization. For this purpose, we used specifically optimized set-ups and also established new time course analyses of planar plasmodial network development. We compared isolates of the slime molds Badhamia utricularis and Fuligo septica to the plasmodium of the well studied Physarum polycephalum. Consequently, the culturing and experimental conditions were based on the gathered knowledge of P. polycephalum. For instance, only green light was used to illuminate the samples, as it is the wavelength to which P. polycephalum responds the least [28], and both growth and chemotaxis assays were carried out at room temperature and on water agar. These conditions were optimized for P. polycephalum and may not necessarily match the further slime molds investigated in the present study or other Myxogastria. However, the external conditions were kept constant and the investigated Myxomycetes also tolerate a certain range of these conditions [29]. Conclusions can therefore be drawn from quantitatively measurable phenotypic differences. The differences between the species may reflect their phylogenetic relationships (see figure A1, [30]), as measured parameters of Badhamia and Physarum species resembled each other more closely than those of the phylogenetically more distinct genus Fuligo. In fact, whether Badhamia and Physarum should be regarded as two distinct genera or one genus was and still is debated [31]. However, we could also show a strain dependence regarding the oscillatory expansion of the plasmodial front, which differs more between the two isolates, than across the species or even genera. This behavior of B. utricularis Isolate 2 was consistent over 11 growth assays as well as 12 chemotaxis assays (while showing a comparable response to the sugar gradients, itself (figure B6(b))). An oscillatory behavior can still be found in this isolate, but its period is much shorter. Interestingly, while the Isolate 1 plasmodium cycles between fast expansions and periods of no expansion, the Isolate 2 rarely (if at all) reaches states of rest and grows almost continuously. Phenotypic differences of the growth patterns were reported for P. polycephalum [32]. It is worth noting that widespread slime mold species can show cryptic genetic diversity and different morphology [33]. Here, we now quantified a strain difference in B. utricularis, which shows the measurable variety of plasmodial growth across two isolates of the same species.
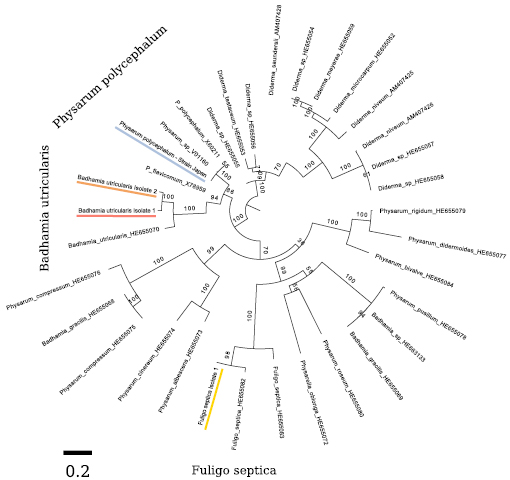
Figure A1. Phylogenetic reconstruction and genetic distance of the investigated strains, in comparison to each other and known sequences of other slime molds. This reconstruction is based on 26 s rRNA sequences and was created using Figtree. The scale indicates the genetic distance by nucleotide substitutions per site. Values above branches indicate the bootstrap support.
Download figure:
Standard image High-resolution imageFuligo septica, on the other hand, even required a different analysis approach to quantify its expansion pattern. It still allowed for area and velocity measurements, but the timescale on which the plasmodium expands may not be suitable for chemotaxis experiments and their time dependent gradient of chemoattractants or repellents. Second, and contrary to the other two investigated slime molds, the plasmodium F. septica did not leave its starting position (over the course of the experiments), but extended and retracted parts of it and possibly explored the surroundings thereby.
Whether these differences between the different phaneroplasmodia have evolved as adaptations in the natural environment remains unclear. The controlled in vitro conditions inside Petri dishes remain inevitably artificial in comparison with the natural environment with all its biotic and abiotic fluctuations. Nonetheless, the presence or lack of plasmodial self-avoidance may have consequences also in nature, and also suggests differences in nutritional preference. Plasmodial self-avoidance of Physarum has been interpreted as an external spatial memory that prevents from repeated foraging of the same area [34, 35]. This would be useful in the case when the nutritional values do not regenerate after slime mold foraging. Lack of such type of memory not necessarily results in foolish strategies, as revisiting the same area could instead be a strategy of Fuligo septica if microbial food regenerates in relatively short time.
With our work, we laid a ground work for future analyses of other slime mold species with well-developed phaneroplasmodia. We are convinced that further interesting differences between the network growth strategies of slime molds may still be discovered or need yet to be quantified. As more slime mold species in the organismal order Physarales can be cultured, they will facilitate comparative biophysical studies. In addition to corroborating our knowledge of basic features of planar network growth and organisation, we may now explore the dimensions of variation.
Acknowledgments
We would like to thank Herbert Koller (Graz) for help building the experimental set-ups and Philipp Resl (Munich) for suggestions and help on the phylogenetic reconstruction. The authors would like to thank Marcus J B Hauser (Magdeburg) and Tetsuo Ueda (Sapporo) for their advices considering the cell culture of P. polycephalum. We thank Karen Alim (Göttingen) and her group for many useful suggestions. The Japan strain of P. polycephalum was kindly provided by Andrew Adamatzky (Bristol). The USA and Australia strains of P. polycephalum were a kind gift of Audrey Dussutour (Toulouse). We thank Maximillian Ahammer (Graz) for collecting the Isolate 2 of B. utricularis. CW, CJG and MG acknowledge financial support by the project PhyChip within the EU-framework FP7.
Conflict of interest
The authors declare no conflict of interest.
Appendix A. Identification of sampled myxomycetes
A.1. Taxonomic identification
For taxonomic identification the respective plasmodia were exposed to visible light and starvation conditions under room temperature to induce sporulation [36]. The fruiting bodies (shown in figures 1(e)–(g)) were identified following the key of [37]. For Fuligo septica, only an aethallium was observed, which is characteristic for the genus of Fuligo within the Physaraceae.
Table A1. Origin of the different used species and the respective strains if existent. The origin is either the sampling site or the donating person.
| Species | Strain | Origin |
|---|---|---|
| Physarum polycephalum | Japan | Andrew Adamatzky, UWE, Bristol, UK |
| Physarum polycephalum | USA | Audrey Dussutour, U Toulouse, France |
| Physarum polycephalum | Australia | Audrey Dussutour, U Toulouse, France |
| Badhamia utricularis | Isolate 1 | Leech Forest, Graz, Austria 2012 |
| Badhamia utricularis | Isolate 2 | Leech Forest, Graz, Austria 2015 |
| Fuligo septica | Isolate 1 | Bretagne, France 2012 |
A.2. Phylogenetic identification
For phylogenetic identification, the plasmodia of all sampled strains were grown on 1.2% agar for 24 h at room temperature. Plasmodia were harvested with a pipet tip and resuspended in 50 μl ddH2O. DNA-extraction was done with QIAGENs Mini-Plant-Kit according to the manufacturers instructions and kept at −20 °C after isolation.
Primers specific for regions in the genes for 18 s, 26 s rRNA and EF-1 were designed by identifying conserved regions of the respective genes by aligning [38] entries of the order of Myxogastria from the NCBI database (table A2)
Table A2. Primers for sequencing Physarum polycephalum, Badhamia utricularis and Fuligo septica. Numbers within the primer name describe the relative position of the primer in the respective alignments. F/FW and R/rev indicate the orientation of the primers as forward or reverse. Temperature values with asterisks represent mean melting temperatures in degenerate primers.
| Primer | Sequence 5'-3' | Temp (°C) |
|---|---|---|
| 18sRNA-100-FW | GGC TCC GCA HAC CAG TTG TAA C | 60.8 |
| 18sRNA-600-FW | GAG GGC GTT AGG GGA MAT ATG AAT G | 58.3 |
| 18sRNA-1600-rev | GCA TAC GTT AAA GTT GTT GCR GTT AAA ACG C | 59.9 |
| 18sRNA-2300-rev | CGA CGG TAT CTG ATC GTC TTC GAD CC | 60.8 |
| 18sRNA-2150-FW | GGA TGT TYG AGG GTG ACC GAA TT | 58.3 |
| 18sRNA-3500-rev | CAC CCA CCA CTT ACA TCA TTG AGT AAA GTC | 58.9 |
| 18sRNA-3400-FW | TAA TTT GAC TCA ACA CGG GAA AAC TCA CC | 59.1 |
| 18sRNA-4300-rev | GGT GTG TAC AAA GGG CAG GGA C | 60.3 |
| EF1alpha-600-FW | CGT TAY GAH GAR ATC GTB TAA GGA RAC YTC | 58.8* |
| EF1alpha-1400-REV | ACA TGG GST TGG ARG GGR HRA | 60.8* |
| Phy26sF1-1440 | GGT AGC CAA ATG CCT CGT CAT CAC | 60.1 |
| Phy26sR2-3110 | GGC CGT TCA GTC TCT GAA CCT T | 59.2 |
| Phy26sF3-3630 | GTT GTT AAT TTG TGA CGC GCA TGA ATG GA | 60.1 |
| Phy26sR4-4080 | GGT CTT CTT TCC CCG CTA ATT GTG C | 60.1 |
| Phy26sF5-4770 | CGC GAG GTG ATT CTA AAG GTG TAG C | 59.3 |
| Phy26sR6-5270 | CCG CGG CTA AGG ATC GTT AAG CC | 62.1 |
| Phy26sF7-5270 | GGC TTA ACG ATC CTT AGC CGC GG | 62.1 |
| Phy26sR8-7820 | CCA CGT CGC TAT GAA CGC TTG G | 60.6 |
PCR was done with Phusion Polymerase (ThermoScientific) with annealing temperatures of 60 °C and extension times of 45 s. PCR products were cleaned with E.Z.N.A cycle pure kit (Omega Bio-Tek) and sent for sequencing (Microsynth). Primers Phy26sF5 and Phy26sR8 gave rise to a 1,6 kb product aligning well with the respective 26 s rRNA gene for Physarum polycephalum, Badhamia utricularis and Fuligo septica in a BLAST search. Primerpairs 18sRNA-600-FW & 18sRNA-2300-rev, 18sRNA-2150-FW & 18sRNA-3500-rev and 18sRNA-3400-FW & 18sRNA-4300-rev produced sequences of 300–600 bp length that overlapped to produce contigs of 1,2 kb for P. polycephalum and B. utricularis. From F. septica template DNA, overlapping sequences were produced from primerpairs 18sRNA-600-FW & 18sRNA-2300-rev and 18sRNA-2150-FW & 18sRNA-3500-rev. The product from 18sRNA-3400-FW & 18sRNA-4300-rev did not overlap with the contig from the the two primerpairs upstream, but nevertheless was identified by BLAST to be part of the 18s rRNA gene of F. septica, therefore the sequence was pasted downstream in the F. septica-contig after the insertion of several Ns as separator. Finally, the primers for EF-1alpha did produce sequences when used in a Touchdown-PCR (58 °C–62° C), but sequencing showed that these were not specific products, probably because of the degenerate nature of these primers. Those sequences were dismissed.
Sequencing data from isolates were used to create alignments with publicly available Myxogastric 18 s and 26 s rDNA sequences using MAFFT [38]. A consensus tree was computed with IQ-Tree [39], based on 1000 ultrafast bootstrap approximations while automatically choosing the best DNA substitution model for the data [40]. Figtree (v1.4.3, [41]) was used to visualize the tree (figure A1).
Appendix B. Experimental set-up
B.1. Growth assay
An image and a corresponding sketch of the experimental set-up are shown in figure B1. The Petri dish containing the respective plasmodium to be imaged was placed without a lid into a larger chamber (a), which fully enclosed the Petri dish as well as a temperature humidity sensor (Seeed studio). The sensor was connected via a Grove Base Shield (V.2, Seeed Studio) to an Arduino UnoTM (b) and recorded the temperature/humidity throughout the entire experiment (RT, humidity 80%–85%). The sample was either illuminated by transmitted light from a circular array of 5 green high power LED's (CreeTM XP-E, Roschwege LSC-G) (c), or by incident light from the top (d). Most data was recorded with transmitted light, while incident light was preferable for special occasions. In both cases, diffusive material was placed within the light path. All images were recorded by an AVT Pike F505B camera (Allied vision) (e) operated through MATLAB and its image acquisition toolbox. Illumination was only turned on during camera exposure (to minimize light illumination). The only exception was the recording of intensity oscillations (at 1 frame per second). LEDs were triggered by MATLAB (Support package for Arduino) through an Arduino controlled transistor circuit.
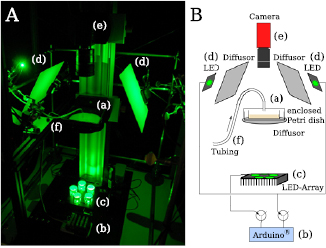
Figure B1. Experimental set-up for growth assays. The set-up is displayed as an image (A) and a respective sketch (B). Components: (a) enclosed Petri dish with sample organism, (b) ArduinoTM, (c) circular array of 5 green high power LEDs for transmitted light illumination, (d) single LEDs for incident light illumination. (e) AVT-Pike F505B camera, (f) inlet and tubing connected to a peristaltic pump.
Download figure:
Standard image High-resolution imageFinally, the experimental set-up as well as the software could be modified, such that next to the growth of the plasmodium, the tube oscillations undisturbed and after the application of a chemical stimulus, could be recorded.
The enclosing chamber would therefore be equipped with an inlet and tubing connected to a peristaltic pump (f), through which a sugar solution could be applied. Exemplary images of such an experiment are shown in figure B2. While recording the growth (as described above) each recorded frame is evaluated. The faster recording of images is triggered as soon as the average intensity in a region lowers with respect to the first frame for at least three consecutive frames. Figure B2(b) (dark gray) shows the network growth (in this particular experiment) which triggered the fast recording of 1000 images at 1 Hz and figure B2(b) (light gray) the situation which triggered the release of 1.5 ml glucose. Sets of 1000 images were recorded before and after the application.
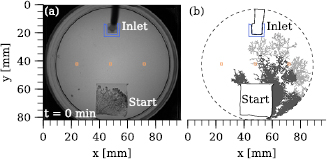
Figure B2. Trigger for fast imaging and stimulus application. (a) Image recorded at the start of an experiment (here: Physarum polycephalum Strain USA), which included fast imaging and the application of a stimulus. Orange and blue indicate regions, which are evaluated every frame for the appearance of a plasmodium. The regions triggering the fast recording were freely selected prior to the experiment (orange). (b) Once the plasmodium (binary mask of the plasmodium is displayed in dark gray) grew within that region the recording of 1000 frames at 1 Hz is triggered. If the plasmodium (light gray) reached the region close to the inlet (blue), it triggered fast recording and the application of ∼1.5 ml 0.1 M glucose.
Download figure:
Standard image High-resolution imageB.2. Chemotaxis assay
The set-up for investigating the chemotaxis of the different plasmodial slime molds is displayed in figure B3. Four individual plasmodia were placed on 1.2% agar in a glass culture chamber (24 × 12 cm) (a), which was covered by transparent foil throughout the experiment. Similar to the growth assay, a temperature/humidity sensor was was placed within the culture chamber and read out by an ArduinoTM (b) over the entire duration of an experiment (RT, humidity 95–100%). The chamber was illuminated by a 3 × 2 array consisting of six green high power LEDs (specifications as above). A diffusor (d) was placed between the LED array and the glass culture chamber. All images were recorded by a DMK 23UP031 (The Imaging Source) camera, which itself was operated via MATLAB and its image acquisition toolbox. The illumination was only switched during camera exposure. LEDs were triggered by MATLAB through an ArduinoTM controlled transistor circuit. About 300 μl of the individual sugar was placed into pre-punched wells ( cm) (figure B3(C) (*)) 1. Two wells were punched on the opposite side to rule out non-chemotactic effects on the migration. The 1 × 1 cm agar pieces carrying the plasmodia (figure B3(C) (#)) were placed approximately 1.5 cm away from sugar source and with an approximate distance of 4.5 cm to each other.
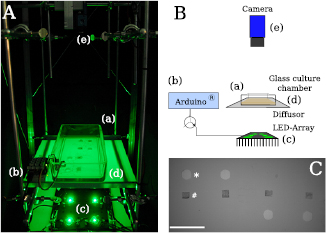
Figure B3. Experimental set-up for chemotaxis assays. The set-up is displayed as an image (A) and a respective sketch (B). Components: (a) glass culture chamber filled with 1.2% agar and the plasmodia, (b) ArduinoTM and connected temperature/humidity sensor, (c) 3 × 2 array of six green high power LEDs, (d) Diffusor, (e) DMK 23UP031 camera. (C) An image recorded at the beginning of an experiment. The 1 × 1 cm agar pieces containing the respective plasmodium (#) were placed approximately 1.5 cm away from the sugar source (*). Scalebar: 5 cm.
Download figure:
Standard image High-resolution imageB.3. Characterization of sugar gradient
To estimate the diffusion of the different sugars in 1.2% agar the culture chamber including the punched wells were prepared as described above. The diffusion over time was evaluated on 0.1 M glucose after 24 h and 42 h, respectively. The piece of agar was excised, stained in 50 ml 0.01 M tetrazolium chloride (TTC, +1 ml 1 M NaOH) for 1 h [21] and imaged afterwards. The resulting images are shown in figures B4(a) and (b). Based on the diffusion profiles (figures B4(c) and (d)) the agar piece carrying the plasmodium was placed at 1.5 cm distance to the sugar containing well (figure B3(C)). Besides 0.1 M glucose, the chemotactic response of Fuligo septica Isolate 1 and Badhamia utricularis Isolate 1 was evaluated in response to 0.1 M galactose, 0.1 M maltose, 0.1 M ribose, 0.1 M lactose and 0.1 M sucrose. The TTC staining of the diffusion after 24 h of the different (reducing) sugars is shown in figures B5(a)–(d) and the respective diffusion profiles are shown in figures B5(e) and (f).
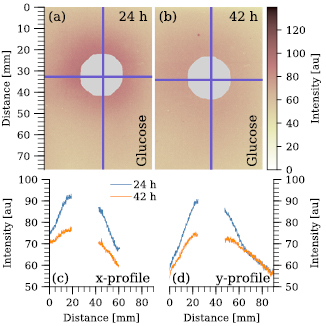
Figure B4. Sugar gradient over time visualized by TTC staining. Diffusion of 0.1 M glucose from the well (gray) into the 1.2% aga, stained by 0.01 M TTC after 24 h (a) and 42 h (b). The blue horizontal and vertical lines mark the position of the x-profiles drawn in (c) and the y profiles drawn in (d).
Download figure:
Standard image High-resolution image
Figure B5. Sugar gradients of different sugars visualized by TTC staining. Diffusion of 0.1 M galactose (a), 0.1 M maltose (b), 0.1 M ribose (c) and 0.1 M lactose (d) from the well (gray) into the 1.2% agar, stained by 0.01 M TTC after 24 h. The blue horizontal and vertical lines mark the position of the x-profiles drawn in (e) and the y profiles drawn in (f).
Download figure:
Standard image High-resolution imageB.4. Evaluation of chemotaxis
To asses the chemotactic migration the binarized masks of each individual chemotaxis experiment were evaluated with respect to its location away from the source. A sketch of the analysis method is given in figure B6(a). First, the radial distance (indicated by white dashed lines) was normalized, such that the center of the source (*) is equal to 1 and the center of the initial transferred culture (#) is equal to 0. Second, a binning of the surrounding area by means of the angle between the initial culture and the source is created (color coded background). A weighting factor weighs the parts of the area, which are located directly towards or away from the source by 1, whereas areas pointing in other directions are penalized by up to 1/2. Each pixel of a binarized mask (black) is then assigned with the product of the normalized distance and the weighting factor. The average over all pixels results in the directionality at time t. The time series is analyzed until the final frame, unless the plasmodium left the area or merged with a neighboring plasmodium.
Figure B6. Evaluation of chemotactic behavior. (a) Each pixel of the binarized mask (black) at a certain point in time is evaluated by its distance to the sugar source (*) and the angle bin (color code) it is located in. The weighting based on the angle is 1 if the network migrates directly towards or away from the source and penalizes growth to the sides by up to 1/2. (b) Chemotactic migration measured as directionality over time (Pp— Physarum polycephalum, Bu— Badhamia utricularis, Fs— Fuligo septica). The color indicates migration away from the sugar well (blue), in distinctive migration (red) or migration towards the sugar well (orange/yellow). Gray areas indicate that the plasmodium was not detected, or left the are of observation. One lane represents one migrating plasmodium in a set of four plasmodia per experiment. Individual experiments are separated by white dashed lines. The lane marked with a star with the column F. septica, contained a B. utricularis Isolate 1, which was placed as a positive control. (c) Scatter plot and mean of the directionality. The points represent the directionality at the end of the experiment, or if reached, the directionality at t = 800 min. The table below gives the number of individual experiments per species and condition. Sugar names are given by their three letter codes and Wat—water.
Download figure:
Standard image High-resolution image