

Abstract
Advanced optical measurement techniques are always of interest for the characterization of engineered surfaces. When pressure or temperature modules are also incorporated, these techniques will turn into robust and versatile methodologies for various applications such as performance monitoring of devices in service conditions. However, some microelectromechanical systems (MEMS) and MOEMS devices require performance monitoring at their final stage, i.e. enclosed or packaged. That necessitates measurements through a protective liquid, plastic, or glass, whereas the conventional objective lenses are not designed for such media. Correspondingly, in the current study, the development and tailoring of a 3D interferometer as a means for measuring the topography of reflective surfaces under transmissive media is sought. For topography measurements through glass, water and oil, compensation glass plates were designed and incorporated into the Michelson type interferometer objectives. Moreover, a customized chamber set-up featuring an optical access for the observation of the topographical changes at increasing pressure and temperature conditions was constructed and integrated into the apparatus. Conclusively, the in situ monitoring of the elastic deformation of sensing microstructures inside MEMS packages was achieved. These measurements were performed at a defined pressure (0–100 bar) and temperature (25 °C–180 °C).
Export citation and abstract BibTeX RIS
Introduction
Three-dimensional (3D) microscopes employing light interferometry provide outstanding surface topography measurements of engineered surfaces. These systems deliver vertical resolution down to a fraction of a nanometer. These measurements are highly repeatable and reproducible, and since they are essentially contactless techniques, no damage occurs upon measurements. White-light interferometric 3D microscopes often use Köhler illumination with light-emitting diodes (LEDs) to create interference fringes around the zero optical path difference (OPD), which is set to coincide with the best focus position of the microscope. A beam splitter divides the beam coming from a light source into two parts. The reference beam is reflected on a reference plane, while the test beam is incident on the test object. The interference occurs when the path lengths of the test beam and the reference beam are nearly matched. By scanning the test beam path length relative to the reference beam, a correlogram is generated [1–6]. Owing to the last decade's advancements to interferometric microscopy, nowadays, not only static but also dynamic objects can be fully analyzed and their vertical and lateral movements can be detected [7].
This surface metrology has become an established method in many industries, including precision machining, microelectromechanical systems (MEMS) and (MOEMS), as well as solar, medical and biological fields. However, some of these devices perform differently once encased in their final packaging, which may include vacuum, elevated temperature and pressure, or special protective environments. In other words, some devices are required to be investigated in their final stage, which implies measurements through a protective liquid, plastic or glass. As an example, biological and some mechanical samples are often immersed in liquid and require measurement through liquid and a pertinent glass cover [2, 6, 8–11].
Since the common objective lenses of the interferometers are not designed for such media, due to the dispersion of the liquid, plastic, or glass, the white-light fringes may be totally washed out. For this reason, compensation objectives need to be inserted into the reference arm of interferometer. One way of dealing with this is to put an equivalent amount of glass and liquid in the reference arm as in the test arm to equalize optical path lengths [3, 12, 13]. This compensation is mostly applicable for Michelson-type objectives. In the literature, there are only a few reports on exploiting Michelson-type objectives for inspection of MEMS and MOEMS packages. In these investigations transparent packaging materials or cover glasses were compensated, by inserting a slide of the same material and thickness in the reference path of the interferometer [3]. However, to the best of our knowledge, no previous reports addressed high pressure and high temperature characterization of devices by means of interferometric microscopy.
The aim of this investigation is to design and tailor a 3D interferometer featuring a pressure chamber as a means for measuring the surface topography of MEMS packages. It is estimated that approximately 50–80 percent of the total cost of MEMS production comes from final packaging and test [3, 14]; therefore, this technique can be an asset in mimicking and predicting the mechanical behavior and hermetic sealing properties of MEMS packages.
Methodology
Optical design
The measurement was performed by employing an MSA-500 micro system analyzer (Polytec GmbH) featuring a green LED 525 nm (spectral width of 510–550 nm) for illumination. The topography measurement is based on white light interferometry. It makes use of a built-in video camera, the LED illumination and a special interference objective scanned by a piezo-driver. For topography measurements through glass, Michelson-type 4×-interferometer objectives contain a slot for a compensation glass to adjust the optical path of the interferometer setup. Dimensions of the compensation glass were adjusted to closely match the optical path length between the test and reference arm. In order to acquire good contrast fringes, the tolerances between the compensating element and the cover glass of the chamber were kept as low as possible and a matched cover glass (borosilicate; BK7) from the same sheet was employed [15].
In the measurement set-up, the sample is positioned on an adjustable pedestal beneath the cover glass and surrounded by a layer of hydraulic fluids. The thickness of the fluid layer (e.g. water) can be altered by changing the height of the pedestal. The optimal thickness of the fluid layer was determined, based on optical path calculations. A schematic demonstration of the interferometer objectives with a compensation glass plate for measurements through the protective glass and water layer is presented in figure 1. The optical path length of the test beam was derived as a function of the thicknesses of water layer  , sample
  and the glass plates (
 and
and  ), as well as the ratio of refractive indices of glass
  to water
  at the average wavelength of 525 nm. Accordingly, the height of the pedestal (D) was extracted from equations (1)–(3).
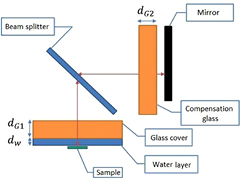
Figure 1. Optical set-up for interferometric measurements through transmissive media.
Download figure:
Standard image High-resolution imageConsidering an ideal case of zero optical path difference (figure 1), which can be described as:

the ideal thickness of the water layer will be expressed, as follows:
Therefore, the exact height of the pedestal, by taking into account all possible discrepancies ( ), can be determined from equation (3):

Instrumentation
The pressure chamber, as shown schematically in figure 2, was designed and fabricated from stainless steel. The chamber comprises an optical access for the microscopic observation, where glass slides in different thicknesses can be inserted. The chamber contains a volume of about 1 cm3 for positioning the samples. A resistive heating rod, driven by a feedback controlled power supply, was incorporated to adjust chamber temperature from ambient temperature up to 200 °C. A type J thermocouple sensing element was located at the inner top side of the adjustable pedestal. Its thermal information was used to control the temperature in the chamber, especially on top of the pedestal. The estimated distance from the sensing element to the specimen was about 0.3–0.4 mm.
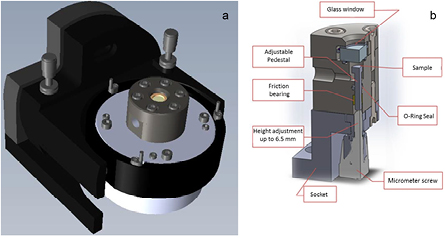
Figure 2. Schematic configuration of the chamber assembly mounted in a goniometer (a) and a cross-section of the chamber (b) the pressurized liquid is injected inside the cavity surrounded by pedestal, sample and the sealed glass window.
Download figure:
Standard image High-resolution imageThe pressure regulator was driven by a spindle pump (MTR mini HD 106, Germany) capable of generating supply pressures up to 100 bar. The pressurized fluid (water/oil) was transferred through a stainless steel plumbing run, and then directed through the orifice.
It is noteworthy to mention that, since the presented chamber was in fact an upgraded version of our initial set-up without temperature module, the medium—water—came to use in the first place. However it was revealed that water cannot be implemented as a medium for higher temperatures. Although above 40 bar water can be kept in the liquid state even up to 200 °C, it gets highly aggressive towards any kind of sealing. Therefore, the medium was changed from water to a hydraulic transparent oil (Di-2-ethylhexyl Sebacate, Hallstar, Inc), generally known as Sebacate. As its boiling temperature is in the range of 232 °C–249 °C, it is well suited for the high temperature measurements. Conclusively, distilled water and the Sebacate were determined as the medium for room temperature and high temperature examination, respectively. The sealing of the chamber at high temperature was facilitated by means of metal c-ring seal on the medium side and a flat metal ring on the glass side, whereas at room temperature silicone rubber seals could be utilized.
It was also found, that the specimen did not necessarily lie flat on the support but rather tilted by some degrees in the horizontal plane. To readjust the specimen in the plane, the whole chamber is mounted into a goniometer with the specimen located at its tilt center, as illustrated in figure 2.
Experimental
A MEMS package with the thickness of 170 µm featuring several sensing microstructures was employed as specimen in this study. The typical feature sizes in this specimen were in the order of 25 µm and below. All the samples were coated with a conformal layer of platinum (10 nm in thickness) to ensure high reflectivity. These thin and flexible sensing microstructures, which will be denoted as 'beams', are elastically deflecting when the corresponding package is exposed to hydrostatic pressure. The measurements were carried out with a speed of 3 µm s−1 and a sampling increment of 89 nm. In the second part of this study, the accuracy and tolerances of the measurements were evaluated via a standard step-height measurements. Correspondingly, a reference step-height sample (Silicon, CTR AG) and a stylus profilometer (DektakXT, Bruker) were utilized.
Correction of depth measurements
Optical path length  for a homogenous medium is the product of the geometrical path length
  and the index of refraction of the medium:

Optical path length concept is significant because it helps to determine the phase of light which governs the interferences of light. If a wave travels through various media, then the optical path length of each medium needs to be calculated to discover the total optical path length [16, 17].
The refractive indices of air, water and Sebacate oil were 1, 1.33 and 1.45, respectively [18]. Correspondingly, the real deflection of the beams  which is defined as the difference between the initial position of the structure at 0 bar (
 ) and the position under pressure at n bar
  is associated to the optical thickness in water and oil by:
Results and discussion
Surface topography of MEMS packages
The elastic deflection of the beams induced by hydrostatic pressure was investigated at different pressures up to 100 bar. A small pressure load step was used to ensure a linear elastic response of the specimen. 3D images of the sample under 0, 20, 30 and 100 bar are depicted in figure 3, rendering the deflection of the beams in accordance to the applied pressure. As one can perceive, under dynamic pressure, the beams underwent elastic deformation, yielding to transformation from a planar structure to a saddle-like configuration.

Figure 3. 3D interferometric images of the specimen under 0, 20, 30 and 100 bar pressure.
Download figure:
Standard image High-resolution imageThe deflection induced by pressure in the middle of beam was successively derived from the measurements by data analysis software (TMS 3.5, Polytec). In figure 4 the average deflection of a typical beam versus the applied pressure is plotted. The specimen was pressurized up to 100 bar and depressurized down to 0 bar without any detectable crack formation through the beams, which verified the functionality of the package under pressure. As a result of this in situ monitoring, an in-depth understanding of deflection and mechanical stability of the sensitive beams under pressure was achieved. Hence, the proposed technique was proven to be a versatile, nondestructive method for performance monitoring and reliability testing of these specimens.
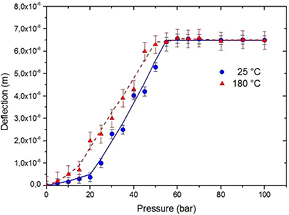
Figure 4. The average deflection of a typical beam versus pressure at 25 °C (room temperature) and 180 °C.
Download figure:
Standard image High-resolution imageRepeatability of the measurement system was verified by measuring the deflection of several packages under the pressure span. Analogous to room temperature measurements, the deflection regime of the specimen was also assessed at elevated temperature. As aforementioned, with respect to the measurement media at elevated temperature, water was substituted with oil. Figure 4 compares the average deflection of a typical beam at 25 and 180 °C. As implied from this plot, the deflection of the beam at 180 °C is higher than the one in room temperature, which can be attributed to the temperature-dependence of the Young's modulus.
Measurement tolerances and resolutions
Measurement tools and systems have always some tolerance and disturbance that will introduce a degree of uncertainty [19, 20]. In order to evaluate the precision of measurements, especially at high temperatures and pressures, a step-height reference sample was utilized as shown in figure 5(a). The nominal height of this step was validated by the stylus profilometer to be 2.82 ± 0.05 µm in air, thereby 4.095 in oil after deploying equation (5). This nominal height is depicted as a line in figure 5(b) together with the measured values up to 180 °C. As one can see, the results were highly reliable with a measurement tolerance (standard deviation) of less than ±0.4 µm. As implied from this figure, both measurement accuracy and precision, i.e. deviation between the measured and actual values and the spread of the measured values respectively, were slightly affected by the temperature change. As a matter of fact, due to a light dispersion phenomenon, the quality of signals at high temperature was lower than that of room temperature. This phenomenon corresponds to the unwanted scattering as some light rays might bend a way when they pass through an inhomogeneous path from colder area (higher refractive index) to the warmer area adjacent to the heated chamber. Possible fluctuation in the fluid layer due to a temperature gradient which can be ascribed to the Rayleigh–Bénard convection effect [21] and irregularities in the refractive index of this layer can also be postulated as the reasons for weaker signals at higher temperature. The precision of high temperature measurements were further improved by a spike removal filtering. No systematic error due to a thermal drift effect [22] was detected, that could be attributed to the large distance (>40 mm) between the measuring unit and the locally heated area inside the chamber. Moreover, no systematic shift in the refractive index of the Sebacate oil was identified in the temperature and pressure span of measurements, at least to the detection limit of the instrument. The results also indicate a measurement tolerance of ±0.4 µm over the whole pressure range, revealing no discernible effect of pressure on the precision of the measurement.

Figure 5. Step-height measurements; 3D interferometric image of the corresponding reference sample (a) and the variation in the measurement results obtained at different temperatures (b).
Download figure:
Standard image High-resolution image
The lateral resolution of the measurement is dependent on the objective itself. By using the 4× objective, the lateral resolution (pixel size) for the measurements is 1.6 × 1.6 µm, while the field of view will be as big as 2.2 × 1.7 mm. As a matter of fact, higher magnification objectives could lead to a superior lateral resolution in the range of 100 × 100 nm, however the field of view would be limited down to 180 × 130 µm.
Conclusion
In this study interferometric optical microscopy was proposed as not only a means for topographical measurements at ambient condition, but also a robust and versatile tool for characterizing the behavior of microstructures under defined temperature and pressure conditions. An optional through-transmissive-media interferometric Michelson-type objective, which consists of an optical compensator to enable measurements through transmissive-media, was employed. A novel instrumentation configuration, which facilitates in situ analysis of samples of interest under controlled temperature and pressures, was developed. The effects of immersed medium and temperature on the depth measurements were also studied and corresponding correction factors were applied to the measurements performed in water and oil.
Acknowledgments
This project has been supported by the COMET K1 center ASSIC (Austrian Smart Systems Integration Research Center). The COMET (Competence Centers for Excellent Technologies) Program is supported by BMVIT, BMWFW and the federal provinces of Carinthia and Styria.