
Abstract
The integration of increasingly complex functionalities within thermally drawn multi-material fibers is heralding a novel path towards advanced soft electronics and smart fabrics. Fibers capable of electronic, optoelectronic, piezoelectric or energy harvesting functions are created by assembling new materials in intimate contact within increasingly complex architectures. Thus far, however, the opportunities associated with the integration of cantilever-like structures with freely moving functional domains within multi-material fibers have not been explored. Used extensively in the micro-electromechanical system (MEMS) technology, electro-mechanical transductance from moving and bendable domains is used in a myriad of applications. In this article we demonstrate the thermal drawing of micro-electromechanical fibers (MEMF) that can detect and localize pressure with high accuracy along their entire length. This ability results from an original cantilever-like design where a freestanding electrically conductive polymer composite film bends under an applied pressure. As it comes into contact with another conducting domain, placed at a prescribed position in the fiber cross-section, an electrical signal is generated. We show that by a judicious choice of materials and electrical connectivity, this signal can be uniquely related to a position along the fiber axis. We establish a model that predicts the position of a local touch from the measurement of currents generated in the 1D MEMF device, and demonstrate an excellent agreement with the experimental data. This ability to detect and localize touch over large areas, curved surfaces and textiles holds significant opportunities in robotics and prosthetics, flexible electronic interfaces, and medical textiles.
Export citation and abstract BibTeX RIS

Original content from this work may be used under the terms of the Creative Commons Attribution 3.0 licence. Any further distribution of this work must maintain attribution to the author(s) and the title of the work, journal citation and DOI.
Introduction
The recent development of fiber processing technologies has enabled the fabrication of fibrous structures with increasingly complex functionalities. In particular, the thermal drawing process used to fabricate optical fibers has experienced a series of breakthroughs that have extended the range of cross-sectional architectures and materials that can be integrated in fibers [1–3]. Thermal drawing traditionally consists of fabricating a macroscopic version of the targeted fiber out of thermoplastic or glassy materials that can be plastically deformed at high viscosities over a relatively large temperature window. The preform is fabricated at the macroscopic scale that enables us to assemble materials and realize architectures with sub-millimeter feature sizes in straightforward ways. Fiber pulling results in a drastic reduction of cross-sectional dimensions bringing materials together at the microscopic scale, while expanding uniformly along kilometers of fiber length (see figures 1(a) and (b)). The first significant breakthroughs in optical fiber processing, which contrasted with conventional step-index solid core silica fibers, were the fabrication of 1D and 2D photonic crystal fibers [4–7]. This marked the beginning of a deeper interest, not only in the functionality of the fabricated fibers and in particular the engineering of their optical properties, but also in the materials and the physical processes at play behind the fabrication technique. Photonic crystal fibers integrate hollow micro-channels with diameters down to sub-micrometer in feature sizes that reproduce uniformly along kilometers of fiber length. Bragg mirror fibers exhibit a periodic structure of concentric layers of high index of refraction glasses and low index polymers with thickness down to a few tens of nanometers, again reproduced along extended lengths of fibers. The ability to fabricate such remarkable structures with a simple and low cost process stems for a large part from a controlled interplay between the viscosity and surface tension. The understanding of the viscous flow and surface science at play in this approach has also led to the design and fabrication of fibers with new materials. It was shown in particular that crystalline materials, if encapsulated well within cavities with high viscosity boundaries, can be integrated and flow as a low viscosity melt during the fiber pulling down to the micrometer scale before capillary break-up [8]. This has been exploited in optics for the fabrication of solid core polycrystalline semiconductor fibers [9, 10]. It has also led to the design of optoelectronic fibers that can not only guide light but also exhibit a variety of novel functionalities, such as optical [11–14], heat [15] or chemical sensing [16, 17], piezoelectric actuation [18, 19], surface emitting fiber lasers [20, 21], advanced optical probes [22, 23] or field effect and phase change based devices [24, 25]. Polymer fibers with electrically conducting domains can also be used in optical imaging systems [26], or in purely electronic functions, such as touch sensing [27, 28] or capacitors [29].
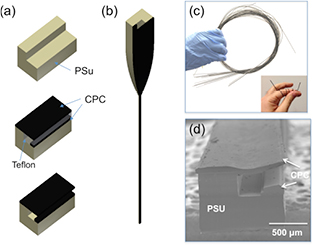
Figure 1. Fabrication of a MEMF device. (a) Schematics of the preform fabrication that starts with the machining of a PSU plate in an L-shape block, the positioning and hot pressing of the CPC sheet and bus, with a Teflon domain to transfer pressure to both CPC regions, and finally a mechanical removal of the Teflon domain. (b) Schematic of the preform-to-fiber thermal drawing. (c) Photographs highlighting the extended length of fibers fabricated in a single draw and their flexibility. (d) SEM micrograph of the cross-section of a MEMF fiber.
Download figure:
Standard image High-resolution imageSo far, however, all novel fiber designs have relied on materials organized in intimate contact to deliver a specific functionality. The concept of electromechanical transduction from freely moving functional domains within multi-material fibers has not been exploited. This approach is used in a myriad of configurations in the micro-electromechanical system (MEMS) technology, such as cantilever-based devices for micro-sensors and actuators. The ability to integrate such advanced systems within extended lengths of flexible fibers can bring a breadth of novel opportunities for functional fibers and fabrics. Here, we demonstrate for the first time a micro-electromechanical fiber (MEMF) device that exploits the bending of a freestanding electrically conductive polymer sheet (figure 1). Under mechanical pressure, the conducting sheet can bend and be brought in contact with another electrically conducting domain, generating an electrical signal that can reveal the pressure. We show that such fibers enable the detection and localization of a pressure point along the entire fiber length with sub-millimeter resolution. Beyond the simplicity and scalability of the fabrication process, MEMF devices are the first 1D systems that can sense and localize pressure and touch without the need for 2D grids, at (a) very low energetic consumption, and with such a high resolution. This paves the way towards novel advanced fibers and fabrics capable of functionalizing large area surfaces and textiles with pressure mapping capabilities.
Methods
Preform and fiber fabrication
The fabrication approach and fiber architecture of the MEMF device are shown in figure 1. We start by machining a thermoplastic plate, here polysulfone (PSU), in an L-shape cross-sectional structure (figure 1(a)). For the conducting material that will deliver the desired electronic function, we choose a carbon black loaded polycarbonate (CPC) composite. CPC has been exploited for its electrical conductivity and in particular its linear resistance, and for its compatibility with the thermal drawing process [30]. Indeed, the thermoplastic matrix ensures the compatibility with the thermal drawing process at a glass transition temperature close to the one of PSU, while the carbon black filler provides a percolated path for a sufficient electrical conductivity. A CPC bus is placed on the long edge of the L-shaped PSU, while a thin CPC sheet is positioned above it on the short edge as shown in figure 1(a). A Teflon plate is at the same time machined and positioned so as to support both CPC domains during their hot pressing against the PSU construct to fabricate the preform. Hot pressing is performed in a vacuum and at a temperature of 220 °C in a specially designed laboratory press (Lauffer Pressen UVL 5.0, Maschinenfabrik Lauffer GmbH & Co. KG, Germany).
After the preform is consolidated, the Teflon part is mechanically removed (figure 1(a)). The assembly is subsequently thermally drawn in a custom-made draw tower at a set temperature of 260 °C that enables the co-drawing of both PSU and CPC (figure 1(b)). A feeding speed of 1 mm min−1 and a drawing speed between 0.1 m min−1 and 1 m min−1 were used. As shown in figures 1(b) and (c), and as discussed below, the thermal drawing results in an extended length of the flexible ribbons that maintain the exact cross-sectional shape of the initial preform.
Fiber structure characterization
Scanning electron microscopy (SEM) was used to image the fiber cross-sectional architectures. The sample was coated with a 10 nm carbon film before being transferred into the vacuum chamber. The SEM images were taken with a Zeiss Merlin field emission SEM (Zeiss, Göttingen, Germany) equipped with a GEMINI II column operating at 2.0 kV with a probe current of 150 pA.
Electro-mechanical fiber response
The fiber response to touch was characterized by measuring the electrical response to the local application of pressure. An Electromechanical universal testing machine (UTS) from Walter + Bai AG (Series LFM-125 kN) was used to vertically move a flat rod (4-mm wide) that was placed in contact with the top side of the fiber. The testing machine enabled down to 1 µm steps for this vertical motion. The CPC bus and sheet were individually connected to a metal wire at both ends of the 85 cm long fiber piece using silver paint. An Agilent E3612A DC power supply was used to apply a tension of 10 V, and the currents i0 and iL were measured as shown in figure 2 and explained in more detail below, with a Keithley 2450 Sourcemeter and a Keithley 6517B Electrometer.

Figure 2. Pressure detection and localization: (a) schematic of a pressure sensing ribbon with local pressure bending the CPC film at position x; (b) schematic of the equivalent circuit when a potential is applied at one fiber end and pressure is applied at a position x along the fiber length. (c) Top: schematic of the equivalent circuit used to localize pressure. Bottom: graph of the measured iL (in wine, scale to the right) that raises as the probe is brought down on the MEMF device. The current ratio β is also shown (left scale) that reveals that it is independent of the pressure applied. (d) Measured position versus real position extracted from the measurement of β for pressure applied along an 85 cm long fiber.
Download figure:
Standard image High-resolution imageNoise current was measured by recording over one hour the highest current measured between i0 and iL for a pressure point close to the contact, at a DC applied voltage of 10 V. From a statistical analysis we could extract the standard deviation of the current fluctuations, which we defined as our noise current. For the conservative assessment of the device spatial resolution we derive below, the highest noise we could measure was around iN = 0.1 nA.
To measure the time response of the device and obtain a first assessment on its robustness under many bending cycles, we adapted a Dynamic Mechanical Analysis set-up (TA Instrument DMA Q800) to apply a pressure at 200 Hz on the fiber. We used the DMA in compression mode with a 25 µm amplitude, fixing the fiber between two soft PDMS plates of 1 mm in thickness. The fiber was connected to an oscilloscope with a 1 V DC applied.
Fiber piano device
To demonstrate the ability of the fiber to be employed as a 1D touch sensor, a 'piano device' was fabricated by connecting a fiber piece to a voltage divider circuit to extract the electrical resistance, hence the position of the touch. This circuit was combined with an Arduino Leonardo microcontroller, which was programmed to match different positions of touch on the fiber to pitches played by a piezo buzzer. The piece of music 'Ode To Joy' (Beethoven) was played and a video recorded (see supplemental information (stacks.iop.org/JPhysD/50/144001/mmedia)).
Viscosity measurement
The viscosity of CPC was measured with a Rheometer AR2000 (TA Instrument) in a flow procedure with shear rate being set at 2.5 s−1 and temperature varying from 220 °C to 280 °C.
Results
Fiber fabrication
In figures 1(c) and (d) we show that an extended length of highly flexible ribbons is produced with a cross section that remarkably maintains the initial architecture of the preform. All dimensions have rescaled following the same draw down ratio α, a quantity defined as the ratio between the width (or height) of the initial preform to the width (or height) of the ribbon. Note that by a simple mass conservation principle, the ribbon length scales as α2 times the length of the initial preform, highlighting the scalability of the process. The particular microstructure of the ribbon cross-section is shown in figure 1(d) with a SEM micrograph of the MEMF cross-section. The two CPC domains are clearly visible, separated by a micro-cavity that allows the thin upper CPC sheet to bend when pressure is applied, and recover its initial horizontal position upon removal of the mechanical excitation. This mechanical behavior enables us in turn to exploit such architecture for pressure sensing. As the CPC layer touches the CPC bus underneath, an electrical connection can occur and a current can flow from one CPC domain to the other, signaling the local pressure.
Pressure localization
In figures 2(a) and (b) we show a schematic of such a deformation as well as the equivalent electrical circuit for consideration. When a potential difference is applied at one fiber end, one quickly realizes that the current generated will depend upon the position along the ribbon axis (x-axis in the schematic). Indeed, the CPC film and bus act as linear resistors and the further away from the applied potential, the higher the equivalent resistance of the circuit. If the potential is applied at a position x = 0 as shown in figure 2(b), the resistance of the CPC top film Rf(x) and bottom bus Rb(x) are simply given by  and
and  where
where  is the resistivity of CPC and was measured to be quite uniform along the fiber length and equal to around 1 Ω · m. Sf and Sb are the cross-sectional surface areas of the CPC film and bus respectively. Note that we consider in this article that the width of the pressure applied along the fiber axis is very small compared to the fiber length, so that the position x of an applied pressure is well defined.
This measurement would not however be sufficient to extract both the presence and position of any pressure applied to the electro-mechanical ribbon. Depending on the pressure intensity, the contact resistance Rc between the CPC film and bus can vary. We hence propose another circuit configuration that enables us to measure two different currents out of which the position can be specified regardless of the applied pressure. In figure 2(c), we show the equivalent circuit for this approach where we add a connection to the CPC bus at the other extremity from the applied voltage. We can measure independently the two currents flowing in parallel i0(x) and iL(x). Taking their ratio  eliminates the unknown voltage drop (unknown because it depends on both the position x and Rc) and is simply given by the ratio of the two resistance
  and
and  . Using the expressions of Rb as a function of x given above immediately gives:
To verify our reasoning that the ratio β is indeed independent of the applied pressure, we plotted in the graph of figure 2(c) the measured iL current and the ratio β as a function of the position of the probe that pushes down on the ribbon. At a position of 0 µm, the pressure is just high enough for the two CPC domains to touch each other. This lower limit of pressure sensing corresponds to a Force of around 0.3 N, or a pressure of around 50 kPa, considering a surface area of 4 mm (probe width) times 1.5 mm (fiber width). As the probe is brought down and its position increases from 0 to 4 µm, a higher pressure results and hence a lower Rc, increasing the current iL(x, Rc) as seen in the graph. Measuring i0(x, Rc) at the same time and plotting the ratio β shows, however, that this ratio remains unchanged as the pressure is increased. The measured position x from our model is therefore only a function of the position of the applied pressure. In figure 2(d) we show a plot of the measured position versus the actual position of the probe along an 85 cm long MEMF device. The straight line represents the actual position of the probe during the experiment, while the blue squares are the values of the positions obtained from equation (1) and the experimental measurements of the β ratio, for a length L of 85 cm. An excellent agreement is obtained, with a slight shift due to the size of the contacts at the fiber edge and the fact that they are not exactly situated at x = 0 and x = L. Note that, from an engineering point of view, this slight shift can be suppressed by calibrating the response of the fiber, since each pressure location is indeed associated with a single β ratio. The error on the position can then only come from the noise current associated with the measure. Moreover, knowing the location now enables us to find  and
and  , and to extract the contact resistance Rc from the value of i0(x) for example (
 ). The applied pressure, knowing the probe size, can then be evaluated from calibration with the respective Rc. This can be done over a narrow band of applied pressure, between around 0.3 N and 0.6 N for the particular fiber tested, as it saturates quickly with the increasing force applied (see figure 2(c)).
Spatial resolution
To assess the spatial resolution of our device, we adopt a very conservative approach to define the noise current as the highest noise measured (worst case scenario) of iN = 0.1 nA and consider this the maximum fluctuation for both i0 and iL for all the measurements made at each pressure position. The uncertainty over the ratio β is again assessed conservatively by considering that it would be comprised between the maximal ( ) and minimal values (
 ) given the associated noise. The resolution over x being given by
  , we can write neglecting the terms in
  :
:
So

and gives  . Considering the maximum noise value (iN), and the data collected for iL at every position x, we find the value of
  always below 0.5 mm. This conservative evaluation of the resolution can be experimentally verified by recording the currents over an extended period of time (10 mn in this case) for two positions of the probe spaced by a distance above this conservative value, say 0.75 mm. In figure 3(a) we plotted the histogram of such a measurement that shows the number of counts for a certain value of the current versus the position of the pressure applied. The standard deviation of each measurement gives the noise of the system. Clearly, the distance between the average current for the two different positions is much greater (around 40 times greater) than their standard deviation, meaning that the two positions can be separated. This means that the position of the center of an excitation can be known with such precision, if the width of this excitation is very small compared to the fiber length, or if the type of excitation is known (such as the touch of a finger, see the discussion part below). If the excitation has a large unknown width, the system can be adapted to measure both the center position and width of the excitation, very similarly to the reconstruction of two different pressure points, as we discuss below. Note also that simple noise management techniques could lead to even better resolutions, potentially in the sub-hundred micrometer range.

Figure 3. (a) Frequency counts of the generated current values recorded over 10 mn versus position of the applied pressure at two different locations. (b) Voltage response versus time under oscillating mechanical excitation at 200 Hz. The main graph shows the experimental data (black squares) and the exponential fit (red curve) for part of the cycle, while the inset shows two full cycles. (c) Graph representing the reconstruction of two pressure points applied along a 12 cm fiber. The black line represents the pressure distribution in an arbitrary unit while the blue dots correspond to the extracted measurements.
Download figure:
Standard image High-resolution imageDynamic response
The inset of figure 3(b) shows the voltage response over time for a fiber exposed to a cyclic load in compression, as described in the method section. In the main graph we plotted the experimental recording for part of the cycle (black squares) and the exponential fit (red curve). We could extract a response time of 57 µs. We also noted no drift, change of response or damage to the fiber after 104 cycles, highlighting the robustness of the fiber device.
Multiple pressure points
The analysis we performed to localize a pressure point revealed that, assuming a small pressure area, localization is simply performing the measurement of independent currents that can resolve an equation with two unknowns, namely the pressure value (linked to the contact resistance) and the position. It is straightforward to expand this approach to multiple excitations, particularly when the pressure is high enough so that the contact resistance saturates and affects the measurement less than the probe size. In such a configuration, two pressure points bring only two unknowns to the system (their positions) that the two current measurements can be used to resolve. Instead of deriving the simple circuit analysis done previously, here we take the approach of calibrating a 12 cm long fiber subjected to one or two simultaneous pressure points. We measured and recorded the currents generated i0 and iL for one and two pressure points spaced by 5 mm (mimicking an application with a finger touch of around 10 mm in width). After this calibration, we subjected the fiber to two events represented in figure 3(c) by black curves with an arbitrary pressure value of 1 at the contact point. On top, we show an excitation by a single pressure point, and below an event with two pressure points. In blue we indicated the reconstructed localized pressure on the fiber for these two events using the calibrated values. The system could sense if one or two touches were present, and the detected positions correspond very well with the excitation to be resolved. We performed a series of similar experiments and found that the calibration was robust and a resolution of ±3 mm could be achieved to resolve the position of the center of two excitations.
Discussion
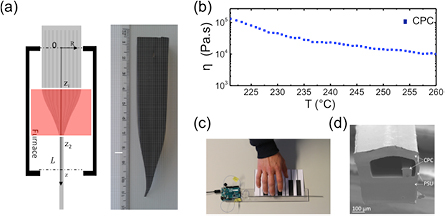
The ability to realize a fiber device with such a complex microstructure is firstly a result of the particular attributes associated with the drawing process. To maintain the cross-sectional shape during thermal drawing, it is essential to pull the fiber at a high viscosity to avoid any thermal reflow, deformation or capillary break-up of the thin CPC sheet and square bus. To understand why the particular structure we demonstrate here can be maintained and not collapse or deform, a rather intuitive method is to compare a theoretical characteristic time associated with the reflow to the time the material experiences at high temperature in the neck-down region. In figure 4(a) we show a schematic of the thermal drawing process where the neck-down region is highlighted in red. This region defines when the polymers start to flow and deform, until it reaches the final fiber diameter at the output of the furnace. The processing time in the neck-down region is given by  (see figure 4(a)), where v(z) is the velocity along the z axis, considered here to be only a function of z. At z = z1, the velocity corresponds to the imposed down-feed speed vDf, the speed at which the preform is fed into the furnace. At z = z2, the velocity is the drawing speed, the speed at which the fiber is pulled. In between, the velocity changes gradually as the radius R(z) of the cone is reduced, with a simple relationship between these two quantities that results from volume conservation:
  , where R is the diameter of the preform at z = z1. In figure 3(a) we also show a picture of the MEMF preform-to-fiber region obtained by interrupting the draw. The tip of the structure is slightly bent due to an elastic bounce back when the fiber is cut. Nevertheless, one can extract a discrete approximation of the function R(z) that enables us to estimate the dwelling time
  to around 103 s.
Figure 4. Fabrication and application. (a) Left: schematic of the preform-to-fiber structure highlighting the neck-down region in red. Right: photograph of the preform to fiber MEMF device. (b) Experimental data of the viscosity of CPC around the drawing temperature. (c) Picture of the fiber piano device (see the video in the supplementary material). (d) SEM micrograph of an enclosed micro-electromechanical fiber design.
Download figure:
Standard image High-resolution image
A characteristic reflow time can also be estimated from simple theoretical analysis and experimental measurement. First, a dimensional analysis [8, 31] enables us to write a characteristic time τ from the viscosity, surface tension and feature size:  , where C is a dimensionless number, η is the viscosity (in Pa.s), λ a characteristic dimension (in meters) and γ the surface tension (in N.m−1). Such a formula has shown to be valid for the capillary break-up of thin films [31] as well as for the reflow of periodic textures at the surface of a polymer (C = 1/π) [32]. The specific dynamics of a thermal drawing experiment again imposes to define a weighted characteristic time since the viscosity and feature sizes are a function of the position z in the furnace (we neglect the change of surface tension with temperature). In figure 4(b) we show the measurement of the CPC viscosity versus temperature. We also measured the maximum of the temperature inside the furnace (230 °C) and extrapolate a temperature profile for thermal drawing:
  . We can then express the reflow time as:
  with
with  . With
  , a length scale λ of 100 microns at the fiber level, and using the same drawdown ratio as above, we obtain an estimation of
  , an order of magnitude higher than the dwelling time. Even with the approximations made, it is apparent that the time scale associated with any reflow or break-up of the CPC domains is greater than the time it takes to go from the preform into a fiber shape. Reflow or capillary break-up do not have time to occur, ensuring that at these length scales the cross-sectional architecture is maintained.
The thermal drawing of such complex structures enables us for the first time to detect and localize pressure along a single functional fiber. Previous work has reported a capacitive approach that requires a conductive probe (or a finger) to press and then slide on the fiber to extract a location [27]. Other approaches have relied on fiber grids to localize an excitation [13, 28, 33]. The approach we demonstrate here has several advantages compared to existing configurations. First, it does not require a conducting probe to sense and localize pressure, nor does it require a fiber mesh. This drastically reduces the number of contacts to be made to the fibers, hence improving integration. The accuracy with which one can localize pressure is far beyond what is needed in most practical applications, given the very low noise of the system. Moreover, we showed that a single fiber can sense and localize two pressure points simultaneously applied along its length, which was not possible to do with previous configurations. By integrating more electrodes or more contacts along the fiber length, a greater number of independent currents could be measured and hence complex pressure distributions could be extracted. It is also interesting to note that if we could localize two pressure points of small width, it would also be possible to extract the center and location of an excitation with a large width. This could be very interesting for medical applications, such as pressure ulcer prevention discussed below, where large area pressure on the body could be sensed and localized precisely using a system simple to fabricate, integrate and use. Moreover, the device is an open circuit at rest, consuming very little energy for its functioning to the contrary of other capacitive or piezo-resistive based devices.
The ability to have a single fiber capable of detecting and localizing pressure in a straightforward and easy to interface way can have an impact in many fields of applications, such as in healthcare, smart textiles and entertainment. Note that we refer to 'detecting' pressure, even though over a small range of applied pressures we showed that we could also measure its intensity. This range is however relatively small in the current configuration, but could be improved with more advanced designs discussed below. For several applications, such as flexible and foldable keyboards, or ergonomic textile-integrated electronic interfaces, however, detecting pressure points regardless of the intensity is sufficient. In the medical field, the ability to cover a very large surface area, such as hospital bed sheets or chairs, enabled by the fiber format, could be very useful for the prevention of diseases, such as pressure ulcers. These are hard to treat diseases associated with extended periods of immobility and pressure against the skin that fabric-integrated MEMF devices could monitor and help prevent. In figure 4(c) we show a picture of a device that highlights an example of the advanced functionality that a single all-polymer MEMF can do. As we show in the movie provided as supplemental information, we can assign to a location on the fiber different notes via different frequencies from a piezoelectric buzzer, fabricating the first 'piano fiber'. With the ability to sense more than one pressure point, more complex operations could be realized in the field of flexible electronic interfaces.
The mechanical behavior of the CPC film in MEMF ribbons has proven to be very robust. More accurate characterization of the mechanical robustness to a large number of bending cycles is underway, as well as the use of thinner freestanding sheets to further improve the MEMF response to pressure, its bandwidth and resilience. One difficulty that can be envisioned is the open structure of the cantilever-like design. An encapsulated system with a thin membrane that would protect the fiber from external debris or liquid (when washed if integrated in a textile, for example) could ensure a better protection for the functional parts. In figure 4(d) we show the cross-section of a fabricated fiber with an encapsulated design where a thin PSU wall was left to enclose the fiber cross-section. Tens-of-meters of such fiber were produced with a height down to 300 µm and a PSU enclosing layer as thin as 5 µm. This fiber can perform exactly the same functionalities as the cantilever-like fiber, but due to the rigidity of the PSU film and the mechanical excitation, the structure failed after a few thousands of cycles. We are looking into the thermal drawing of softer materials as the next generation of touch sensing fiber devices, which could exhibit the same advanced pressure localization capabilities but with an encapsulated designed.
Finally, given the flexibility of the design at the preform level, many other configurations with thinner films, smaller gaps between the two conducting domains, or the integration of several pressure sensing elements in a single fiber or ribbon can be realized. This could result in advanced and robust fibers capable of measuring, with high sensitivity, the intensity but also the location, direction and nature (shear versus compression) of an arbitrary mechanical excitation.
Conclusion
In conclusion, the thermal drawing process was used to fabricate a polymer based micro-structured ribbon with domains that can move upon mechanical excitation. This movement can bring two conducting composites in contact and trigger an electrical signal that is exploited to sense and localize the applied pressure. We established a configuration and a model to extract not only the presence but also the position along the fiber axis of the applied pressure regardless of its intensity, and at a sub-millimeter resolution. We showed that these fiber devices were unaltered after 104 loading cycles at 200 Hz, that they could recognize and localize two pressure points, and that they exhibited a response bandwidth of close to 20 kHz. An important aspect of the thermally drawn MEMF devices is the scalability at which fiber length and hence also surface area can be produced. While several strategies have been proposed to sense and sometimes map pressure using piezo-resistive, piezo-electric or capacitive approaches, very few share the attributes of the simplicity and low cost of the thermal drawing process. This is key for applications that require the functionalization of very large area surfaces. Ongoing research further investigates the mechanical attributes of MEMF devices. Other designs highlighted in the discussion part with thinner freestanding sheets, softer materials or encapsulated architectures are also under investigation, paving the way towards novel functionalities, such as a controlled release from partly closed cavities, or advanced functional surfaces for electronic skin applications.
Acknowledgments
The authors are very grateful to the staff of the Center for electron Microscopy (CIME) and of the ATMX (EPFL-IMX) for their help in making preforms and characterizing the fibers. We also acknowledge the Swiss National Science foundation (grant 200021_146871), and the European Research Council (ERC Starting Grant 679211 'FLOWTONICS'), as well as the CCMX Challenge 'Self-care materials' fund.
Footnotes
- *
This article belongs to the Special Issue: Emerging Leaders, which features invited work from the best early-career researchers working within the scope of J. Phys. D. This project is part of the Journal of Physics series' 50th anniversary celebrations in 2017. Fabien Sorin was selected by the Editorial Board of J. Phys. D as an emerging Leader.