
Abstract
Detailed knowledge of the inner-shell atomic structure of lowly-ionised species is lacking for most elements along the sixth row of the periodic table, from hafnium to bismuth. This paper presents 4f-photoabsorption spectra of Pt+ to Pt4+ ions, recorded between 69 and 127 eV (9.8 nm and 18 nm) using the dual laser plasma method. Analysis of the spectra was supported by atomic structure calculations using the Cowan suite of codes, by relativistic time-dependent local-density approximation (RTDLDA) calculations, and by comparison along isoelectronic series, particularly with spectra of lowly-ionised gold plasmas. The RTDLDA calculations account for the influence of photoionisation and photoexcitation on the recorded spectra. The spectra show 4f  5d, 6d, and 7d transitions, broadened by autoionisation.
Export citation and abstract BibTeX RIS

Original content from this work may be used under the terms of the Creative Commons Attribution 4.0 license. Any further distribution of this work must maintain attribution to the author(s) and the title of the work, journal citation and DOI.
1. Introduction
Elements from hafnium to bismuth in the sixth row of the periodic table have full 4f subshells, and display an increasing occupancy of the 5d subshell as far as iridium (Z = 77), where the binding energy of the 5d subshell crosses the 6s. For this reason, platinum and gold are the only members of this group which have half-filled 6s subshells, whereas the others have full 6s subshells. After mercury (Z = 80), the 6p subshell starts to fill [1]. 4f, 5s, and 5p thresholds in the sixth row are located at energies found in the extreme ultraviolet (EUV) and soft x-ray spectral regions, which presents an interesting scenario for studies of 4f photoabsorption. Broad transition arrays feature in this region, together with strong discrete transitions appearing where species with closed outer subshells arise in the spectrum, e.g. Au+ which has a 5d10 ground state [2].
Generally, considerable complexity is evidenced in photoabsorption and photoionisation spectra in this region. For example, in dual laser plasma (DLP) studies on lowly-ionised gold [3] where 4f  5d transition arrays are observed in the region of 70–127 electron volts (eV), at an inter-plasma delay Δt of 50 ns, satellite lines from exited configurations containing one or two 6s electrons play a significant role. The DLP method uses the continuum emission from one laser produced plasma to probe a second laser plasma, revealing absorption spectra, usually in the EUV and soft x-ray regions.
Stefanuik et al [4] observed 4d and 5p photoabsorption in DLP studies of laser-produced thulium plasmas in the 140–240 eV and 27–38 eV regions, respectively. In this unique case, neutral Tm, Tm+, and Tm2+ all have a single 4f vacancy, leading to a very similar 4d  4f photoabsorption profile for each species, observed at inter-plasma delays of 25 to 375 ns. The 5p photoabsorption structure is seen to be strongly influenced by spin–orbit splitting of the 5p hole.
Early studies on thin films of Ta, W, Re, and Pt [5] were followed by a similar study on an iridium film [6] using soft x-ray synchrotron radiation to generate photoionisation spectra between 30 and 600 eV. These studies revealed structure due to transitions from the 5p subshell. Auger and energy loss spectra [7] in the region of 4f and 5p electron excitation energies were recorded following electron beam bombardment of single-crystal Ni, Pt, Cu, and Au targets, combined with absorption studies on thin-film Pt samples using synchrotron radiation. Studies using the DLP technique [8] were undertaken to reveal 4f photoabsorption in atomic tungsten and platinum [9], while synchrotron radiation has been deployed to probe photoionisation processes in tungsten [10] and platinum [11] vapours. Using the DLP technique, 5d photoabsorption in Pb2+ and Bi3+ was observed between 33 and 60 eV, identifying over 30 new transitions and resulting in an improved value for the ionisation potential of Bi2+ [12]. This work was expanded to Pb+ and Bi2+ in the range 17.7–33.5 eV, where 5d  6p transitions from the ground- and three low lying excited-configurations were included to explain the observed spectra [13]. A detailed photoabsorption study of laser-produced gold plasmas identified 5p
  5d, 6s, and 4f
  5d, 6d transitions in the ions Au2+, Au3+, and Au4+ in the 70–120 eV region [3]. These spectra reveal features close in nature to those reported in this study.
Platinum (Z = 78) is characterised by an almost full 5d subshell, with the 4f electrons more tightly bound than the 5p electrons. The electronic configurations of lowly-ionised platinum provide an accessible study of electron correlation effects in a heavy element, similar to the case of lowly-ionised gold. A study on 4f and 5p photoabsorption [9] using the DLP method showed, at a 2.3 µs inter-plasma time delay, a broad feature centred at 50.9 ± 0.2 eV due to 5p
 5d transitions broadened by the 5d
  εf autoionisation continuum. The weaker 5p
 5d transitions are seen at 63.9 ± 0.2 eV. Fano-like profiles of 4f
  5d transitions were superimposed on the high energy slope of the 5p
  5d resonances in the 68–70 eV region. These features were seen to change with reducing inter-plasma time delay, almost disappearing at 0.8 µs, accompanied by the arrival of broader features at 71–73 eV. Costello et al concluded that these new features were either due to transitions in excited state neutral platinum or ionised platinum species which were present in the absorbing plasma at earlier times.
Platinum is of significant astrophysical interest as it is one of the most abundant elements in the rapid process (r-process) nucleosynthesis peak around mass number A = 195 [14, 15]. Its detection in metal-poor stars provides evidence that r-process nucleosynthesis took place at some time in the environment of the star or the location of its formation. There is also interest in isotopic population anomalies [16] where heavier isotopes are seen to dominate the spectrum. The pattern of isotopic composition varies from the widely assumed fractionation formalism, and lighter isotopes are deficient compared to the prediction of a single-parameter fractionation model.
While EUV stellar spectroscopy may not be able to unequivocally identify a given ion stage or excitation state of platinum, EUV studies will help laboratory astrophysicists to map laser produced plasma spectra of lowly-ionised platinum in the visible and near infra-red regions of the spectrum which are more accessible to high-resolution, ground and space-based, stellar spectroscopy. EUV photoabsorption of sixth row species is also of interest due to potential applications exploiting their photochemistry. For example platinum has been proposed as a radiosensitiser for x-rays [17] and hafnium has been mooted to enhance photoresist sensitivity for EUV lithography [18].
In this work we present a survey of calculated low-lying configurations of singly to four-times ionised atoms along the sixth row of the periodic table. We report an investigation into the photoabsorption of platinum laser produced plasmas in the 69–128 eV region, where 4f  5d, 4f
  6d and 4f
  7d transitions are found in ions Pt+, Pt2+, Pt3+, and Pt4+. Comparisons are made with atomic structure calculations and with spectra of gold plasmas [3] where analogous features have been observed in isoelectronic ions Au2+ through Au4+.
2. Experiment
Absorption spectra of platinum ions were obtained, in two separate experimental setups, using the DLP technique which is outlined in [19]. For the majority of the spectra, the output of a Q-switched neodymium yttrium aluminium garnet (Nd:YAG) laser (1064 nm, 10 Hz, 0.8 J in 6 ns) was focused through a plano-convex cylindrical lens to a 0.5 mm × 8 mm spot on a platinum target to generate a plasma containing the ions of interest. After a variable time delay (100 to 1000 ns), a second, similar laser was focused to maximum intensity (circa 1012 W cm−2) on a tungsten target to provide an EUV continuum [20]. By increasing the delay between the formation of the plasma containing the platinum ions and the continuum emitted by the second plasma it is possible to probe successively lower platinum ion stages. In a separate experiment, using the same lasers, the absorbing plasma was formed using a plano-convex spherical lens, focused to a 0.5 mm spot and probed at an inter-plasma delay of 60 ns. All spectra were recorded on a Jenoptic 0.25 m grazing incidence vacuum spectrometer, equipped with a 38 µm wide slit and a 1200 groove mm variable line space grating. All the experimental apparatus was under vacuum below 10−4 mbar to avoid absorption of EUV photons.
The spectra were photoelectrically imaged by a back-thinned, 1024 × 1024 pixel charge-coupled device (CCD) camera in a fixed position, and covering an energy range of 69 to 127 eV. The data recorded by the camera's controller contained counts per photon for each pixel of the CCD array, giving a resolving power  of typically 800. This yielded an energy accuracy of within 0.05 eV, and an overall uncertainty corresponding to a single pixel of the CCD. The emission intensity of the back-lighting plasma I0, and of the absorption signal I, were accumulated, respectively, for five consecutive shots in order to minimise the impact of shot-to-shot fluctuations, and the statistical variance in the spectrograph or detector spectral response. The relative absorption cross section was then obtained from log10(I0/I), representing the spectral variation in the absorption due to the ions in the plasma.
Both the height at which the continuum radiation probed above the target surface, and the distance from the central axis of the plasma that it probed, could be varied to avoid saturation of strong absorption transitions in the plasma. In general, for time delays between 100 and 400 ns, arbitrary values of log ) between 0.1 and 0.25 led to the most prominent absorption features. These values occurred when the probing continuum beam was displaced by approximately 1 mm from the central axis of the absorbing plasma, and approximately 2 mm above the target surface. The probing beam was within 100 µm of the absorbing target surface for the spectra recorded at an inter-plasma delay of 60 ns.
3. Atomic structure calculations
Calculations were undertaken using the Cowan RCN, RCN2 and RCG suite of codes [21]. The Slater–Condon Integrals were scaled to 85% from their ab initio values, apart from the spin–orbit integral which was not scaled. These parameters are identical to those reported in similar DLP studies on the photoabsorption of lowly-ionised species [3, 22, 23]. These scalings account for interactions with configurations not explicitly included in the code input, typically higher-lying configurations. Similarly, it was necessary to apply a shift to the calculated energies of the transition arrays to best match the observed energies. In each case the number of configurations in the input to the calculations was kept at the minimum that allowed identification of the features in the observed spectra.
3.1. Low-lying configurations in the sixth row from hafnium to bismuth
Sizeable populations of up to four times ionised species are expected in laser produced plasmas of the sixth row elements, under the experimental conditions used here, as evidenced by EUV spectra of gold and platinum. Spectra of plasmas comprising these elements will be further complicated by populations of low-lying levels, as levels at least as high as 8 eV above the ground level can achieve significant populations in a plasma with an electron temperature estimated to be 4 eV [24]. To help predict the spectral features due to 4f excitation in lowly-ionised sixth row species, configuration average E
 energies of the lowest three configurations of neutral to four-times ionised elements have been calculated using the Cowan suite of codes. Where possible, the order of the lowest configurations were checked using data from the National Institute of Standards and Technology (NIST) atomic spectra database [1]. These configurations and their configuration-average energies are displayed in tables 1 and 2, where [Xe] = (1s2 2s2 2p6 3s2 3p6 3d10 4s2 4p6 4d10 5s2 5p6).
Table 1. Configuration-average energies (eV) of the three low-lying configurations in the sixth row from hafnium to iridium. Note: for each element the energies are given relative to the ground configuration of the neutral.
| Element | I | II | III | IV | V | |||||
|---|---|---|---|---|---|---|---|---|---|---|
| Hf | 4f145d26s2 | 0 | 4f145d6s2 | +6.24 | 4f145d6s | +20.32 | 4f145d | +41.95 | 4f14 | +74.82 |
| 4f145d6s26p | +1.39 | 4f145d26s | +6.87 | 4f145d2 | +20.39 | 4f146s | +44.18 | 4f135d | +93.91 | |
| 4f145d36s | +2.27 | 4f145d3 | +8.79 | 4f146s2 | +21.80 | 4f146p | +50.80 | 4f136s | +99.85 | |
| Ta | 4f145d36s2 | 0 | 4f145d36s | +7.26 | 4f145d3 | +21.46 | 4f145d2 | +44.68 | 4f145d | +79.59 |
| 4f145d46s | +1.81 | 4f145d26s2 | +7.31 | 4f145d26s | +22.09 | 4f145d6s | +47.70 | 4f146s | +85.29 | |
| 4f145d26s26p | +2.31 | 4f145d4 | +8.64 | 4f145d6s2 | +24.34 | 4f146s2 | +52.49 | 4f146p | +93.44 | |
| W | 4f145d46s2 | 0 | 4f145d46s | +7.61 | 4f145d4 | +22.41 | 4f145d3 | +47.28 | 4f145d2 | +84.22 |
| 4f145d56s | +1.17 | 4f145d36s2 | +8.38 | 4f145d36s | +23.79 | 4f145d26s | +51.17 | 4f145d6s | +90.87 | |
| 4f145d46s6p | +3.22 | 4f145d5 | +8.39 | 4f145d26s2 | +26.90 | 4f145d6s2 | +56.90 | 4f146s2 | +99.44 | |
| Re | 4f145d56s2 | 0 | 4f145d56s | +7.93 | 4f145d5 | +23.54 | 4f145d4 | +49.81 | 4f145d3 | +88.78 |
| 4f145d66s | +0.61 | 4f145d6 | +8.57 | 4f145d46s | +25.46 | 4f145d36s | +54.59 | 4f145d26s | +96.43 | |
| 4f145d7 | +2.86 | 4f145d46s2 | +9.44 | 4f145d36s2 | +29.45 | 4f145d26s2 | +61.31 | 4f145d26p | +105.48 | |
| Os | 4f145d66s2 | 0 | 4f145d7 | +7.73 | 4f145d6 | +24.14 | 4f145d5 | +52.28 | 4f145d4 | +93.28 |
| 4f145d76s | +0.00 | 4f145d66s | +8.23 | 4f145d56s | +27.11 | 4f145d46s | +58.00 | 4f145d36s | +101.98 | |
| 4f145d8 | +1.57 | 4f145d56s2 | +10.52 | 4f145d46s2 | +32.01 | 4f145d36s2 | +65.75 | 4f145d36p | +111.49 | |
| Ir | 4f145d86s | 0 | 4f145d8 | +7.96 | 4f145d7 | +25.58 | 4f145d6 | +55.34 | 4f145d5 | +98.38 |
| 4f145d76s2 | +0.64 | 4f145d76s | +9.15 | 4f145d66s | +29.39 | 4f145d56s | +62.04 | 4f145d46s | +108.16 | |
| 4f145d9 | +1.07 | 4f145d66s2 | +12.24 | 4f145d56s2 | +35.24 | 4f145d56p | +70.74 | 4f145d46p | +118.14 | |
Table 2. Configuration-average energies (eV) of the three low-lying configurations in the sixth row from platinum to bismuth. Note: for each element the energies are given relative to the ground configuration of the neutral.
| Element | I | II | III | IV | V | |||||
|---|---|---|---|---|---|---|---|---|---|---|
| Pt | 4f145d96s | 0 | 4f145d9 | +8.17 | 4f145d8 | +27.01 | 4f145d7 | +58.42 | 4f145d6 | +103.49 |
| 4f145d10 | +0.54 | 4f145d86s | +10.08 | 4f145d76s | +31.69 | 4f145d66s | +66.11 | 4f145d56s | +114.38 | |
| 4f145d86s2 | +1.31 | 4f145d76s2 | +14.02 | 4f145d66s2 | +38.51 | 4f145d66p | +75.24 | 4f145d56p | +124.83 | |
| Au | 4f145d106s | 0 | 4f145d10 | +8.38 | 4f145d9 | +28.44 | 4f145d8 | +61.50 | 4f145d7 | +108.61 |
| 4f145d96s2 | +2.03 | 4f145d96s | +11.05 | 4f145d86s | +34.04 | 4f145d76s | +70.23 | 4f145d66s | +120.66 | |
| 4f145d106p | +4.48 | 4f145d86s2 | +15.86 | 4f145d76s2 | +41.87 | 4f145d76p | +79.78 | 4f145d66p | +131.58 | |
| Hg | 4f145d106s2 | 0 | 4f145d106s | +9.28 | 4f145d10 | +27.16 | 4f145d9 | +61.87 | 4f145d8 | +111.03 |
| 4f145d106s6p | +4.58 | 4f145d96s2 | +14.96 | 4f145d96s | +33.66 | 4f145d86s | +71.63 | 4f145d76s | +124.22 | |
| 4f145d106s7s | +6.64 | 4f145d106p | +16.04 | 4f145d96p | +42.13 | 4f145d86p | +81.64 | 4f145d76p | +135.65 | |
| Tl | 4f145d106s26p | 0 | 4f145d106s2 | +5.61 | 4f145d106s | +24.81 | 4f145d10 | +53.75 | 4f145d9 | +104.96 |
| 4f145d106s27s | +2.78 | 4f145d106s6p | +12.33 | 4f145d106p | +33.66 | 4f145d96s | +64.58 | 4f145d86s | +119.34 | |
| 4f145d106s27p | +3.82 | 4f145d106s7s | +17.58 | 4f145d96s2 | +34.68 | 4f145d96p | +75.02 | 4f145d86p | +131.26 | |
| Pb | 4f145d106s26p2 | 0 | 4f145d106s26p | +6.84 | 4f145d106s2 | +20.78 | 4f145d106s | +51.42 | 4f145d10 | +92.79 |
| 4f145d106s26p7s | +3.70 | 4f145d106s27s | +13.17 | 4f145d106s6p | +29.50 | 4f145d106p | +62.32 | 4f145d96s | +108.37 | |
| 4f145d106s26p7p | +4.86 | 4f145d106s26d | +14.62 | 4f145d106s7s | +38.33 | 4f145d96s2 | +65.92 | 4f145d96p | +120.80 | |
| Bi | 4f145d106s26p3 | 0 | 4f145d106s26p2 | +8.06 | 4f145d106s26p | +23.63 | 4f145d106s2 | +47.47 | 4f145d106s | +90.92 |
| 4f145d106s26p27s | +4.70 | 4f145d106s26p7s | +15.50 | 4f145d106s27s | +33.80 | 4f145d106s6p | +58.18 | 4f145d106p | +103.87 | |
| 4f145d106s26p27p | +5.95 | 4f145d106s26p6d | +17.04 | 4f145d106s6p2 | +34.27 | 4f145d106s7s | +70.88 | 4f145d96s2 | +110.43 | |
3.2. 4f photoabsorption of platinum ions
Detailed calculations were undertaken to help identify features observed in the experimental spectra of platinum plasmas. As the 5d and 6s orbitals are near-degenerate in lowly-ionised platinum, initial levels were calculated with the configurations [Xe] 4f14 5dm
, [Xe] 4f14 5d 6s, and [Xe] 4f14 5d
 6s2, to account for configuration interaction (CI). Here m = 8 for Pt2+, m = 7 for Pt3+, and m = 6 for Pt4+. The initial and final configurations are given in table 3. These calculations are similar to those performed in the photoabsorption study of laser-produced gold plasmas, which identified 4f
  5d, 6d transitions in Au2+, Au3+ and Au4+ [3]. In addition, we can expect that terms above the ground term for each configuration will have significant populations at plasma temperatures between 1 and 9 eV. For example, the ground term of Pt+ is [Xe] 4f14 5d9
2D, and contains three levels which extend over a 2 eV range, while the [Xe] 4f14 5d8 6s 4F term extends from 0.6 eV to 2.6 eV above the ground level [1].
5d, 6d transitions in Au2+, Au3+ and Au4+ [3]. In addition, we can expect that terms above the ground term for each configuration will have significant populations at plasma temperatures between 1 and 9 eV. For example, the ground term of Pt+ is [Xe] 4f14 5d9
2D, and contains three levels which extend over a 2 eV range, while the [Xe] 4f14 5d8 6s 4F term extends from 0.6 eV to 2.6 eV above the ground level [1].
Table 3. Initial and final configurations where m = 9 in Pt+, m = 8 in Pt2+, m = 7 in Pt 3+, and m = 6 in Pt4+. Here, [Xe] represents the electronic configuration of Xenon, n is the principle quantum number with integer values of 5, 6, and 7, and δ is the ejection energy of a free electron of angular momentum  or k.
or k.
| Final | ||
|---|---|---|
| Initial | Discrete | Continuous |
[Xe] 

| [Xe] 
 nd
nd
| [Xe] 
 + + 
|
[Xe] 
 6d + 6d + 
| ||
[Xe] 


| [Xe] 
 6s
nd 6s
nd
| [Xe] 
 + + 
|
[Xe] 
 6d + 6d + 
| ||
[Xe] 
 6s + 6s + 
| ||
[Xe] 
 6s 6 d + 6s 6 d + 
| ||
[Xe] 


| [Xe] 

 nd
nd
| |
At the photon energies reported here, many of the upper levels lie well above the ionisation potential of the ion in question. This condition facilitates the autoionisation mechanism, which promotes significant transition line broadening by reducing the lifetime of the excited levels. In many cases, the broadening is of the same order as the instrumental broadening (0.05 eV), leading to a visible impact on the shape of the spectrum.
The ejection energy δ of the free electron was obtained for each decay channel by calculating the difference in E
 values for the corresponding excited and final states. Transitions between each permutation of initial and final states were calculated, and subsequently broadened by decay to the continuum, using the Cowan suite of codes.
Synthetic spectra were generated using data from the Cowan code calculations, whereby each transition was first convolved with a Lorentzian profile based on transition widths derived from the autoionisation lifetimes. Equation (1) gives the absorption cross section σk
in Mb of level k as a function of oscillator strength fk
per unit energy interval in eV. The oscillator strength variation with transition energy E is described by a Lorentzian profile of linewidth  , centred at Ek
[25]. The
, centred at Ek
[25]. The  factor is the normalization constant of the Lorentzian distribution. The area under each feature is proportional to the oscillator strength of the transition.

The conversion factor 109.7617 Mb eV was obtained from equation (2), each symbol having its usual meaning.
The Boltzmann factor  was calculated using equation (3), where εk
is the energy of level k,
was calculated using equation (3), where εk
is the energy of level k,  is the lowest energy level, and
  is the temperature of the Boltzmann distribution in eV,
The temperature of the Boltzmann distribution was estimated by selecting the plasma temperature which resulted in the best fit to a particular experimental spectrum. Contributions from each ion stage were weighted by a factor derived from a collisional-radiative (CR) model [26] for a plasma at the same electron temperature as the Boltzmann factor and with an electron density of 1021 cm−3, the critical density for laser plasmas formed with 1064 nm radiation. The platinum ion stage population distribution for a given electron temperature with the selected values is shown in figure 1.
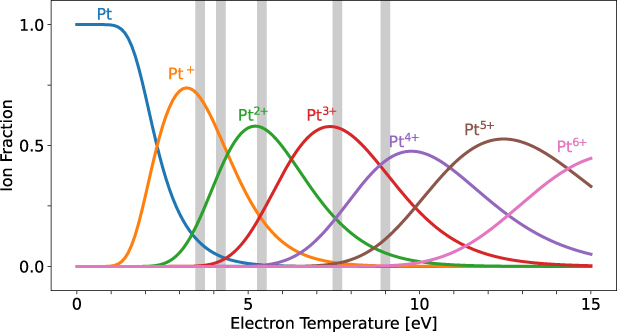
Figure 1. Fractional ion composition of Pt plasmas with respect to electron temperature between 0 and 15 eV, at a constant electron density of 1021 cm−3, acquired using a collisional-radiative model by Colombant and Tonon [26]. The vertical regions indicate the approximate temperatures at which the synthetic spectra best fit the experimental spectra presented in figures 2 and 3.
Download figure:
Standard image High-resolution image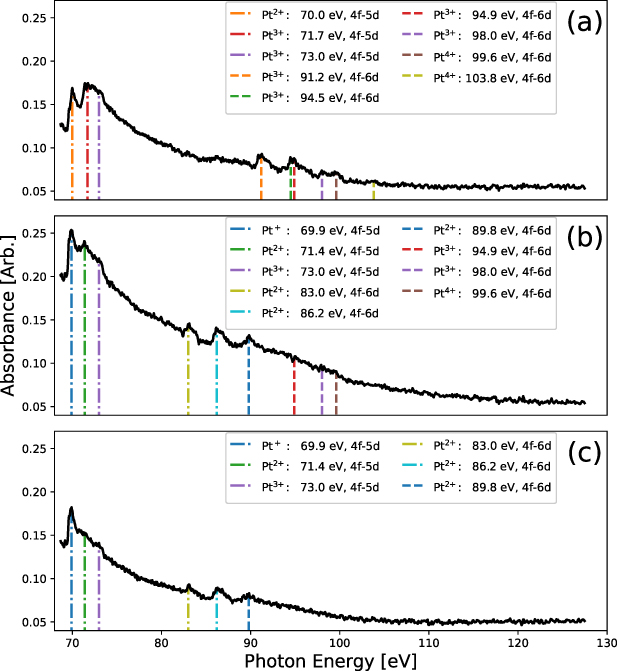
Figure 2. Experimental absorption spectra of laser produced plasmas of platinum, recorded at delays of (a) 100 ns, (b) 200 ns, and (c) 300 ns, showing 4f-nd photoabsorption in Pt+, Pt2+ and Pt3+.
Download figure:
Standard image High-resolution imageTable 4 shows the weightings applied to the spectra Pt+ - Pt5+ ion stages, for different times after plasma formation, obtained from the CR model. A modified version [27] of the original CR model by Colombant and Tonon was implemented, in which it was shown that the accuracy of estimating the charge state at which ionization bottlenecks occur could be improved by eliminating the occupancy factor, using a different exponent value in the radiative recombination rate coefficient term, and by obtaining experimental values for ionization energies using the NIST database [1], where possible.
Table 4. Fractional Pt ion compositions that best reproduce experimental spectra at various inter-plasma time delays ( ) and their corresponding electron temperature
  (assuming an electron density of 1021 cm−3) according to the CR model used [26].
| Pt ion compositions (%) | |||||||
|---|---|---|---|---|---|---|---|
 (ns) (ns) |
 (eV) (eV) | Pt | Pt+ | Pt2+ | Pt3+ | Pt4+ | Pt5+ |
| 60 | 9.0 | 0.0 | 0.2 | 5.6 | 39.0 | 43.6 | 11.3 |
| 100 | 7.6 | 0.0 | 1.4 | 19.1 | 57.4 | 20.7 | 1.3 |
| 200 | 5.4 | 0.7 | 19.4 | 57.4 | 22.0 | 0.5 | 0.0 |
| 300 | 4.2 | 4.1 | 53.1 | 40.5 | 2.3 | 0.0 | 0.0 |
| 400 | 3.6 | 9.7 | 69.7 | 20.3 | 0.3 | 0.0 | 0.0 |
The simulated-cross sections were calculated using equations (1)–(3) and scaled according to the CR model distribution. The ion-weighted summation of these cross sections were then convolved with a Gaussian function with a full width at half maximum of 0.05 eV to account for instrumental broadening.
4. Results and discussion
Three experimental spectra, recorded at inter-plasma delays of 100 ns, 200 ns and 300 ns, are shown in figure 2, with key features identified by labels which have the same meaning to those presented in figures 3 and 4. The vertical bars locate the experimental peaks of the transition arrays identified in the legend. A spectrum recorded from a point plasma, at a time delay of 60 ns, is shown in figure 3, again with key features identified by labels. In general, features were found to vary systematically with time delay, i.e. those due to higher ion stages became weaker with increasing time delay. In each case, the identified energy is the maximum of the experimental spectrum, ascribed to a given ion in the region shown. The strongest transitions in each array, identified from calculations, are listed either in the text or the tables below. Because the 4f  6d and 4f
  7d transitions from different ion stages do not generally overlap in energy, these are the simplest place to start the analysis of the spectra.

Figure 3. Experimental photoabsorption spectrum of a platinum plasma recorded with an inter-plasma delay of 60 ns.
Download figure:
Standard image High-resolution image
Figure 4. Simulated cross sections of Pt2+ to Pt4+ ions in the 80 eV to 120 eV region. The panels shown are: (a) spectra from combined ions, weighted as per the annotation. (b) Unweighted Pt4+, (c) unweighted Pt3+, and (d) unweighted Pt2+. The 1.3% and 1.4% contributions from Pt5+ and Pt+ respectively, are not shown here individually, as they do not have significant impact on the weighted spectrum.
Download figure:
Standard image High-resolution imageIn the observed spectra, transition arrays in the 70–73 eV range are followed by a series of less-intense arrays located between 80 and 112 eV. Gradually declining continuum absorption is seen in all spectra between 72 and 100 eV. Identification of the discrete features, supported by the Cowan code calculations is outlined in table 5. In summary, 4f  5d transitions are located below 75 eV, and 4f
  6d and 7d transitions are found at higher energies, above 80 eV.
Table 5. Transition array data for spectra from Pt to Pt4+. (N is the number of transitions in each array,  gf is the sum of the weighted oscillator strengths,
  is the sum of the autoionising widths and
  is the average autoionising width per transition.).
| Transition | Ion | Initial | — | Final | Energy range (eV) | N |
 gf
gf
|
 (eV) (eV) |
 (eV) (eV) | ||
|---|---|---|---|---|---|---|---|---|---|---|---|
| 4f-5d | Pt | 4f145d96s | — | 4f135d106s | 65.77 | — | 70.90 | 11 | 1.11 |

|

|
| 4f145d86s2 | — | 4f135d96s2 | 64.15 | — | 74.16 | 81 | 5.81 |

|

| ||
| Pt+ | 4f145d9 | — | 4f135d10 | 67.59 | — | 70.89 | 3 |

|

|

| |
| 4f145d86s | — | 4f135d96s | 63.08 | — | 74.35 | 308 | 11.2 | 2.00 |

| ||
| 4f145d76s2 | — | 4f135d86s2 | 62.70 | — | 79.19 | 721 | 24.7 |

|

| ||
| Pt2+ | 4f145d8 | — | 4f135d9 | 64.50 | — | 74.38 | 81 | 5.91 | 1.34 |

| |
| 4f145d76s | — | 4f135d86s | 62.52 | — | 80.42 | 2763 | 50.4 | 19.8 |

| ||
| 4f145d66s2 | — | 4f135d76s2 | 59.96 | — | 83.36 | 2825 | 61.6 | 2.02 |

| ||
| Pt3+ | 4f145d7 | — | 4f135d8 | 63.24 | — | 79.92 | 721 | 26.1 | 12.4 |

| |
| 4f145d66s | — | 4f135d76s | 59.52 | — | 84.96 | 10 870 | 126 | 53.0 |

| ||
| 4f145d56s2 | — | 4f135d66s2 | 60.79 | — | 111.40 | 5470 | 96.6 | 3.76 |

| ||
| Pt4+ | 4f145d6 | — | 4f135d7 | 60.76 | — | 84.66 | 2825 | 64.6 | 59.3 |

| |
| 4f145d56s | — | 4f135d66s | 60.15 | — | 92.31 | 21 085 | 199 | 199 |

| ||
| 4f145d46s2 | — | 4f135d56s2 | 60.48 | — | 114.01 | 5470 | 97.8 | 9.74 |

| ||
| 4f-6d | Pt | 4f145d10 | — | 4f135d106d | 73.33 | — | 76.62 | 3 |

|

|

|
| 4f145d96s | — | 4f135d96s6d | 74.00 | — | 82.70 | 651 |

|

|

| ||
| Pt+ | 4f145d9 | — | 4f135d96d | 79.89 | — | 87.44 | 171 |

| 1.54 |

| |
| 4f145d86s | — | 4f135d86s6d | 78.30 | — | 95.77 | 9515 | 1.32 | 15.9 |

| ||
| Pt2+ | 4f145d8 | — | 4f135d86d | 83.45 | — | 101.28 | 2478 | 1.35 | 27.4 |

| |
| 4f145d76s | — | 4f135d76s6d | 84.84 | — | 106.91 | 55 378 | 7.46 | 124 |

| ||
| Pt3+ | 4f145d7 | — | 4f135d76d | 90.19 | — | 119.37 | 14 355 | 5.48 | 138 |

| |
| 4f145d66s | — | 4f135d66s6d | 88.20 | — | 120.69 | 151 981 | 19.8 | 288 |

| ||
| Pt4+ | 4f145d6 | — | 4f135d66d | 93.33 | — | 124.45 | 39 303 | 12.8 | 804 |

| |
| 4f145d56s | — | 4f135d56s6d | 96.55 | — | 131.28 | 211 320 | 30.9 | 688 |

| ||
| 4f-7d | Pt | 4f145d10 | — | 4f135d107d | 74.02 | — | 77.32 | 3 |

|

|

|
| 4f145d96s | — | 4f135d96s7d | 74.75 | — | 83.44 | 651 |

|

|

| ||
| Pt+ | 4f145d9 | — | 4f135d97d | 82.42 | — | 89.94 | 171 |

|

|

| |
| 4f145d86s | — | 4f135d86s7d | 80.93 | — | 98.28 | 9515 |

| 2.60 |

| ||
| Pt2+ | 4f145d8 | — | 4f135d87d | 88.27 | — | 104.94 | 2478 |

| 2.05 |

| |
| 4f145d76s | — | 4f135d76s7d | 90.13 | — | 111.89 | 55 378 | 3.94 | 20.2 |

| ||
| Pt3+ | 4f145d7 | — | 4f135d77d | 98.00 | — | 118.49 | 14 355 | 2.24 | 11.2 |

| |
| 4f145d66s | — | 4f135d66s7d | 96.40 | — | 128.20 | 151 981 | 9.72 | 29.5 |

| ||
| Pt+4 | 4f145d6 | — | 4f135d67d | 104.17 | — | 134.86 | 39 303 | 4.91 | 41.8 |

| |
| 4f145d56s | — | 4f135d56s7d | 107.94 | — | 141.46 | 211 320 | 14.3 | 73.1 |

| ||
Several factors contribute to the observed experimental profile. Local variations in the absorbing plasma arise from both the spatial profile of the laser beam and the expansion of the absorbing plasma in the 60–1000 ns before the continuum radiation probes it. The observed spectra integrate absorption along the full path through the plasma, which is not fully described by a single electron temperature or density. A full radiation transport calculation, with varying electron densities and temperatures, would be required to accurately simulate the observed spectra. This is not done here. However, the temporal behaviour of the probing continuum pulse emitted by the tungsten plasma in this spectral range, closely follows the 5.5 ns duration of the driving laser pulse. This limits the variability of conditions in the platinum plasma while the spectrum is observed.
4.1. 4f  6d and 4f 7d transitions


Broad peaks located between 85 eV and 110 eV are seen in figures 2 and 3, which show experimental spectra recorded at time delays between 60 and 300 ns. These are 4f  6d, 7d transition arrays, which move to higher energies with increasing ionisation, and are identified in the figure legends. Further details from the Cowan code calculations are given in table 5. This table shows that the 4f
  7d transitions are far weaker than 4f
  6d. The 4f
  7d Pt2+ transitions overlap the 96 eV and 100 eV 4f
  6d peaks, and the 4f
  7d transitions in Pt3+ lie in the 108 eV and 111 eV regions. Calculations for the 4f
  7d transitions in Pt4+ produce peaks at 115 eV, 119 eV, and 123 eV, which are not visible in the experimental spectrum. Due to their relative weakness, the 4f
  7d transitions are not included in the simulated spectrum shown in figure 4, although their positions are marked.
4.2. 4f 5d transitions

Two prominent features in the spectra, in the regions of 70 eV and 72 eV are ascribed to 4f  5d transitions, in line with previous studies on laser produced plasma photoabsorption spectra of W and Pt vapours [9]. As the 4f
  5d transitions from a range of Pt ions tend to overlap forming an unresolved transition array, the ion stages present in the plasma were confirmed by the identifications of 4f
  6d and 4f
  7d transitions outlined in the previous subsection. The feature at 71–73 eV weakens with increasing time delay, being almost entirely absent at a delay of 400 ns. Inspection of our spectra, combined with calculations using the Cowan code, shows that 4f
  5d features in the spectra of Pt I and Pt II lie in the 69.5–70.5 eV region, while those in the spectra of Pt III and Pt IV lie in the region between 70.5 and 73.5 eV. The best agreement between the theoretical and experimental energies of the 4f
  6d and 4f
  7d resonances was obtained by shifting the calculated spectra by −7.4 eV and −10.4 eV respectively, and a shift of −0.55 eV provides the best agreement for the 4f
  5d transitions. It was not possible to include excited configurations including 6s2 states in the full CI due to the number of energy levels involved. This omission may account for the large shifts required to best match the observed and calculated energies. Unshifted transition array data from the Cowan code calculations are given in table 5.
The feature peaking at 69.9 eV is primarily comprised of spectral lines which arise from Pt+ transitions, and is prominent in the spectra shown in  b
b and
and  c
c of figure 2. The dominant electronic transition in the energy band of 69.9 ± 0.01 eV is [Xe] 4f14 5d7 6s2
4F
of figure 2. The dominant electronic transition in the energy band of 69.9 ± 0.01 eV is [Xe] 4f14 5d7 6s2
4F
 [Xe] 4f13 5d8 6s2 (3F) 4G
 , which accounts for 58% of the Pt+ cross-sectional contributions in this energy range. Similarly, the dominant transition in the spectrum of Pt2+ is [Xe] 4f14 5d7 6s1
3P1
, which accounts for 58% of the Pt+ cross-sectional contributions in this energy range. Similarly, the dominant transition in the spectrum of Pt2+ is [Xe] 4f14 5d7 6s1
3P1
 [Xe] 4f13 5d8 6s1 (1G) 3F2 at 70.0 ± 0.01 eV, which accounts for 69% of the Pt2+ photoabsorption cross section in this energy range. As the Pt2+ ion contributions outweigh the Pt+ contributions in figure 3 and (a) of figure 2, the 70.0 eV feature dominates over the 69.9 eV feature in these spectra.
Spectra recorded at inter-plasma time delays between 400 and 1000 ns, not shown here, reveal that features due to Pt+ become weaker, further narrowing the width of the resonance at 69.9 eV, which also has contributions from neutral platinum [9]. At these inter-plasma delays a feature due to neutral platinum, peaking at 69.84 eV, dominates over the nearby Pt+ transitions to the extent that the 69.9 eV peak is no longer identifiable.
Costello et al [9] make the point that the higher energy feature must be due to the presence of ions and excited states in the Pt vapour. The fact that Costello et al were able to see evidence of ions in the platinum plasma at relatively long delays of 800 ns (300 ns from the peak of the absorbing plasma pulse) and 1200 ns (700 ns from the peak of the absorbing plasma pulse) can be attributed to the shorter wavelength, long pulse duration and large energy of the laser pulses used to form the platinum plasma (590 nm, 1000 ns and 1 J, respectively), and to the larger spot size used (1 mm diameter), which would lead to prolonged excitation in the plasma.
A simulated cross section of a Pt plasma in the region from 85 to 120 eV with an average electron temperature of 9.0 eV is shown in figure 4. The simulated cross section includes the energy shifts mentioned above. The vertical bars correspond to those shown in figures 2 and 3 and are identified again in the legends. These features are primarily due to transitions 4f14 5dm
 4f13 5dm
6d and 4f14 5d
4f13 5dm
6d and 4f14 5d 6s
6s  4f13 5d
 6s 6d in Pt2+—Pt4+ ions. A comparison between three experimental spectra and three corresponding simulated photoabsorption cross sections are shown in figure 5. This clearly illustrates the relative influence of the 4f
  5d and 4f
  6d transitions on the spectra.
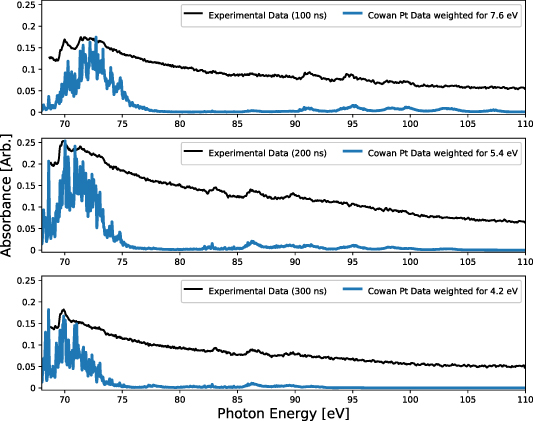
Figure 5. A comparison of experimental spectra at three different time delays, with simulated photoabsorption cross sections for Pt plasmas at plasma electron temperatures that yield the best match with the observed spectra.
Download figure:
Standard image High-resolution imageIt is noteworthy that the features identified in this work are seen to sit on a continuum-like absorption feature which falls off with increasing energy between 70 and 110 eV. This is consistent with previous studies on gold [3] and tungsten [9], and may in part be due to 5p  nd transitions, where n
 5, which are broadened by autoionisation. A many-body relativistic time dependent local density approximation (RTDLDA) calculation [28] reproduces the form of the continuum absorption when 5p, 4f, and 5d channels are included. The calculated cross section was typically 10 Mb at 80 eV for each ion. While RTDLDA calculations have previously proved useful in interpreting broad resonances [29], and induce direct photoionisation, they cannot reproduce the discrete features as only spin–orbit coupling of the core is taken into account, rather than the full angular momentum coupling required to describe the features. A shift of 1.8 eV is applied to the RTDLDA calculated spectrum in figure 6 to match the 5d configuration average binding energy, calculated using the Cowan code. The 5d partial cross section makes the greatest contribution to the total cross section below 80 eV, while the 5p partial cross section also contributes above 80 eV. The 4f partial cross section does not start to make a significant contribution until around 90 eV, which is just above the 4f binding energy. Calculations showed that the same general trend arose for neutral, doubly and triply ionised species, and also for the next two lowest lying excited configurations in each ion stage.

Figure 6. Experimental photoabsorption spectrum of a platinum plasma, recorded with an inter-plasma delay of 300 ns. The experimental spectrum is scaled to compare with the RTDLDA calculated cross section due to Pt+ ions. The RTDLDA spectrum was smoothed using a Gaussian filter and shifted by 1.8 eV to higher energies.
Download figure:
Standard image High-resolution image
5. Conclusion
Photoabsorption spectra of platinum in the range 69 eV–127 eV, recorded using the DLP technique, revealed transition arrays due to excitation of 4f electrons to 5d, 6d and 7d states. The noticeable reduction in the photoabsorption cross section between 70 and 100 eV was reproduced by RTDLDA calculations. The contributions from platinum ions ranging from singly to four-times ionised varied with electron temperature in the absorbing plasma, where the cooler plasmas were dominated by lower ion stages. As estimated by a collisional-radiative model, the absorbing plasma temperatures ranged from 2.3 eV at 400 ns delay, to 9.0 eV at 60 ns. Contributions from low-lying excited levels, and the influence of autoionisation had to be taken into account to interpret the spectra.
Acknowledgments
This research was funded by The Irish Research Council under Grant Number GOIPG/2018/2827. The authors wish to thank Fergal O'Reilly for his support with the atomic structure calculations, as well as the development of the electromechanical motion control components, and Nicola Murphy for contributing her platinum photoabsorption data.
Data availability statement
All data that support the findings of this study are included within the article (and any supplementary files).