
Abstract
High harmonic generation (HHG) spectroscopy has emerged as an invaluable tool for studying electronic dynamics and structure in crystals. The primary challenges are imposed by the multiple degrees of freedom of the underlying dynamics as well as the low efficiency of the HHG process. Here we show that when the HHG process is driven by a synthesized bichromatic field, its efficiency can be significantly enhanced, increasing the photon flux by 1–2 orders of magnitude. The bichromatic field enhances the signal on a microscopic level by manipulating the tunnel ionization and subsequent electron dynamics driven by the synthesized laser waveform. We examine the scaling of the HHG yield on the field parameters, and observe a pronounced dependence on the HHG energy. Importantly, our study reveals that the different spectral regimes are dictated by different generation mechanisms as well as multiple bands in which the dynamics evolve. Our work demonstrates that shaped laser fields serve as a powerful approach to control multiband electron currents in solids, probe their origin, and enhance the efficiency of the HHG process.
Export citation and abstract BibTeX RIS

Original content from this work may be used under the terms of the Creative Commons Attribution 4.0 licence. Any further distribution of this work must maintain attribution to the author(s) and the title of the work, journal citation and DOI.
1. Introduction
The discovery of high harmonic generation (HHG) in solids has opened new avenues in strong field physics for manipulating electronic and optical properties on petahertz frequency scales [1, 2]. For a moderate laser field strength, the underlying mechanism is dictated by ultrafast electron currents that are driven in the energy bands of the solid state system. HHG can originate from the current driven within a single conduction band (termed an 'intraband' process) or occur via electron–hole recombination between two bands (an 'interband' process). The dynamics of these ultrafast currents are therefore directly linked to the electronic structure of the material, and is imprinted in the energies of the emitted XUV harmonics. This mapping establishes solid state HHG spectroscopy as a powerful method for reconstruction of electronic band structure [3], or for resolving the attosecond electron dynamics [4].
While HHG spectroscopy in solids holds great potential, the generation mechanisms in many systems has not been fully resolved. The basic dynamics of interband HHG can be described by a close analogy to the single atom case, via a three step process [5]. The electron first tunnels from the valence to a conduction band, followed by electron and hole acceleration in the crystal momentum space. Finally, the electron and hole recombine, leading to emission of XUV photons [6]. Recent HHG spectroscopy measurements have focussed on photorecombination dynamics [7, 8], revealing clear information about the band structure [3, 4]. A complete reconstruction of the process relies on modelling the semiclassical electron trajectories [9, 10] or fully quantum mechanical simulations [11, 12].
Many solid state HHG spectra contain multiple spectral plateaus originating from multiple populated conduction bands. Such excitations extend the cutoff energy, which can reach the range of 30–40 eV [2]. While this mechanism is largely dependent on the laser field strength, it is limited by the damage threshold of the sample, which is typically in the range of ∼1013 W cm−2 and corresponds to a field strength ∼1 V Å−1. This is comparable to the field required to reach crystal momenta across the entire Brillouin zone in many solid state systems. Driving the HHG process very close to the damage threshold poses a significant limitation on both the control and optimization of the emitted HHG. Controlling the HHG efficiency and spectral intensity, as well as the sub-cycle dynamics of the process, remains a major challenge.
Multicolour excitation fields offer a promising route for manipulating the HHG process and decoding its underlying dynamics. In recent years such schemes were theoretically studied, revealing the main parameters of the interaction as well as their dynamical properties. It was shown that the multicolour field enables the manipulation of crystal momentum or ionization times, through which excitation from the valence to the conduction band can be controlled and enhanced. There are varying mechanisms by which such control can be applied. Li et al considered a 1D solid with a minimum bandgap energy at the edge of the Brillouin zone [13]. By combining a mid-IR field and its third harmonic, they show an increase in the canonical crystal momentum of the Bloch electron wavepacket without increasing the peak electric field or the risk of damage. This mechanism leads to more efficient excitation to higher conduction bands via tunnel ionization in the vicinity of the band edge, and a significant increase in HHG flux at higher energies. In other works, a newly proposed four-step recollision model incorporates an initial pre-acceleration step of a valence electron wavepacket prior to tunnel ionization [14]. Such a scheme presents an additional route to significantly increasing the XUV flux in the higher energy plateaus. Using two colour [15] or three colour fields [16], preacceleration of the wavepacket provides a larger range of initial crystal momenta for efficient excitation, thereby increasing the electron currents in the higher conduction bands. As a consequence, the flux at higher XUV energies is enhanced. These studies show the importance of shaping the sub-optical cycle profile of the electric field to provide control over the electron currents and to distinguish between different excitation pathways prior to recombination.
An additional important challenge, common to gas phase HHG, is the low efficiency of the process. HHG studies in gas phase often utilize phase matching for coherent accumulation of the HHG signal within the medium [17]. However, these schemes cannot be directly extended to solid state HHG because the XUV absorption length is typically very short. For example, in MgO the absorption length near 20 eV is ∼15 nm [18]. In any practical monolithic crystal, most of the HHG generated in the bulk is absorbed, and the observed HHG is generated only in the final atomic layers before the exit face of the crystal. Phase matching methods, which provide a coherent build-up of the signal along the propagation length, are thus not practical. Multicolour fields in gas phase HHG have proved successful in controlling the flux and spectrum. Typically, these combine phase matching with field-induced modulation of the ionization step [19], or by optimizing electron trajectories prior to recombination [20–23]. In solid state systems, where phase matching does not play a role in the the HHG process, enhancing the flux on a microscopic level by increasing the electron current in the conduction band(s) is essential for overcoming the low efficiency limitations.
Bichromatic fields can provide sub-optical cycle control of the tunnel ionization rate, leading to enhancement of the HHG flux on a microscopic level. This approach was successful in enhancing the gas phase HHG flux by up to two orders of magnitude across the XUV and soft x-ray regions [24, 25]. The optimization relies on the single particle response and is largely robust to macroscopic phase matching schemes. We illustrate this concept in figure 1(b), which shows the instantaneous electric field amplitudes for sample single colour and bichromatic fields having non-commensurate frequencies. Constructive and destructive interferences modulate the field structures in a complex, non-periodic manner. The bichromatic field creates a local nonlinear enhancement of the tunnel ionization rates due to its exponential dependence on the field strength. As a result, the electron current promoted to the conduction bands is enhanced, along with the HHG signal amplitude. The combination of non-commensurate fields in such schemes is crucial. First, due to the aperiodic constructive interference within the field envelope, the enhancement can be concentrated within a single optical cycle while the driving lasers themselves are multicycle. Second, HHG becomes largely robust to the relative two colour phase [26]. Therefore, the non-commensurate synthesized field can function like a few cycle laser pulse without the need for nonlinear compression or carrier envelope phase (CEP) stabilization. In addition, the relative simplicity of such a configuration also provides an elegant route to isolated attosecond pulse generation using multicycle driving fields [22, 27]. These properties of non-commensurate bichromatic fields offer a promising route to improve the flux in solid state HHG sources as well as to probe the mapping between the sub-cycle electron dynamics and the HHG spectrum.

Figure 1. (a) The experimental setup used in the measurements. A bichromatic HHG driving field is produced by combining the output of an optical parametric amplifier (OPA) tuned to a 1300 nm central wavelength with that of a Ti:S laser at 800 nm central wavelength. The beams are focussed into a free standing MgO crystal and the HHG emission is measured with a flat field XUV spectrometer. (b) Electric field amplitudes for sample single colour and non-commensurate two colour fields. Solid black curve: single colour field (1300 nm wavelength), 40 fs duration. The peak field strength is normalized to unity. Red solid curve: bichromatic colour field containing a second field (800 nm wavelength, 40 fs) with one-sixth the power of the 1300 nm field. In this example, the fields have zero relative time delay and zero relative CEP. Blue transparent curve: single colour field at 1300 nm with the same total energy as the bichromatic field. The yellow circles mark the half cycles of the bichromatic field where the electric field is strongest, and nonlinear enhancement of tunnel ionization is expected to occur. Inset: full temporal envelope of the bichromatic field.
Download figure:
Standard image High-resolution imageIn this work, we present a novel scheme for solid state HHG control, based on a bichromatic synthesized laser field. Using thin crystalline MgO, we perform a systematic study of the interaction and find that the synthesized field significantly enhances the HHG yield across the entire spectrum from ∼10–25 eV. We identify multiband contributions to the HHG spectrum and characterize their distinct responses to the synthesized fields. The scaling of the HHG flux with respect to the field parameters suggests an intricate dependence of the current dynamics with respect to the sub-cycle field structure.
2. Experiment
The experimental setup is shown in figure 1(a). HHG was produced by a bichromatic field with central wavelengths 1300 nm and 800 nm, and mutually parallel polarizations. The experiment used 8 mJ, 35 fs pulses from a Ti:S amplifier that were divided by a 90/10 beamsplitter. The larger energy beam pumped a white light seeded OPA (Light Conversion HE-TOPAS-C), producing wavelength tunable pulses with 2.5 mJ total energy (signal plus idler) and pulse widths of 40 fs. To improve the spatial beam quality, the near-IR signal was passed through a spatial filter consisting of a 1:1 imaging telescope with a small aperture (typically 300–400 μm width) placed in vacuum at the Fourier plane. The smaller energy beam (approximately 1 mJ), passes through an optical delay line and was collinearly combined with the OPA beam at a dichroic beam recombiner. The pulse energies in both beams were controlled using neutral density filters. Control over the spatial profile of the 800 nm beam was adjusted using irises, and provided an effective means of mode matching to the 1300 nm beam. Both beams were focussed with a 50 cm focal length spherical mirror into vacuum and into a free standing single crystal of MgO (〈100〉) having a thickness of approximately 50 μm. The orientation of the crystal axes with respect to the laser polarization was controlled by a rotation motor perpendicular to the beam propagation direction. The crystal was oriented along the Γ–X direction for all the measurements. The HHG emission in transmission was measured with a flat field spectrometer consisting of an aberration-corrected laminar-type replica diffraction grating (Shimadzu) that focuses the harmonics onto a micro channel plate (MCP) coupled to a phosphor screen, which are then imaged with a CCD camera. The MgO crystal was placed in the focal plane of the grating in order to ensure that the HHG is properly imaged onto the MCP. The emitted XUV flux was measured using a calibrated XUV photodiode (AXUV100G) and a femtocurrent amplifier (FEMTO Messtechnik DDPCA-300). To block the bichromatic driving field, the diode was mounted with a pair of 150 nm thickness Mg filters with 30 nm Al caps (Luxel Corporation).
We performed a systematic study of the HHG spectrum and yield driven by these non-commensurate bichromatic fields. The parameters used in the measurements are summarized in table 1. Five different powers of the 1300 nm pulses were combined with six different powers of the 800 nm pulses, for a total of 30 combinations of synthesized fields. Together with the single colour 1300 nm spectra for each power, the complete data set comprises 35 separate measurements. For the bichromatic measurements, spectra were recorded as functions of temporal delay between the two pulse envelopes, in which the 800 nm pulse was delayed from −200 fs to +200 fs in 5 fs steps. In the following analysis, we extract the bichromatic HHG spectra at zero relative temporal delay where the pulses are maximally overlapped in time. Large negative or positive delays, where there is no temporal overlap between the two pulses and therefore no pulse synthesis, provided the single colour measurements. We emphasize that the applied intensities of the 800 nm pulses are insufficient for producing HHG. Accordingly, no HHG signal was observed solely with the 800 nm pulse during any of the measurements. As the delay between the pulses is scanned, their envelopes overlap in time, leading to the observation of the synthesized field response. Note that the delay step (5 fs) is longer than the laser period at 1300 nm, and that the two beams are not phase locked. Therefore, we do not scan the CEP dependence, and the observed HHG spectra are an average over a range of varying CEP values.
Table 1. Various configurations of synthesized fields applied in the experiments. Five different powers of the 1300 nm beam (leftmost column) were combined with six different powers from the 800 nm beam (top row). HHG was measured from each synthesized field with total powers listed in the table. For completeness, the single colour HHG cases (800 nm power = 0 mW) are included in the table. Yellow, purple, and cyan highlights correspond respectively to the field combinations with the five highest, five lowest, and four median powers.

|
3. Results
3.1. Bichromatic synthesized HHG spectra
We start by studying the nonlinearity that underlies the enhancement mechanism by resolving the HHG yield and efficiency for various fundamental and bichromatic synthesized fields. The basic characteristics of the measured spectra can be seen in the representative experimental results shown in figure 2. Three key features are common to all the bichromatic measurements. The first, and most striking feature is the dramatic enhancement of the HHG yield for the bichromatic field compared with the single colour field. For the example shown in figure 2(a), the energy in the bichromatic field is about 20% higher than the single colour field, yet it produces an order of magnitude increase in the total HHG yield. Second, we observe an increase in spectral density due to the non-commensurate nature of the fundamental frequencies of the fields. The appearance of 'intermediate' harmonic orders, also observed in gas phase HHG, originate from the non-periodic nature of the field [24, 28]. Third, a high energy extension of the HHG cutoff ranging from 18–25 eV appears for each realization of the bichromatic field.

Figure 2. HHG enhancement and multi-plateau spectral structures in MgO with bichromatic synthesized fields. (a) Dark grey curve: single colour HHG spectrum with a 1300 nm central wavelength pulse (85 mW, intensity 0.71 × 10¹³ W cm−2). Green curve: bichromatic HHG spectrum with the addition of an 800 nm pulse (16 mW, 0.13 × 10¹³ W cm−2). Both the spectral amplitude and density are increased. Inset: magnification of the region >20 eV. For the single colour field, no HHG signal is measured in this region. With the bichromatic field, an additional plateau forms, with the cutoff energy extended from ∼18 eV to >25 eV. Green dash-dotted curve: bichromatic field with a higher energy 800 nm pulse (44 mW, 0.37 × 10¹³ W cm−2), showing further enhancement of the high energy plateau. (b) Same as (a) for a higher power in the 1300 pulse (100 mW, intensity 0.83 × 10¹³ W cm−2). Dark grey curve: single colour HHG spectrum with in the 1300 nm pulse only. Blue curve: bichromatic HHG spectrum with the addition of the 800 nm pulse (16 mW, 0.13 × 10¹³ W cm−2). The overall yield is more than twice that of (a). Inset: magnification of the region >20 eV. Although the single colour intensity is sufficient for producing HHG in the high energy plateau, the yield is significantly enhanced using the bichromatic field. Blue dash-dotted curve: bichromatic field with the addition of a higher energy 800 nm pulse (44 mW, 0.37 × 10¹³ W cm−2).
Download figure:
Standard image High-resolution imageThe multi-plateau structures in the spectra can be understood by examining the band structure of MgO, as shown in figure 3. For interband HHG, the bandgap energy, and thereby the emitted XUV energy following electron–hole recombination, can be mapped to a corresponding point in the crystal momentum space. For the lower energy conduction band, shown in blue, the maximum bandgap energy is ∼18 eV. As shown in figure 2(a), below a specific intensity of the single colour field (∼0.7–0.8 × 10¹³ W cm−2), only the lower conduction band is populated and the 18 eV cutoff is observed. At intensities greater than ∼0.8 × 10¹³ W cm−2 (figure 2(b)), excitation to the higher energy conduction band is induced and an additional plateau forms, with the cutoff energy extended from ∼18 eV to >25 eV. Previous studies have established that the extended cutoffs originate from multiple conduction bands [4, 10]. The higher energy cutoff corresponds to recombination at the maximum bandgap energy of the higher energy conduction band, shown in red in figure 3(b). In contrast to gas phase HHG, where the cutoff typically scales continuously with the field intensity, the increase in cutoff energy is discrete in solid state systems [29, 30].

Figure 3. Band structure of MgO for the Γ–X orientation. (a) Band energies as a function of crystal momentum k, where kc = 2π/a, and a = 4.212 Å is the lattice constant. Dashed black line: valence band, blue and red coloured lines: relevant energy bands for interband HHG that are dipole coupled to the valence band. Grey lines: additional bands that are not dipole coupled and therefore do not contribute to the HHG process. (b) The energy gap ɛg between the valence band and the two contributing conduction bands, as a function of crystal momentum k along the Γ–X orientation. Reprinted by permission from Springer Nature Customer Service Centre GmbH: Springer Nature, Nat. Photon., [4], Copyright © 2020.
Download figure:
Standard image High-resolution imageThe cutoff extension appears for all the bichromatic fields. Although the power in the 800 nm field is modest, the peak intensity increase upon addition of the second field is substantial, leading to a sub-cycle nonlinear enhancement as discussed in section 1. Upon constructive interference of the fields, the maximum attainable peak intensity Ipeak when the pulses are overlapped in time can be estimated as:

where I0 is the peak intensity of the stronger (1300 nm) pulse, and α = I1/I0 is the relative intensity of the two pulses, where I1 is the intensity of the weaker (800 nm) pulse. If the pulse widths are equal, which can be assumed in these experiments, then α is simply the power ratio between the two pulses. From equation (1) and table 2, we see that all synthesized peak intensities exceed the ∼0.7–0.8 × 10¹³ W cm−2 threshold for observing the higher energy plateau, which accounts for its appearance in all of the bichromatic spectra. The cutoff extension is dependent on the peak intensity and thus can be induced even when the combined two colour power is lower than the required power for the single colour field.
Table 2. Peak intensities of the synthesized fields in table 1, normalized in units of 1013 W cm−2 yellow, purple, and cyan highlights correspond respectively to the field combinations with the five highest, five lowest, and four median peak intensities.
|
Similarly, the HHG yield for the bichromatic field is markedly higher than for a single colour field with the same total energy. Interference of the two fields drastically modulates the pulse envelope and concentrates the pulse energy in a smaller number of cycles with larger field amplitudes [26]. Thus the field amplitude, and consequently the peak intensity, within the modulated bichromatic pulse (shown by the red curve in figure 1(b)) can be considerably larger than a single colour pulse at the same power (blue transparent curve in figure 1(b)). Previous studies in the gas phase showed the ability of the bichromatic field to enhance the tunnelling probability, leading to large HHG enhancements spanning the XUV and soft x-ray regions [24, 25]. In this work, due to the exponential dependence of ionization on the laser field strength, the bichromatic field leads to higher interband currents (and consequently, higher HHG yield) compared with the single colour case, where the energy is spread over more cycles with lower field amplitudes.
We can now summarize the HHG yield and efficiency for the complete set of bichromatic spectral measurements. Figures 4(a)–(d) show the measured spectra for single colour and three sets of bichromatic synthesized fields. For each subfigure, we show spectra for five powers of the 1300 nm pulses at a single fixed power of the 800 nm pulse. All the subfigures share the same scale, allowing their direct comparison. Even at the lowest added power of the 800 nm pulse (figure 4(b)), the increase in spectral density from the intermediate harmonic orders is clearly visible, along with an increase in HHG amplitudes across the complete spectrum. The HHG flux progressively increases with each corresponding increase in the 800 nm power. In figure 5, we show the spectrally integrated HHG yields as a function of the 1300 nm pulse power. This figure summarizes the nonlinear scaling of the HHG for the complete set of synthesized fields. In particular, we can extract the yield enhancement (ratio between the bichromatic and single colour yields) for each constant value of the 1300 nm pulse power. This yield enhancement ranges from one order of magnitude, for larger 1300 nm powers, to a full two orders of magnitude for lower 1300 nm powers.

Figure 4. Measured spectra for single colour (1300 nm) and bichromatic synthesized fields (1300 nm + 800 nm). (a) Single colour spectra measured for five power values of the 1300 nm pulses. In each subplot, black, red, blue, green, and purple curves correspond to 1300 nm pulse powers of 120 mW, 110 mW, 100 mW, 85 mW, and 70 mW respectively. (b)–(d) Bichromatic spectra with the addition of a fixed, discrete amount of power from the 800 nm pulses. The fixed powers are +6 mW (b), +20 mW (c), and +44 mW (d) (see table 1). Detector settings were not changed throughout the measurements, and all the subfigures share the same scale, allowing their direct comparison. Due to slight (∼4 nm) drifts in wavelength of the 1300 nm pulses during measurements with 110 mW and 85 mW pulses (red and green curves, respectively), small shifts in HHG energies (<0.06 eV) are observed for some spectra. The HHG yields are plotted in logarithmic scale in order to highlight all the spectral features, particularly at higher energies. The blue boxes in (a) and (c) highlight three spectral plateau regions that are used in the subsequent analysis—plateau 1 (spanning between 14–17 eV), plateau 2 (21–24 eV), and plateau C (11–14 eV).
Download figure:
Standard image High-resolution image
Figure 5. Spectrally integrated HHG yields for single colour (1300 nm) and bichromatic synthesized fields (1300 nm + 800 nm). Black squares: single colour (1300 nm pulses only) HHG yields measured for five power values. Red, blue, green, purple, yellow, and cyan squares: bichromatic HHG yields with the addition of 800 nm pulses with these powers respectively: 6 mW, 16 mW, 20 mW, 27 mW, 36 mW, and 44 mW. The straight lines are least squares fits to the respective data sets for each power value of the 800 nm pulses.
Download figure:
Standard image High-resolution imageThe enhanced HHG flux driven by the synthesized field was calibrated by measuring the XUV-induced current from an Si XUV photodiode (AXUV100G). For the maximum applied input power (164 mW in total power in both pulses), and after taking the known XUV transmission of the two Al/Mg/Al filters into account, we estimate a total XUV power of 0.1 nW, or 0.1 pJ/pulse at the 1 kHz repetition rate of the laser. This corresponds to a conversion efficiency of 6 × 10⁻¹⁰. Considering that the interaction length in solid state materials is highly limited due to XUV absorption, this is impressive considering the very low effective volume for HHG emission in the crystal.
Despite the high peak intensities used, we observed no damage to the MgO crystal during the duration of the measurements. This may indicate that the modulated pulse envelope created by the synthesized field is more favourable for limiting crystal damage, allowing the increase of the peak intensity while minimizing the incident pulse power on free standing crystals.
3.2. Spectral dependence of the HHG yield
In the following stage, we obtain a deeper insight into the underlying mechanism and resolve the HHG yields for different spectral ranges. We consider three plateau regions of equal widths in energy. Plateaus 1 and 2 span between 14–17 eV and 21–24 eV respectively. Prior studies have shown that these regions are dominated by interband HHG between the two distinct conduction bands and the valence band (see figure 3 and references [4, 31]. A third plateau, which we term as plateau C, spans between 11–14 eV and was associated with an intraband process [32]. In figure 6 we plot the integrated HHG yield within each plateau region as a function of the 1300 nm field power for various values of the 800 nm field power. Plateaus 1 and 2 display very similar scaling characteristics, their comparison requires deeper analysis that will be presented in the next section. In contrast, the yield in plateau C scales far more weakly with power, as seen by the flatter curves compared with plateaus 1 and 2. This observation suggests that an alternate mechanism is responsible for driving the HHG at these lower energies.

Figure 6. Comparing the HHG yield between the three plateaus. The integrated HHG yield (arb. counts) plotted as a function of the 1300 nm pulse energy for plateaus 1 (red squares), 2 (blue squares), and C (green squares). (a) Single colour yield measured for five power values of the 1300 nm pulses. (b)–(g) Bichromatic yields with the addition of a fixed, discrete amount of power from the 800 nm pulses. The fixed power ranges from +6 mW (b) to +44 mW (g) (see table 1) their respective coloured lines represent least squares fits of the scaling dependences. All the subfigures share the same scale, allowing their direct comparison.
Download figure:
Standard image High-resolution imageFor each plateau, adding the 800 nm field results in progressively higher signal yields and a decrease in the exponential scaling factor. The strongest scaling occurs for the single colour fields, as seen by the slope of the lines in figure 6(a). Each subfigure can be matched to a column of synthesized peak intensity values in table 2. In the single colour case (figure 6(a)), the 1300 nm pulse power increases by 72%, from 70 mW to 120 mW, which corresponds to peak intensities between 0.58–1 × 10¹³ W cm−2. In figure 6(b), with 6 mW of 800 nm pulse power, the bichromatic peak intensity ranges from 0.97–1.50 × 10¹³ W cm−2. Compared with the single colour case, these start from a higher intensity value and have a smaller relative increase of 55%. This trend continues as the 800 nm pulse power is further increased. Therefore, for low fundamental intensities, the synthesized field has a larger influence on the nonlinear efficiency of the HHG process. In comparison, for higher single colour intensities, the nonlinear enhancement is lower upon addition of the second field, which infers the observed scaling trends from figures 6(a)–(g). Saturation of the interband currents with increasing peak intensity may also affect the scaling dependence.
3.3. Enhancement of the HHG yield
A deeper look into the underlying mechanism requires a complete spectral analysis of the enhancement efficiency. In gas phase HHG, the strong field approximation provides a straightforward mapping between each XUV energy and its ionization time and probability. When driven by a bichromatic field, the ionization probability is enhanced throughout the entire ionization window. When HHG is dominated by the microscopic response, large signal enhancements are seen across the entire XUV spectral range [24, 25]. In contrast, solid state HHG offers more complex dynamics and therefore multiple mechanisms of spectral enhancement. In solids, the tunnel ionization yield, the excitation to higher bands, and the dynamics of the recombination step are controlled by the synthesized field. These combined effects give rise to enhancements with a pronounced dependence on the XUV energy.
In the following step, we perform a spectrally resolved study of the enhancement process. For a synthesized field with powers P0 of the 1300 pulse and P1 of the 800 nm pulse, we first extract the peak height H for each harmonic peak N in the spectrum. The enhancement factor Fenh for each harmonic energy ℏωN
is thus  . Stated differently, Fenh compares the bichromatic spectral peaks for driving field powers (P0, P1) with the spectral peaks in figure 4(b) for the same power P0 and the lowest power of the 800 nm pulse. This analysis resolves the signal enhancement by the synthesized fields at ∼0.6 eV spectral intervals. The non-commensurate nature of the synthesized field is the key to achieving this resolution, owing to the increase in spectral density from the 'intermediate' harmonic orders. This provides additional spectral information that is not obtainable in single colour or two colour commensurate experiments [4, 33].
In general, increasing the power of the 800 nm pulse increases the enhancement factor as expected. However, the most striking result is the sharp rise in enhancement starting in the vicinity of 15–17 eV and extending through to the cutoff of the high energy plateau >25 eV. The 15–17 eV spectral range corresponds to plateau 1 energies where HHG is dominated by interband recombination between the lower conduction band and the valence band. The effect is strongest for synthesized fields with higher values of α. In contrast, the lowest Fenh are seen around 11–15 eV, overlapping with plateau C. In this region there is also a weak dependence of Fenh on the 1300 nm power for all bichromatic field combinations.
From gas phase HHG results, we expect large enhancements when α and the ionization energy Ip are large, thereby providing a large relative increase in the sub-cycle ionization probability. In MgO, tunnel ionization generally occurs near the Γ-point where the bandgap is at a minimum. If the enhancement was entirely due to an increase in the tunnel ionization rate, then both intraband and interband HHG would benefit from the increase in electron current in the first conduction band, leading to similar Fenh values for both processes. Therefore, we conclude that additional enhancement mechanisms are involved. Recent studies show that the most prominent HHG emission in MgO occurs via enhanced constructive interference of electron trajectories at the recombination step [4]. The interference is induced at the critical points in the band gaps, where the gradient of the bandgap energy with respect to k approaches zero, giving rise to spectral caustics [34]. From the lower energy conduction band shown in figure 3, the expected HHG energy of the caustic is ∼17 eV. In the bichromatic data, Fenh indeed rises with increasing energy once recombination becomes the dominant mechanism as revealed by the presence of the spectral caustic in plateau 1.
We can interpret the low Fenh in plateau C in the following way. For low peak intensities, electrons are driven at lower crystal momenta, where the intraband process can be significant. This is observed in the intregrated yield measurements shown in figures 6(a) and (b), where the signal from plateau C approaches, or can even exceed that of plateau 1 for low power and peak intensity of the bichromatic fields. A similar situation was described in references [32, 35] in cases where interband HHG could be suppressed. However, for larger intensities, electron current is driven more strongly to the Brillouin zone edge by the synthesized field, where additional processes contribute. The subsequent dynamics at higher intensities, which include recombination to the valence band and transitions to higher energy bands, depend sensitively on the band gap energy and sub-cycle field structure [36].
The enhancement in plateau 2 displays a more complex behaviour. For lower powers of the 800 nm pulses (figures 7(a) and (b)), Fenh is slightly lower for plateau 2 compared with plateau 1, whereas for higher 800 nm pulse powers (figures 7(d) and (e)) it is slightly higher. Clearly these effects cannot be explained by a straightforward increase in the interband tunnel ionization probability.
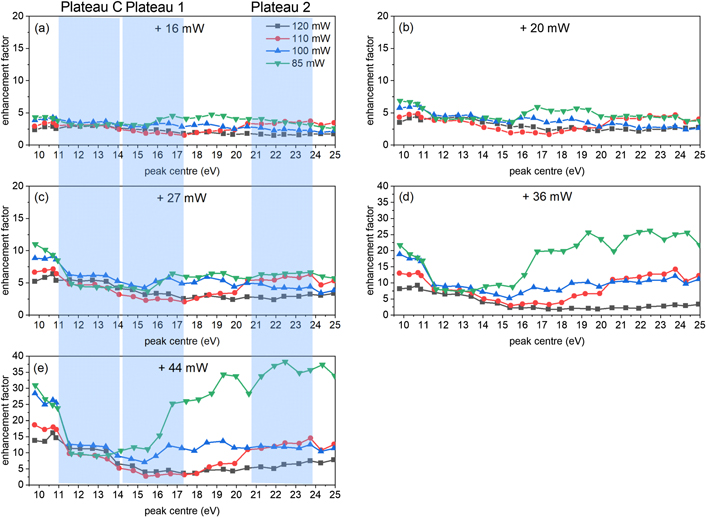
Figure 7. HHG enhancement as a function of energy for the synthesized fields. (a)–(e) Enhancement factors (see text for explanation) for four values of the 1300 nm pulse energy with the addition of a fixed, discrete amount of power from the 800 nm pulses. In each subplot, black, red, blue, and green curves correspond to 1300 nm pulse powers of 120 mW, 110 mW, 100 mW, and 85 mW, respectively. The fixed power ranges from +16 mW (b) to +44 mW (e). The data was smoothed using a moving window function with a 3 eV spectral width. The blue boxes in (a), (c), and (e) highlight the energy range of the three plateaus that are used in the analysis. In general, the enhancement increases with the intensity ratio of the two pulses (the factor α defined in equation (1)) with a clear jump near 15–17 eV, where interband recombination becomes the dominant mechanism, as revealed via spectral caustics.
Download figure:
Standard image High-resolution imageThe role of sub-cycle field-driven dynamics in multiband systems have been at the focus of a number of theoretical studies. The electron wavepacket's crystal momentum |k| is dependent on the vector potential of the laser field. Fields with a larger vector potential are more effective at accelerating the wavepacket to the edge of the Brillouin zone, where tunnel ionization between conduction bands is most likely to occur. However, for a single colour field, the field strength is zero where the vector potential is maximal. This creates unfavourable conditions for multiband HHG, and may account for the low HHG yield from higher energy plateaus [30, 36]. A multicolour synthesized field can overcome this limitation by tailoring the ionization times and probabilities at different sub-cycle points within the field. For multiband systems, such control results in larger interband currents and increased HHG signal yield, particularly for higher energy plateaus [13, 16]. Our measurements can thus serve as a benchmark for probing the temporal dynamics of multiband HHG emission. In addition, we note that if the peak intensity is sufficiently strong (see table 2), one must consider excitation to higher conduction bands, the dynamical band structure, and its effect on the ionization and recombination probabilities [37, 38].
3.4. Dependence on peak intensity and peak vector potential
In section 3.3, we discussed the importance of the sub-cycle electric field structure and its influence on the HHG yield. To this point, we have considered the scaling of the HHG with respect to the power in the synthesized field. What can we learn by looking at additional field parameters, such as the peak intensity or peak vector potential? In a multicolour field, the power level and the peak intensity can be independently controlled. For example, in tables 1 and 2 we see that the highest, lowest, and median combined powers of the synthesized field do not correspond precisely with the highest, lowest, and median combined peak intensities. A similar comparison can be made with the peak vector potential (table 3). What is the dependence of the HHG yield on these parameters?
Table 3. Peak vector potentials of the synthesized fields in table 1. The values are normalized in units of the vector potential of the highest intensity single colour field (1300 nm central wavelength, intensity = 1013 W cm−2), corresponding to a vector potential of 3.8 × 10⁻⁷ V s cm−1. Yellow, purple, and cyan highlights correspond respectively to the peak vector potentials with the five highest, five lowest, and four median values.

|
In figure 8, the integrated HHG signals from each of the three plateaus and all 30 synthesized fields are combined onto a single graph. The signals are plotted as a function of the peak intensity (in units of 1013 W cm−2) for each respective bichromatic synthesized field according to equation (1). Figure 8 allows a direct comparison of the enhancement mechanism, induced by the various combinations of the synthesized fields. If the HHG process scales straightforwardly with the peak intensity, then different field combinations with similar intensities would lead to similar HHG signal yields. Somewhat surprisingly, this simple dependence is observed for the yield from plateau C—there is almost no spread in the yield for different synthesized fields at any value of the peak intensity. Indeed, for intraband HHG, the electrons sample the nonlinearity of the conduction band where the signal is largely determined by the magnitude of the current that is tunnel ionized from the valence band, dictated by the strength of the electric field.

Figure 8. Integrated HHG yield for plateaus 1 (red squares), 2 (blue triangles), and C (green half-filled circles), with respect to the peak intensity of the bichromatic synthesized field. The five power values of the 1300 nm pulses is represented by the shading of the symbols, ranging from the highest power (120 mW, darkest shading) to the lowest (70 mW, lightest shading). The dark blue dashed oval highlights a group of synthesized fields with similar peak intensities but very different signal yields for plateau 1.
Download figure:
Standard image High-resolution image
For plateaus 1 and 2, in which interband HHG is dominant, the observation is significantly different. As an example, we can consider peak intensities in the range of 1.9 × 10¹³ W cm−2. The dark blue dashed oval in figure 8 highlights the integrated HHG yield within plateau 1 for five different combinations of the two fields. Although the power in the 1300 nm pulse is different for each of the five synthesized fields, there is only a ±2% variation in the peak intensities. Nevertheless, the measured signal yield varies by more than a factor of five. Similar observations can be made for the signal yield in plateau 2. However, if we inspect the peak vector potentials for these fields (normalized to that of a 1300 nm pulse with intensity of 1013 W cm−2, see table 3), we find that the largest value (1.0(1300 nm) + 0.22(800 nm) = 1.22) corresponds to the largest HHG yield, and the smallest value (0.76(1300 nm) + 0.37(800 nm) = 1.14) corresponds to the smallest HHG yield. Due to the inverse frequency dependence of the vector potential, reducing α while keeping the peak intensity fixed, increases the vector potential of the synthesized fields. Indeed, figure 8 shows the signal yields are well ordered with respect to the peak vector potentials at almost any value of the peak intensity. The synthesized fields with the highest 1300 nm pulse power (darker shaded symbols) consistently produce the highest HHG yields in plateau 1 and plateau 2. For decreasing 1300 nm pulse power (progressively lighter shaded symbols), the HHG yield also tends to decrease monotonically.
Interference between the fields highly modulates the temporal envelope of the synthesized pulse. A more complete analysis must go beyond consideration of the peak intensity or vector potential, and study the multiple bands dynamics induced by the complete, multicycle synthesized pulse. Such studies have only been carried out theoretically [13, 15, 16]. Nevertheless, using these simple scaling relations we can experimentally resolve the spectral dependence of the peak intensity and vector potential in our data. These observations directly connect the sub-cycle field structure and the electronic dynamics that give rise to HHG in multiband systems.
4. Conclusion
In this work, we have performed a systematic study of HHG with non-commensurate bichromatic synthesized fields. Enhancement of the signal yield up to two orders of magnitude has been demonstrated. The enhancement mechanism occurs on a microscopic level and is controlled through the sub-cycle properties of the synthesized laser field. Such an approach can facilitate the development of compact, high flux sources of XUV radiation based on solid state materials. Analysis of the emitted HHG spectra enables identification of spectral contributions relating to intra- and interband HHG, whose dependence with respect to the field parameters can be straightforwardly extracted. This scheme opens the door to resolving multiband dynamics in solids by studying the HHG spectral response with respect to shaped laser fields. In the future it will enable the robing of a range of strong field solid state phenomena—from dynamical band structure to multi electrons interaction or sub-cycle phase transitions [2].
Acknowledgments
We wish to thank our colleague Binghai Yan for the band structure calculations that are reproduced in figure 3. ND is the incumbent of the Robin Chemers Neustein Professorial Chair. ND acknowledges the Minerva Foundation, the Israeli Science Foundation, the Crown Photonics Center, and the European Research Council (CoG Project Number 864127 - ATTO-GRAM) for financial support. AJNU acknowledges financial support by the Rothschild Foundation and the Zuckerman Foundation.
Data availability statement
The data that support the findings of this study are available upon reasonable request from the authors.