
Abstract
Recent developments in femtosecond laser technology have enabled the generation of a nearly monocyclic strong terahertz (THz) pulse with an amplitude greater than 100 kV cm−1. Such a THz pulse can be used to control not only the elementary excitations in solids such as phonons, magnons, and excitons but also the electronic phases. To achieve ultrafast phase control in the sub-ps time domain with a THz pulse, correlated electronic materials that demonstrate electronic phase transitions without large structural changes induced by external stimuli, such as by temperature, pressure, and light can be used. In this paper, we review recent studies on electronic phase controls using a nearly monocyclic THz pulse in organic molecular compounds with correlated electron systems, TTF-CA (TTF: tetrathiafulvalene and CA: p-chloranil), α-(ET)2I3 (ET: bis(ethylenedithio)tetrathiafulvalene), and κ-(ET)2Cu[N(CN)2]Br. TTF-CA undergoes a neutral-to-ionic phase transition as the temperature decreases. It demonstrates an electronic-type ferroelectricity in the ionic phase, in which ferroelectric polarization is generated from intermolecular charge transfers across the neutral-to-ionic phase transition. THz-pulse pump second-harmonic-generation probe and optical-reflectivity probe measurements show that ferroelectric polarization in the ionic phase can be rapidly modulated by a THz pulse via charge transfers induced by an electric field. In α-(ET)2I3, rapid polarization modulation by a THz pulse was also achieved in the ferroelectric charge-order phase. Detailed analyses of reflectivity changes induced with THz electric fields revealed that the ferroelectric polarization originated from intermolecular charge transfers and was oriented diagonally to the crystal axes. These results demonstrate that the ferroelectricity of this compound was electronic, similar to that of the ionic phase of TTF-CA. In the para-electric neutral phase of TTF-CA, a macroscopic polarization was generated by a THz pulse via the dynamics induced by an electric field on microscopic ionic domains. In κ-(ET)2Cu[N(CN)2]Br, a transition from a Mott insulator to a metal by a THz pulse was demonstrated by observing Drude-like low-energy spectral weights induced by the electric field. A THz pulse induced doublon−holon pair production by quantum tunnelling processes, which collapsed the original Mott gap in under a picosecond. These results suggest that strong THz-pulse irradiation is an effective approach for the ultrafast control of electronic phases in correlated electron materials.
Export citation and abstract BibTeX RIS

Original content from this work may be used under the terms of the Creative Commons Attribution 3.0 licence. Any further distribution of this work must maintain attribution to the author(s) and the title of the work, journal citation and DOI.
1. Introduction
A terahertz (THz) pulse—the focus of this review—is a nearly monocyclic electromagnetic wave with a central frequency of ∼1 THz and a temporal width of ∼1 ps. One THz corresponds to a photon energy of 4.1 meV, wavenumber of 33.3 cm−1, and a wavelength of ∼300 μm. Recent advances in femtosecond laser technology have enabled the generation and detection of such pulses [1]. Various methods of generating THz pulses have been reported, and one widely used method being optical rectification [2, 3]. Its conceptual scheme is shown in figure 1(a). A commonly-used femtosecond laser source is a titanium (Ti) sapphire laser with the central wavelength of ∼800 nm. A typical temporal width of its output pulse is ∼100 fs. Its spectral width is ∼10 nm, which is ∼5 THz and ∼20 meV in photon energy (figure 1(a)). When such a femtosecond laser pulse is incident on a second-order nonlinear optical crystal, differential frequency generation occurs within the pulse, and a pulsed THz electromagnetic wave is emitted. This corresponds to optical rectification for light with a single frequency. The frequency range of the THz pulse thus obtained depends on the frequency width of the incident femtosecond laser pulse, or equivalently, the inverse of its temporal width. Therefore, when an ultrashort incident laser pulse is used, a THz electromagnetic wave pulse can be obtained over a wide frequency range.
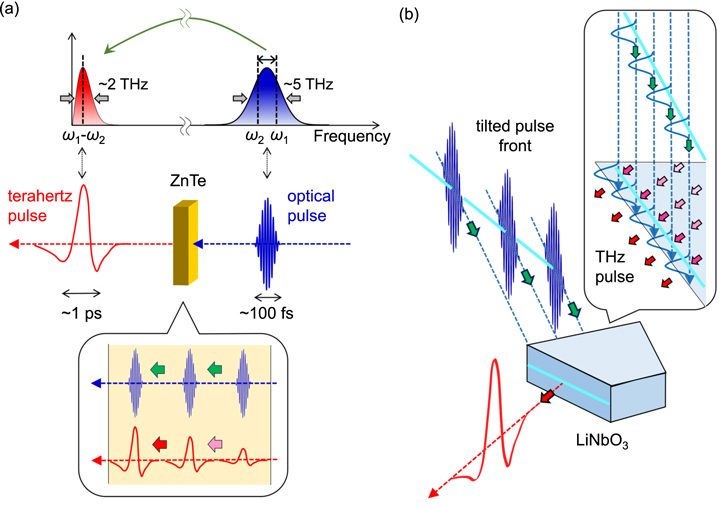
Figure 1. (a) Schematic of THz pulse generation in a second-order nonlinear crystal, ZnTe, via the optical rectification process. The THz pulse is enhanced under the phase-matching condition (the lower panel). (b) Schematic of THz pulse generation in a LiNbO3 crystal via the optical rectification process in the tilted-pump-pulse scheme. The pulse front of the input is tilted to satisfy the phase-matching condition in the LiNbO3 crystal.
Download figure:
Standard image High-resolution imageIn order to use a THz pulse to control the electronic states of solids, it must be strengthened. A widely used nonlinear optical crystal capable of generating a THz pulse is ZnTe, as the phase-matching condition between an incident visible or near-infrared (IR) pulse and an output THz pulse is fulfilled for a wide frequency range [4]. When the output pulse of a Ti-sapphire regenerative amplifier (∼800 nm) introduced to a ZnTe crystal is strengthened, two-photon absorptions necessarily occur within the crystal. Consequently, the damage threshold for an 800 nm pulse is low in a ZnTe crystal and the excitation laser fluence cannot be increased, making it difficult to raise the intensity of a THz pulse. Therefore, ZnTe is not appropriate for generating a strong THz pulse with an amplitude larger than 100 kV cm−1.
To strengthen a THz pulse, a wide-gap nonlinear optical crystal is needed that has a large second-order nonlinear susceptibility and in which two-photon absorption does not occur. In such conditions, LiNbO3 is generally used. In LiNbO3, the phase-matching condition for an incident 800 nm pulse and a radiated THz pulse is not fulfilled when the THz pulse propagates in the same direction as the 800 nm pulse. To overcome this, J Hebling and collaborators proposed a tilted-pump-pulse scheme, in which efficient phase matching generates a strong THz pulse radiating in a direction diagonal to the direction of the incident laser pulse [5]. Using this method and an 800 nm pulse with a pulse energy of 4 mJ from a Ti-sapphire regenerative amplifier, a THz pulse with an electric-field amplitude exceeding 1 MV cm−1 was successfully generated [6]. More recently, a new method combining an organic nonlinear optical crystal, 4-N,N-dimethylamino-4'-N'-methyl-stilbazolium 2,4,6-trimethylbenzenesulfonate (DSTMS) and a near-IR femtosecond laser pulse at 1500 nm has been developed [7, 8]. It has been reported that a very strong THz pulse with an electric-field amplitude of 83 MV cm−1 was generated using this method [8].
With these developments aimed at generating strong THz pulses, studies have attempted to control the electronic properties and crystal structures of solids by a THz pulse (figure 2) [9–12]. Previous studies using conventional semiconductors investigated the lattice responses to a strong excitation of optically active phonons (figure 2(b)) [13, 14], the responses of excitons under a strong electric field and their dissociations to electron−hole pairs (figure 2(c)) [15, 16], and the enhancement of carrier number by the acceleration of bound carriers (figure 2(d)) and subsequent impact ionisation processes [17–22]. The control of superconducting states is also an interesting subject. In a BCS-type superconductor NbN, an oscillation of a superconducting order parameter was successfully driven by a THz electric field via a nonlinear optical process in the THz frequency domain [23]. More recently, in Nb3Sn, it was suggested that a phase featuring long-lived prethermalized quasiparticles is produced after a single-cycle THz pulse quenches the superconducting gap [24]. In magnetic semiconductors, it has been shown that magnons [25–29] and electromagnons [30] can be controlled via the magnetic-field component (figure 2(e)) and electric-field component of a terahertz pulse, respectively. Since a magnetic field breaks the time reversal symmetry, a topological phase transition might be induced by the magnetic-field component of a THz pulse. In fact, it was theoretically revealed that chiral spin liquids can be induced by circularly polarized light in frustrated Mott insulators [31].
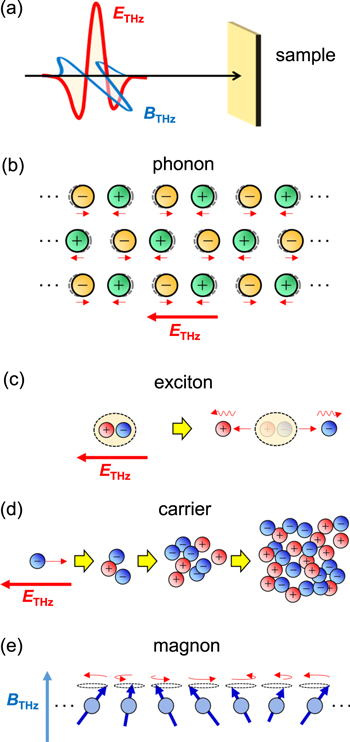
Figure 2. (a) Schematic of a nearly monocyclic THz pulse. The electric field (ETHz) and magnetic field (BTHz) of the THz pulse are shown by red and blue lines, respectively. (b)–(e) Typical examples of physical properties controlled by a THz pulse in solids: (b) phonon excitation, (c) exciton dissociations, (d) carrier accelerations and subsequent impact ionisations, and (e) magnon excitation.
Download figure:
Standard image High-resolution imageAs for the control of electronic structure or phase of a solid by a THz pulse, pioneering research was performed on vanadium dioxide (VO2) by M. Liu and collaborators [32]. In this research, they succeeded in converting VO2 from an insulator to a metal by using a THz electric field enhanced in a metamaterial resonator up to ∼4 MV cm−1. The insulator−metal transition in VO2 is of a strong first order, and is accompanied by a large structural change [33, 34], so that an electric field larger than ∼2 MV cm−1 is necessary to drive its transition, which takes a few picoseconds and is dominated by heating of the system (see section 4.1). To achieve ultrafast phase control in the sub-ps time domain via a THz pulse in solids, an electronic phase transition without large structural changes can be employed. With this strategy, correlated electron materials are good targets for study. In this paper, we review studies of electronic phase control via THz pulses in organic molecular compounds with correlated electron systems [35–38] (this category of materials being thus controllable). To introduce discussions of electronic-phase control via THz pulses, we first summarise the features of the electronic structures and physical properties in organic molecular compounds.
In organic molecular compounds, the overlap of the wavefunctions of the π-orbitals between two neighbouring molecules is not large, and the transfer energy t between two neighbouring molecules is ∼0.1 eV [39]. The kinetic energy of the π-electrons or the bandwidth dominated by t is comparable to the Coulomb repulsive interaction between π-electrons, so that this category of materials belongs to correlated electron systems. In addition, each constituent molecule has a specific conformation, typically planar, resulting in an anisotropy in three-dimensional arrangements of molecules. Moreover, each molecule has π-orbitals extending perpendicularly to the molecular plane, so that quasi-one-dimensional or two-dimensional electronic structures are frequently formed in organic molecular compounds. Because of such small band widths and the low-dimensionality in electronic structures, the electron−lattice interaction can play an important role in the electronic structures and physical properties. Such electron correlation, low-dimensionality, and electron−lattice interaction produces characteristic electronic phases such as the Mott insulator, charge order, Peierls and spin-Peierls, correlated metal, and superconducting states [40–43]. Through triggering the instability in those ordered states with a THz pulse, phase control can be induced by THz electric fields. Another significant finding in studies of such phase control is that the kinds of interaction dominant for the stabilisation of electronic structure in various ordered states can be revealed via the observation of coherent dynamics after excitation with a THz pulse.
This review paper is constructed as follows. In section 2, we briefly describe the experimental techniques for the detection of electronic-state changes made by a THz-electric-field pulse. In section 3, we review studies of the control of macroscopic polarization via THz electric fields in organic molecular ferroelectrics and dielectrics. In section 4, we review how Mott insulators transition to metals in response to THz electric fields. This review is summarised in section 5.
2. Experimental methods
In order to detect an electronic-state change caused by a THz electric-field pulse, a THz-pulse pump optical-reflectivity probe and absorption-probe spectroscopy are powerful tools. Such spectroscopy is used in the studies discussed in sections 3 and 4. In this section, we explain this method, exemplifying the setup we usually use. A schematic of a measurement system with a reflection configuration is shown in figure 3. We can perform a measurement in a transmission configuration by changing the position of the detector.
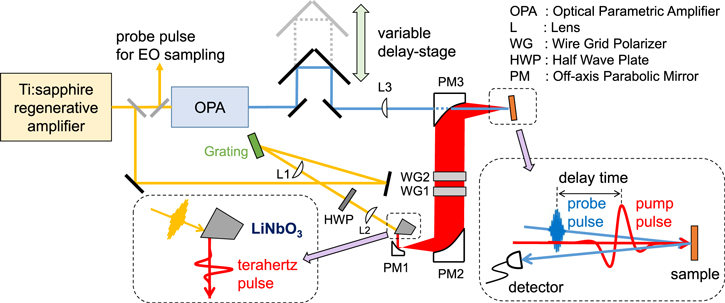
Figure 3. Schematic of THz-pulse pump optical probe spectroscopy in a reflection configuration. THz pump pulses are generated from a LiNbO3 crystal by the tilted pulse-front scheme.
Download figure:
Standard image High-resolution imageThe light source is a titanium sapphire regenerative amplifier (RA), from which a laser pulse with a central wavelength of 800 nm (photon energy of 1.55 eV), temporal width of ∼100 fs, repetition rate of 1 kHz, and pulse energy of 4.5 mJ is emitted. The output from the RA is divided into three beams. The first and second beams are used for the generation and detection of a THz pulse, respectively. The third beam is used to generate a probe pulse in the wide photon energy range.
To generate a strong THz pulse, the tilted-pump-pulse scheme proposed by J Hebling et al mentioned in section 1 is used. In this scheme, the wavefront of an 800 nm pulse is tilted, and then is incident on a second-order nonlinear optical crystal, a 62°-cut LiNbO3 doped with 1.3 mol % MgO. Hereafter, this crystal is denoted LN. This configuration enables phase matching for differential frequency generation in the LN between an output pulse (800 nm) from a titanium sapphire RA incident on it and a THz pulse radiating in a diagonal direction from it.
The THz pulse thus obtained is focused on the sample by using three off-axis parabolic mirrors (figure 3). To measure the electric field waveform of the THz pulse on the sample position, an electro-optical (EO) sampling method with a (110)-oriented ZnTe crystal is used [44–46]. The second beam removed from the RA output is used as a probe pulse, or sampling pulse. The electric-field amplitude of a THz pulse is calculated from the following formula,

where I∣∣ and I⊥ are the intensity of the sampling pulse polarized parallel to the horizontal and vertical axes, respectively, λ0 is the wavelength of the sampling pulse (800 nm), r41, l, and n0 are the Pockels constants and the thickness and refractive index of ZnTe, respectively. The parameters (tSi)j and tZnTe are the Fresnel loss of Si plates (j: the number of the plates) and that of the surface on the ZnTe crystal, respectively. The parameter values used for the calculation are r41 = 4.04 pm V−1 [45], l = 0.3 mm, n0 = 2.87 [47], (tSi)j = (0.7)j, and tZnTe = 2/(nTHz + 1) = 0.48 (nTHz = 3.17 [48]).
The third beam from the RA is used as the excitation source for an optical parametric amplifier, from which optical probe pulses of 0.1–4 eV were obtained. By measuring the reflectivity change over a wide photon energy region, the change in an electronic structure by a THz pump pulse can be characterised. A delay time td of the probe pulse relative to the THz pump pulse was controlled by changing the path length of the probe pulse (figure 3).
To study the polarization control in dielectrics, changes in the second-harmonic generation (SHG) by a THz pulse are key, because the SHG intensity sensitively reflects the magnitude of the polarization [49]. In general, SHG signals are measured in the transmission configuration. However, when SH lights are absorbed in a sample, they cannot be transmitted through the sample. In such cases, it is necessary to measure SHG signals in the reflection configuration, in which the coherence length for an SHG process is not long. Therefore, the electric field magnitude of a THz pulse is constant within the coherence length. In the studies reported in this review, THz-pulse pump SHG probe measurements were performed using the reflection configuration.
3. Control of electronic polarization by a THz pulse
3.1. Concept of ultrafast polarization control by a THz pulse in electronic-type ferroelectrics
In this section, we review studies of the controls of ferroelectric polarizations as a typical example of controlling electronic properties by a THz electric field in organic molecular compounds with correlated electron systems.
For optical functionality, an important characteristic of ferroelectrics is the optical nonlinearity originating from breaking inversion symmetry [50]. An example is the electro-optical Pockels effect, by which optical constants are changed in proportion to an external electric field. Another representative is the second-order optical nonlinearity, by which a polarization proportional to the square of the electric field of the incident light is produced. Using the Pockels effect, polarized light can be rotated by changing the refractive index via the external electric field, while the second-order optical nonlinearity is indispensable for the second-harmonic generation (SHG) and other wavelength conversions of light. If the amplitude or direction of ferroelectric polarization is rapidly controlled by a THz electric-field pulse, it will be possible to achieve advanced control of light.
For optical switching, the control time (frequency) should be in the range of 10–1 ps (100 GHz−1 THz). In ferroelectrics, the time (frequency) necessary for polarization reversal is generally of the order of 1 s (1 Hz) to 1 nsec (1 GHz) [51]. How about the modulation of polarization? In conventional ferroelectrics, a ferroelectric polarization originates from the displacement of anions and cations in opposite directions, as shown in figure 4(a), in which the polarization is denoted as Pion. In this case, the modulation speed is dominated by the frequency of optical phonons corresponding to the displacements of those ions.
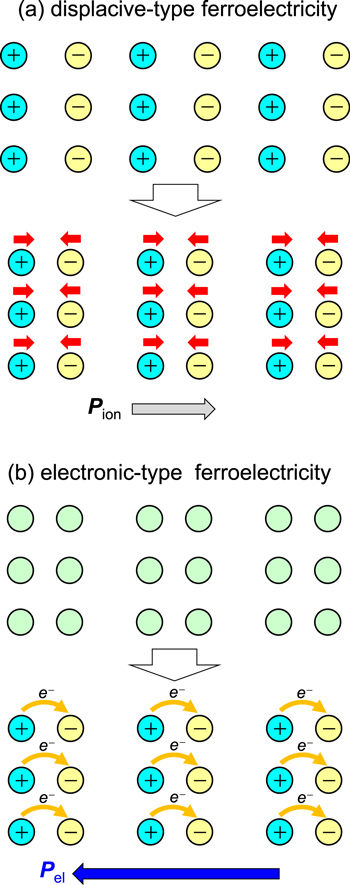
Figure 4. Comparison of (a) displacive-type ferroelectricity and (b) electronic-type ferroelectricity. In a displacive-type ferroelectric, the ferroelectric polarization (Pion) is generated from ion displacements, while in an electronic-type ferroelectric, the ferroelectric polarization (Pel) originates from changes in electron distributions or inter-site electron transfers.
Download figure:
Standard image High-resolution imageTo realise ultrafast polarization control via a THz electric field, electronic ferroelectrics—that have recently been explored—are advantageous. In some ferroelectrics, ferroelectric polarization originates not from ion displacements but from the change of electron distributions or inter-site electron transfers [52–60]. Here, a system consists of dimer sites as shown in the upper part in figure 4(b). When an electron transfer occurs in each dimer in the same direction, a macroscopic polarization is produced from a sum of the dipole moments of each dimer [61, 62], denoted by Pel. Such ferroelectricity is called 'electronic ferroelectricity' or 'electronic-type ferroelectricity', and is different from the conventional displacive-type ferroelectricity. Note the opposing directions of the polarizations Pion and Pel in these two cases as shown in the lower part of figures 4(a), (b), although the arrangement of cations and anions are the same. A typical example of such electronic ferroelectricity is observed in an organic molecular compound, TTF-CA (TTF: tetrathiafulvalene, CA: p-chloranil) [56, 58, 59]. This compound shows the electronic ferroelectricity in the ionic phase below Tc = 81 K. An organic molecular conductor, α-(ET)2I3 (ET: [bis(ethylenedithiolo)]-tetrathiafulvalene), was suggested to show electronic ferroelectricity in the charge-order (CO) phase below Tc = 135 K, although the electronic origin of the ferroelectricity has not been demonstrated clearly [54, 55]. In these compounds, it is expected that the polarization can be rapidly controlled by a THz electric field. In the following sub-sections, we review recent studies on the modulation and generation of the polarization in the sub-picosecond time scale in single crystals of TTF-CA [35, 37] and α-(ET)2I3 [36].
3.2. Polarization modulation by a THz pulse in the ferroelectric ionic phase of TTF-CA
TTF-CA is a mixed-stack organic molecular compound, composed of donor (D) TTF molecules and acceptor (A) CA molecules. The molecular structures of TTF and CA, and the crystal structure of TTF-CA are shown in figure 5(a). TTF and CA molecules stack along the a-axis forming a quasi-one-dimensional electronic state. TTF-CA is a neutral van-der-Waals crystal at room temperature. Upon lowering its temperature to Tc = 81 K, it undergoes a phase transition to an ionic crystal via collective electron transfers from the TTF to CA molecules. This phase transition is called a neutral (N) to ionic (I) phase transition or simply an NI transition [63, 64].
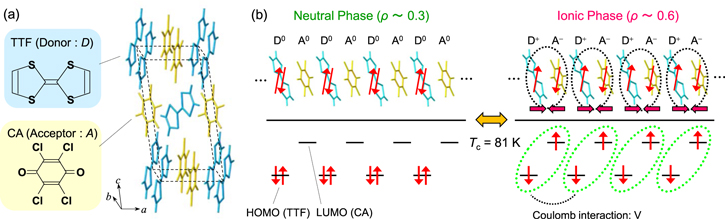
Figure 5. (a) Molecular structures of TTF and CA and the crystal structure of TTF-CA. (b) Schematics of electronic structures in the neutral (N) phase and the ionic (I) phase in TTF-CA. Ovals in the I phase denote dimers.
Download figure:
Standard image High-resolution imageThe electronic states of the N and I phases in this compound are shown in figure 5(b). In the lower part of this figure, the highest occupied molecular orbital (HOMO) of the D molecule and the lowest unoccupied molecular orbital (LUMO) of the A molecule are illustrated. The overlap of the wavefunctions between the LUMO of the A molecule and the HOMO of the D molecule is characterised by the transfer energy t. The magnitude of t (∼0.2 eV) is relatively smaller than the Coulomb attractive interaction between neighbouring D and A molecules as well as the energy difference between the LUMO of the A molecule and the HOMO of the D molecule. Therefore, the description using localised electrons as shown in the lower part of figure 5(b) offers a good approximation to understand the electronic state. The I phase is stabilised by the energy gain because of the long-range Coulomb attractive interaction, that is, the Madelung potential, which gives rise to the collective nature of the ionic state. In this sense, TTF-CA is a kind of correlated electron material. Simply put, the lattice contraction caused by the decrease of temperature increases the Madelung potential, which converts TTF-CA from the N phase to the I phase.
In mixed-stack organic molecular compounds including TTF-CA, the electronic state is characterised by the degree of CT ρ from A to D molecules and is expressed as [⋯D+ρA−ρD+ρA−ρD+ρA−ρD+ρA−ρ⋯]. The value of ρ is not equal to 0 or 1, but equal to approximately 0.3 and 0.6 in the N and I phases, respectively [65]. Such partial values of ρ are caused by the hybridisation of the neutral and ionic states through overlapping of the molecular orbitals of D and A molecules along the a-axis as mentioned above. In this review, however, the simpler expressions, [⋯D0A0D0A0D0A0D0A0⋯] and [⋯D+A−D+A−D+A−D+A−⋯] are used to express the N state and the I state respectively, as shown in figure 5(b). Such expressions enable an intuitive understanding of the electronic states of the N and I phases.
In the I phase, each molecule has spin (S = 1/2). As a result, DA molecules are dimerized because of their spin-Peierls-like instability, as shown by the ovals in the right panel of figure 5(b) [66, 67]. Therefore, in TTF-CA, the N state with regular molecular stacks and the I state with dimerized molecular stacks are nearly degenerate. Because of such valence instability, the NI transition in TTF-CA can be caused not only by lowering temperature, but also by photoirradiation with a near-IR femtosecond laser pulse [68–75].
Another important feature of TTF-CA is its unique ferroelectricity. When a DA stack is dimerized in the I phase, inversion symmetry is lost within individual stacks and each stack should have a dipole moment. Previous x-ray and neutron diffraction studies on TTF-CA have revealed that the dimeric molecular displacements are three-dimensionally ordered in the I phase [66], suggesting that macroscopic polarization can be generated in the I phase. If TTF-CA is a displacive-type ferroelectric, dimeric molecular displacements of the ionic molecules, D+ and A−, in the opposite directions produce ferroelectric polarization Pion along the a-axis, as indicated by the grey arrow in figure 6(a). This dominates the net polarization P (the red arrow) of the compound. However, recent detailed x-ray studies and first-principles theoretical calculations have revealed that the direction of the net polarization P is opposite to that of Pion [56, 58, 59]. Those studies indicate that the polarization P originates not from the displacement of ionic molecules (Pion), but from the additional charge-transfer processes with the magnitude of δρ (∼0.2) within each dimer, as shown by the curved arrows in figure 6(b). The polarization due to these charge-transfer processes is denoted by Pel. In the figure, the movement of positive charges is indicated by curved arrows, and their directions are opposite to those in the right part of figure 4(b) in which electron movement is indicated. This is a typical example of electronic ferroelectricity, since the polarization P is dominated by intermolecular electron transfers. The magnitude of the polarization is very large, reaching 6.3 μC cm−2, 20 times larger than that estimated by the point charge model [59]. Therefore, in TTF-CA, the magnitude of the polarization P can be modulated in the sub-picosecond time scale by a THz-electric-field pulse via intermolecular charge transfers (CTs).
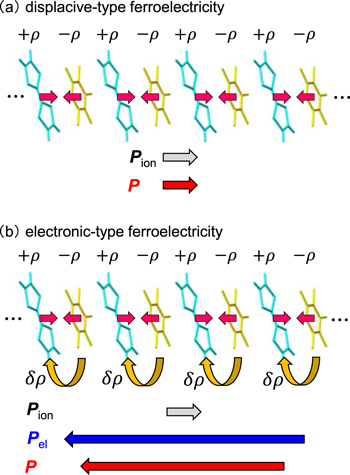
Figure 6. Possible polarization-generation mechanisms in the I phase of TTF-CA; (a) displacive-type ferroelectricity and (b) electronic-type ferroelectricity. Pion and Pel are polarizations respectively originating from molecular displacements and from fractional intermolecular CTs. P (= Pion + Pel) shows the net polarization.
Download figure:
Standard image High-resolution image3.2.1. Rapid modulation of ferroelectric polarization in the I phase of TTF-CA
In this sub-section, we show that the amplitude of the ferroelectric polarization in the I phase of TTF-CA can be rapidly modulated by a THz electric field [35]. As already mentioned, SHG is the most effective probe to detect the change of the ferroelectric polarization amplitude induced by a THz electric field pulse. The experimental configuration of the THz-pulse pump SHG probe measurement is shown in figure 7(a). The measurement was performed in the reflection configuration with the polarization directions of the fundamental probe pulse (1.3 eV) and the THz pump pulse both parallel to the molecular stacking axis (the a-axis). When TTF-CA was irradiated with a 1.3 eV fundamental pulse without THz electric fields at 65 K, 2.6 eV SH light was emitted. The SH light intensity ISHG was measured as a function of the input probe-pulse intensity at 1.3 eV, and the former was proportional to the square of the latter (not shown). This confirmation is important to avoid the saturation of SH light intensity and to execute accurate measurements.

Figure 7. (a) Schematic of THz-pulse pump SHG probe measurement. (b), (c) Time evolutions of the THz-electric-field-induced changes in SH intensity ΔISHG(t)/ISHG at 65 K (open circles). Red lines show electric-field waveform ETHz(t) of a THz pump pulse; (b) ETHz(0) = 36 kV cm−1 and (c) ETHz(0) = 415 kV cm−1.
Download figure:
Standard image High-resolution imageNext, we discuss the results of the THz-pulse pump SHG probe experiment. A typical result is shown in figure 7(b). The red line shows the electric-field waveform of the THz pump pulse (ETHz(t)). The origin (t = 0) is set to the time when the electric field has its maximum amplitude. In this case, the maximum electric-field amplitude was ETHz(0) = 36 kV cm−1. The open circles in figure 7(b) show the time evolution of the change in the SH light intensity, ΔISHG(t)/ISHG, which is in good agreement with that of ETHz(t) (the red line). This shows that ΔISHG(t)/ISHG ∝ ETHz(t) and the macroscopic polarization P was instantaneously modulated by the THz electric-field pulse. ΔISHG(0)/ISHG is 1.5% at ETHz(0) = 36 kV cm−1. When the electric-field amplitude ETHz(0) is increased up to 415 kV cm−1, ΔISHG(0)/ISHG reaches ∼13% as shown in figure 7(c). The magnitude of the polarization modulation will be discussed later.
We next discuss the results of the THz-pulse pump optical-reflectivity probe measurements, from which important information about the nature of the THz-electric-field-induced polarization modulation can be obtained. Figure 8(a) shows the polarized reflectivity spectra in the visible region of TTF-CA, which are measured with the electric field of light perpendicular to the molecular stacking axis a (E⊥a). As this light polarization is almost parallel to the molecular plane, intramolecular (IM) transitions can be detected. The peak at ∼2.2 eV was assigned to the IM transition of TTF molecules. It is known that the energy position of this band depends sensitively on the degree of CT ρ [63]. As seen in figure 8(a), the peak energy of this band was 2.38 eV at 90 K in the N phase, 2.25 eV at 77 K and 2.24 eV at 4 K in the I phase. Such a shift of the peak energy reflects the change in the degree of CT ρ—that is, ρ ∼ 0.3 (90 K) to ∼0.53 (77 K) and ∼0.58 (4 K) [65]. In other words, the peak photon energy decreased with increasing ρ. Therefore, by measuring the reflectivity change ΔR/R in this region, the electric-field-induced changes in ρ, Δρ, could be evaluated.

Figure 8. (a) Polarized reflectivity spectra of TTF-CA with the electric field of light E perpendicular to the a-axis (E⊥a) in the energy region of the intramolecular transition band of TTF at 90 K, 77 K, and 4 K. (b) Probe energy dependence of the reflectivity change at td = 0 ps, ΔR(0)/R, at 78 K (orange circles). The broken line shows the first derivative (dR/dE) of the reflectivity spectrum at 77 K with respect to the photon energy E, which shows the reflectivity change by an increase in the degree of CT (ρ).
Download figure:
Standard image High-resolution imageFigure 9(a) shows a schematic of THz-pulse pump optical-reflectivity probe spectroscopy. First, probe photon energy was set at 2.2 eV, the peak energy of the IM transition band of TTF in the I phase. The polarization of the probe pulse was perpendicular to the a-axis (E⊥a) and that of the THz pump pulse was parallel to the a-axis (E//a). The electric field waveform ETHz(t) of the THz pulse and its Fourier power spectrum are shown in figures 9(b) and (c) respectively. The maximum amplitude of the electric field is 38 kV cm−1. In figure 9(d), the time evolution of the transient reflectivity change ΔR(t)/R at 78 K is shown by the blue circles. ETHz(t) is also shown by a thin solid line in a normalized scale. The time evolution of ΔR(t)/R near the time origin is very similar to that of ETHz(t). By changing the probe energy, similar measurements were performed (not shown). In figure 8(b), the maximum values of the reflectivity changes at the time origin, ΔR(0)/R, are plotted by orange circles as a function of the probe energy. These data agree well with the first derivative of the reflectivity dR/dE shown by the broken line, indicating the reflectivity change by the red shift of the reflectivity peak. This agreement demonstrates that ρ was increased by the THz electric field.
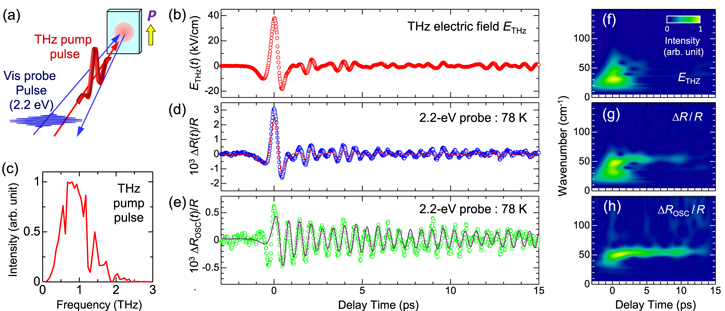
Figure 9. (a) Schematic of THz pump optical-reflectivity probe measurement. (b) Electric-field waveform (ETHz(t)) of a THz pulse. (c) Fourier power spectrum of ETHz(t) of the THz pulse. (d) Time evolution of reflectivity changes ΔR(t)/R at 2.2 eV (E⊥a) and at 78 K in the I phase (circles) and the normalized ETHz(t) (the red solid line) in TTF-CA. (e) Oscillatory component ΔROSC(t)/R (circles) of ΔR(t)/R and the fitting curve (solid line) (see text). (f), (g), and (h) Time-dependent Fourier power spectra obtained by the wavelet analyses of (b), ETHz(t) (d), ΔR(t)/R, and (e) ΔROSC(t)/R respectively.
Download figure:
Standard image High-resolution imageTo scrutinise the initial change of ΔR(t)/R, in figure 10(a) the ΔR(t)/R values reflecting the change in ρ are plotted as a function of ETHz(t) in the range of td = −1.5–1.5 ps. Clearly, ΔR/R are proportional to ETHz(t) and the change in ρ followed the change of the electric field with no time delay. These results suggest that the change in ρ induced by the electric field occurred via purely electronic processes without any structural change, and is attributable to the intermolecular fractional CTs within each dimeric DA pair.

Figure 10. (a) Interrelation between the evolution of the reflectivity change ΔR(t)/R at 2.2 eV (E⊥a) (Δρ) at 78 K and the electric-field wave from ETHz(t) in the range −1.5 ps to +1.5 ps. (b) Schematic of a polarization–electric field (P − E) curve (the orange line) and the polarization–THz-electric-field (P − ETHz) curve (the blue line).
Download figure:
Standard image High-resolution imageIn the left part of figure 11, the possible CT processes by the THz electric field ((a) → (b) and (a) → (c)) are shown schematically. As seen in figure 9(d), ΔR(t)/R along the time origin is positive, indicating that Δρ and ΔP were positive. This means that the original polarization P is parallel to the THz electric field ETHz(0) at the time origin as shown in figure 11(b). Similar experiments were performed on several samples. In some samples, ΔR(t)/R was negative at the time origin, indicating that Δρ and P were negative. In those samples, P was antiparallel to ETHz(0), as shown in figure 11(c).

Figure 11. Schematic of THz-electric-field-induced changes in degree of CT (ρ) and ferroelectric polarization P in the I phase of TTF-CA. (a) I phase with ferroelectric polarization P. (b), (c) Direct modulation of ρ and P by a THz electric field with ETHz(0) directed to (b) the left and (c) the right. (d), (e) Additional modulation of ρ and P via the changes in the dimeric molecular displacements initially induced by ETHz(0), which are indicated by green straight arrows. The dimeric molecular displacements, ρ and P are increase and decrease in (d) and (e) respectively. (f) Direct excitation of the lattice mode by a THz electric field ETHz(0) directed to the left. (g) Decreased ρ and P by the changes in the dimeric molecular displacements initially induced by ETHz(0).
Download figure:
Standard image High-resolution imageSuch a dependence of ΔR(0)/R on the relative directions of P and ETHz(0) can be ascertained more directly by rotating the direction of ETHz(0). By using two polarizers, the electric-field direction of ETHz(0) was rotated by ±90° as shown in figure 12(a). When the direction of ETHz(0) was reversed, the sign of ΔR/R, that is, the sign of Δρ was reversed. Thus, it was possible to increase or decrease the ferroelectric polarization by choosing the direction of the THz electric field relative to the polarization.
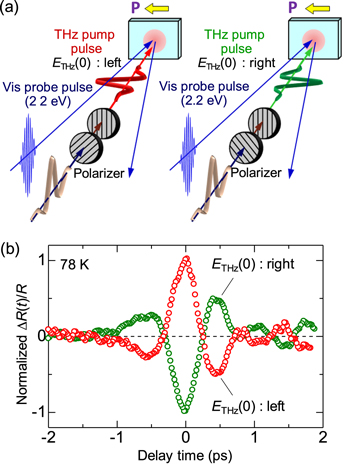
Figure 12. (a) Schematics of the THz pump optical probe experiments with reversed polarization of ETHz(0). The polarization direction of ETHz(0) is rotated by two wire grid polarizers. (b) Time evolution of ΔR(t)/R by a THz electric field with ETHz(0) directed to the left and right at 78 K in the I phase. The ΔR(t)/R signals are normalized with the values of ΔR(0)/R.
Download figure:
Standard image High-resolution image3.2.2. Evaluation of polarization modulation amplitudes
Here, we discuss the evaluation of the magnitude of the polarization change ΔP and the change in the degree of CT ρ, Δρ, induced by the electric field at the time origin. These values can be calculated from the change of the SHG intensity or the reflectivity.
The SHG intensity change ΔISHG(0)/ISHG due to a THz electric field with amplitude ETHz(0) = 36 kV cm−1 was ∼1.5% (figure 7(b)) [35]. Assuming that the second-order nonlinear susceptibility χ(2) is proportional to the magnitude of P, the relation of ΔISHG/ISHG = 2 ΔP/P can be obtained from the relation, ISHG ∝ P2. From the value of ΔISHG(0)/ISHG, ΔP(0)/P was estimated to be ∼0.75% at ETHz(0) = 36 kV cm−1. When ETHz(0) is increased up to 415 kV cm−1 (figure 7(c)), ΔP(0)/P reaches 6.5%. Thus, ultrafast and large polarization modulation was possible in TTF-CA using a strong THz electric-field pulse.
The reflectivity change in the steady state between 77 K and 4 K at 2.2 eV ((R4K − R77K)/R77K = 6.2 × 10⁻²) corresponds to the change of the degree of CT Δρ ∼ 0.05. From this relation and the magnitude of the THz-electric-field-induced reflectivity change, ΔR(0)/R (∼3.1 × 10⁻³), Δρ was calculated to be ∼2.5 × 10⁻³ at ETHz(0) = 38 kV cm−1. The original polarization P was produced by the collective CTs, δρ ∼ 0.2, from A to D molecules, which occurred across Tc. Therefore, the polarization change ΔP(0)/P from the magnitude of Δρ obtained by the THz-pulse pump optical-reflectivity probe measurements could be calculated. In this case, ΔP(0)/P was evaluated to be ∼1.25% at ETHz(0) = 38 kV cm−1. Using the relation ΔP(0)/P ∝ ETHz(0), ΔP(0)/P was calculated to be ∼1.18% at ETHz(0) = 36 kV cm−1, consistent with the value obtained from the SHG measurements (ΔP(0)/P ∼ 0.75%) at the same electric-field amplitude.
It is valuable to compare the observed response to the THz electric field with the polarization−electric field (P − E) characteristic previously reported. The P − E characteristic is schematically shown by the orange line in figure 10(b). The coercive field EC is about 5 kV cm−1 at 50 K [59]. By applying a static electric field larger than EC, the polarization was reversed via movement of the domain wall. The response to the THz electric field was essentially different from that of the static electric field. The ΔR/R − ETHz curve shown in figure 10(a) can be regarded as the Δρ − ETHz curve as the right vertical axis was scaled by Δρ. Considering that the magnitude of the CT, δρ ∼ 0.2, across the NI transition determined the magnitude of the original polarization P, P + ΔP was proportional to (δρ + Δρ). Alternatively, the (δρ + Δρ) − ETHz curve corresponds to the P − ETHz curve. This P − ETHz curve is schematically shown by the blue line in figure 10(b). Since the motion of a ferroelectric domain wall is slow and its time scale is in the millisecond range [59], it did not move during a sub-picosecond change in the electric field within a THz pulse. This means that we can apply a large electric field only to the electronic system without inducing any motions of ferroelectric domain walls. Thus, we can conclude that a large and ultrafast polarization modulation is caused by electronic-state changes. Such a feature has also been theoretically demonstrated by H Gomi and collaborators [76].
3.2.3. Coherent oscillation generated by electric-field-induced polarization modulation
In the time evolution of the reflectivity change ΔR(t)/R due to a THz electric field for td > 5 ps, a coherent oscillation was observed. As seen in figure 9(d), ΔR(t)/R in this time domain could not be reproduced by ETHz(t) alone. By subtracting the normalized THz waveform ETHz(t) from ΔR(t)/R, the oscillatory component ΔROSC(t)/R was extracted, and is shown by green circles in figure 9(e). A clear oscillation with a period of about 0.6 ps is shown. By means of wavelet analysis, the time dependence of the Fourier power spectra of the THz waveform ETHz(t), the reflectivity change ΔR(t)/R, and the oscillatory component ΔROSC(t)/R were obtained, and are shown as the contour maps in figure 9(f), (g), and (h) respectively. ETHz(t) ranged from 5–60 cm−1 and was localised around the time origin. On the other hand, ΔROSC(t)/R had a monochromatic component at 54 cm−1, which was observed even at td > 10 ps. The same component was also clearly observed in ΔR(t)/R. The oscillation mode with the same frequency was activated in the steady-state polarized Raman spectrum only in the I phase and assigned to the mode corresponding to the dimerization—that is, the stretching mode of DA dimers [35]. The coherent oscillation with the same frequency was also observed in the photoinduced N-to-I transition and is interpreted as the transient oscillation associated with dimerization of the photoinduced I states [69–71, 73, 75]. Therefore, it is reasonable to ascribe the coherent oscillation observed in figures 9(d), (e), (g) and (h) to the dimeric lattice mode or equivalently the optical mode. Since the reflectivity of the IM transition band of TTF molecules was used as a probe in this pump−probe experiment, the result indicates that coherent oscillation strongly modulated the degree of CT, ρ.
Taking into account the experimental results mentioned above, we discuss the origin of the coherent oscillation generated by the THz electric field. A possible mechanism is the direct excitation of the dimeric lattice mode by the THz electric field, since the THz pulse had a finite intensity at 54 cm−1 (∼1.6 THz) as shown in figure 9(c). However, this possibility must be excluded, because the directions of the observed electric-field-induced displacements of the D and A molecules were opposite to those expected for displacement-type ferroelectricity. Figure 11 explains this in more detail. When the polarization P was directed left (figure 11(a)) and the THz electric field ETHz(0) was parallel to P, the direct excitation of the IR active lattice mode consists of the displacements of D (A) molecules in the left (right) direction as shown by the green arrows in figure 11(f). These molecular displacements led to an increase of the molecular distance between D and A molecules in each dimer. This decreased the Coulomb attractive interaction in each dimer, resulting in decreased ρ. Here, the first cycle of the oscillatory change in ρ in figure 9(e) was in good agreement with the initial rapid change in ρ (figure 9(d)) directly driven by the THz electric field. This result clearly shows that when ETHz(0) was parallel to P (figure 11(b)), the D (A) molecules moved antiparallel (parallel) to the original polarization P, as shown in figure 11(d). These results demonstrate that the dimeric lattice mode was not directly excited by the THz electric field.
The most plausible mechanism for the generation of the coherent oscillation is the modulation of the spin-Peierls dimerization via the rapid modulation of ρ. When the direction of ETHz(0) was parallel to P (figure 11(b)), ρ increased first to ρ + Δρ(t) via electronic processes, such that P increased as mentioned above. The increased ρ induced an increase of the spin moment in each molecule. Then, the spin-Peierls mechanism was more effective, and molecular dimerization was strengthened as shown in figure 11(d). The resultant increase of the molecular displacements further increased the degree of CT from ρ + Δρ to ρ + Δρ + Δρ' by the increase in the Coulomb attractive interaction within each dimer. Thus, the THz electric field gave rise to a forced molecular oscillation of the spin-Peierls mode via the change in ρ. Then, an additional oscillation in the degree of CT with amplitude Δρ' and in the polarization with amplitude ΔP' occurred, synchronised with the molecular oscillation, denoted as (d) ↔ (e) in figure 11. When the direction of ETHz(0) was antiparallel to the original polarization P as the case of figure 11(c), ρ first decreased and then oscillated coherently as denoted by (e) ↔ (d) in the same figure, triggered by the decrease in the dimeric molecular displacements (figure 11(e)).
In this mechanism, the time evolution of the oscillatory component ΔROSC(t)/R can be expressed by the following formula:
Here, τ0 and Ω are the decay time and the frequency of the oscillation, respectively. In this formula, we calculate the convolution integral of a damped sinusoidal oscillator with ETHz(t). This formula may be regarded as the forced oscillation of the optical mode driven directly by the THz electric field. However, we can show that the oscillation driven by the electric-field-induced modulation of ρ can also be expressed by the same formula [35]. By using this formula, we can precisely simulate the response to the electric field across the whole time region including the time domain around t = 0 ps. Using equation (2), the time evolution of ΔROSC(t)/R was almost reproduced with τ0 ∼ 8.7 ps and Ω ∼ 54 cm−1, as shown by the solid line in figure 9(e). Around t = 0 ps, a finite discrepancy exists between ΔROSC(t)/R and the fitting curve. This is probably caused by the errors in ΔROSC(t)/R around t = 0 ps. At t = 0 ps, the amplitude of the direct charge-modulation component is larger by about one order than that of the oscillatory component. As mentioned above, the oscillatory component ΔROSC(t)/R is extracted by subtracting the normalized THz waveform ETHz(t) reflecting the direct charge-modulation component from ΔR(t)/R, so that some errors are likely to appear in ΔROSC(t)/R around t = 0 ps.
Since the overall fitting is satisfactory, we can conclude that the coherent oscillation of the degree of CT ρ originates from the modulation of the spin-Peierls dimerizations due to the rapid change in ρ induced by the THz electric field.
3.3. Polarization generation by a THz pulse in the para-electric neutral phase of TTF-CA
A large change in the macroscopic polarization of a solid can cause large changes in the refractive index and absorption coefficient. If a large macroscopic polarization is generated in a para-electric material in an impulsive manner, an ultrafast optical switching will be achieved via instantaneous changes in refractive index or absorption coefficient. Accomplishing such ultrafast optical switching without real carrier excitations has been one of the most important subjects in modern optical technology development. In the N phase of TTF-CA, no spontaneous polarization exists. TTF-CA includes a valence instability associated with the NI transition in the N phase, and a dielectric constant is enhanced with temperature approaching Tc. Therefore, a large electronic response to the strong electric field occurs. In this sub-section, we review this recent study, which aimed at the ultrafast generation of large polarization by a THz electric field in the N phase of TTF-CA [37].
3.3.1. Rapid generation of ferroelectric polarization in the N phase of TTF-CA
In order to detect polarization generated by a THz pulse, the use of the THz-pulse pump SHG probe method is very effective. Since TTF-CA has no spontaneous polarization in the N phase, no SHG can be observed as schematically illustrated in the upper panel of figure 13(a). To evaluate the intensity of electric-field-induced SHG signals in the N phase, the following experimental procedure was performed. First, the intensity of the SHG signal was measured in the I phase at 65 K with no THz pulse irradiation. The photon energy of the incident probe pulse (the emitted SH pulse) is 1.3 eV (2.6 eV). The incident and emitted pulses are both polarized parallel to the a-axis. Those experimental conditions were the same as those used in the experiments described in the previous sub-section. Next, the temperature of the sample was increased up to 90 K in the N phase. The THz-pulse pump SHG probe measurement was then performed with the same intensity of the incident probe pulse (the lower panel of figure 13(a)). In this experimental procedure, the intensity of the THz-electric-field-induced SHG in the N phase was compared to that of the steady-state SHG signal in the I phase.

Figure 13. (a) Schematics of THz pump SHG probe measurements in the para-electric N phase. (b) Electric-field waveform of a THz pulse (ETHz(t)). (c) Time evolution of SH intensity ΔISHG(t) at 90 K by a THz electric field ETHz(t) shown in (b). (d) Time evolution of the reflectivity change at 1.3 eV and at 90 K. Shaded area in (c) and (d) shows the waveform of the square of a THz electric field, (ETHz(t))2. (e) Temperature dependence of the reflectivity change at td = 0, ΔR(0)/R.
Download figure:
Standard image High-resolution imageFigure 13(c) shows the THz-pulse pump SHG probe measurements taken at 90 K. When the maximum amplitude of the THz pulse was less than 40 kV cm−1, no electric-field-induced SHG signals were detected in the N phase [35]. As the electric field amplitude increased to 400 kV cm−1 (figure 13(b)), the SHG signal was clearly observed as shown in figure 13(c). This indicates that a macroscopic polarization can be generated in the sub-picosecond time scale by a THz pulse. The intensity of the SH light at td = 0 ps, ΔISHG−90K(0), was 2.9% of the intensity of the steady-state SH light at 65 K in the I phase, ISHG−65K. If it is assumed that the intensity of the SH light was proportional to the square of the polarization amplitude, the magnitude of the polarization induced by the THz pulse was ∼17% of the original polarization in the I phase (6.3 μC/cm2), since ΔISHG−90K(0)/ISHG−65K ∼ (ΔPSHG−90K(0)/PSHG−65K)2 ∼ 2.9%.
Next, we discuss the time evolution of the electric-field-induced SHG signal, ΔISHG−90K(t) shown in figure 13(c). The initial SHG signal from td = −0.3–0.3 ps is very similar to the square of the THz-electric-field waveform, (ETHz(t))2, shown by the shaded area in the same figure. The observed relation of ΔISHG−90K(t)/ISHG−65K ∝ (ETHz(t))2 is reasonable, since TTF-CA has inversion symmetry in the N phase. The SHG signal follows (ETHz(t))2 without delay, suggesting that CT processes between DA molecules would cause polarization generation similar to the polarization modulation by a THz pulse in the I phase. On the other hand, the time evolution of the SHG signal, ΔISHG−90K(t)/ISHG−65K, for td > 0.3 ps was considerably different from (ETHz(t))2; an oscillatory structure is evident. Such a difference contrasts with the I phase, in which the change of SHG intensity, ΔISHG(t)/ISHG, by a THz pulse was proportional to the THz electric field waveform except for a small contribution of the coherent oscillation associated with the lattice mode.
To interpret the response in the N phase, we performed THz-pulse pump optical-reflectivity probe spectroscopy focusing on the CT band in the near-IR region. The spectral shape of the CT band was sensitive to ρ, similarly to the IM transition band of TTF; the reflectivity from 0.6 eV to 1.35 eV increased with increasing ρ [77]. The time evolution of the reflectivity change ΔR(t)/R at 1.3 eV is shown in figure 13(d) as a typical example. Using the same probe photon energy (1.3 eV) is appropriate in comparing the time evolution of ΔR(t)/R and ΔISHG(t). The positive ΔR(t)/R signal indicates the increased ρ by the THz pulse. The shaded area in figure 13(d) also shows the square of the THz electric field, (ETHz(t))2. The observed ΔR(t)/R near the time origin closely follows (ETHz(t))2, as well as ΔISHG(t). This indicates that the electric-field-induced change in ρ occurred without delay and that the fractional CTs Δρ(t) from A to D molecules were responsible for the polarization generation ΔP(t). Such polarization generation by the THz electric field is similar to that of the spontaneous polarization generation across the NI transition. Figure 13(e) shows the temperature dependence of ΔR(0)/R reflecting the magnitude of the electric-field-induced increase of ρ and P. ΔR(0)/R increases with decrease of temperature down to Tc, showing a critical behaviour. For td > 0.3 ps, the time evolution of ΔR(t)/R deviates from the waveform of (ETHz(t))2 and an oscillatory structure appeared, similarly to ΔISHG(t).
The analyses of the time evolution of ΔISHG(t) and ΔR(t)/R including the oscillatory components and their interpretations are complicated, thus we report here only the conclusion. Polarization generation by the THz pulse in the N phase can be ascribed to the coherent dynamics of tiny one-dimensional I domains fluctuating in the host N state, schematically shown in figures 14(a) and (b). Previous optical, dielectric, x-ray diffuse scattering, and transport measurements suggested that such I domains are generated even in the N phase because of the valence instability or the instability to the NI transition, and fluctuate in time and space [78–82]. To accurately estimate the amount of microscopic I domains, detailed IR molecular vibrational spectroscopy was performed (not shown). This revealed that ∼20% of molecules were ionised and existed as microscopic I domains at 90 K, just above Tc. Previous optical pump optical-reflectivity probe spectroscopy suggested that each I domain consisted of approximately ten DA pairs or 20 molecules at 90 K [71]. Such formation of microscopic I domains originated from the collective nature of I states due to long-range Coulomb attractive interaction.

Figure 14. (a)–(c) 1D microscopic I domains fluctuating in the N phase. An I+ domain has a dipole moment +μ, and an I− domain has a dipole moment −μ. (d) THz-electric-field-induced changes of 1D I domains. A THz electric field with the right-hand direction increases (decreases) the size of an I+ (I−) domain via intermolecular CTs at domain boundaries (red curved arrows) and changes ρ by Δρ (−Δρ) within the I domain (yellow curved arrows). (e) A large macroscopic polarization produced by microscopic changes of 1D I domains.
Download figure:
Standard image High-resolution imageTo explain the observed response to a THz electric field, consider two kinds of 1D microscopic I domains, I+ and I−, with opposite dipole moments, +μ and −μ respectively, shown in figure 14(b). The moment μ is large, since an I domain consists of approximately 10 DA pairs as mentioned above. In the absence of electric field, +μ and −μ cancel with each other and no polarization exists. When a THz pulse polarized along the a-axis is introduced to TTF-CA, not only does a fractional CT occur in each DA pair, increasing (decreasing) ρ by Δρ within the I+ (I−) domain, but also the I+ domain, polarized parallel to ETHz(0), expands and the I− domain, polarized antiparallel to ETHz(0), shrinks as shown in figures 14(c) and (d), the total values of ρ and μ increase. Such expansion and shrinkage of an I domain occur via the motion of domain walls between microscopic N and I domains, called neutral-ionic domain walls (NIDWs) [83]. Thus, microscopic changes in μ in a number of I domains generate a large macroscopic polarization as illustrated in figure 14(e). This interpretation is consistent with the increase of ΔR(0)/R with decrease of temperature down to Tc shown in figure 13(e). Approaching Tc, the valence instability is enhanced and the electric-field-induced response is increased. The oscillatory response observed in ΔISHG(t) for td > 0.5 ps can be attributed to the subsequent breathing oscillation of NIDW pairs. The analyses revealed that the characteristic frequency of the breathing oscillation is changed from 32 cm−1 at 170 K to 19 cm−1 at 82 K. Such a softening can be explained by the fact that the energy difference between the N and I states decreases as the temperature approaches Tc. The details of the data and their analyses were reported in [37].
3.4. Polarization modulation by a THz pulse in the ferroelectric CO phase of α-(ET)2I3
α-(ET)2I3 is an organic molecular compound, in which ET molecules (figure 15(a)) and I3− ions form layer structures. The crystal structure is shown in figure 15(b). ET molecules form two-dimensional conducting layer which is shown in figure 15(c). This compound is metallic at room temperature [84, 85] because the valence of each ET molecule, ρ, is +0.5 and the band consisting of ET molecules is quarter-filled. In the structure at room temperature shown in figure 15(c), the three molecules denoted by A, B, and C are crystallographically different, while molecules A and A', forming a dimer, are crystallographically equivalent.
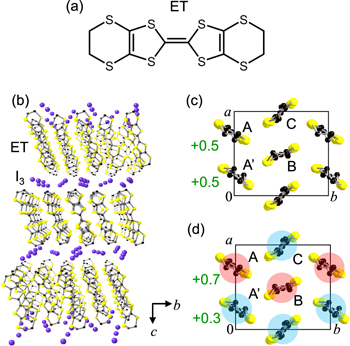
Figure 15. (a) Molecular structure of ET. (b) Three-dimensional crystal structure of α-(ET)2I3. (c), (d) Molecular arrangement of a two-dimensional ET layer (c) in the metal phase at T > Tc and (d) in the CO phase at T < Tc. The red and blue circles in (d) show the charge-rich (ρ ∼ +0.7) and charge-poor (ρ ∼ +0.3) molecules, respectively.
Download figure:
Standard image High-resolution imageBy lowering temperature, this compound shows a phase transition from a metal to a CO insulator at Tc = 135 K [54, 86–89]. In the CO phase below Tc, electrons are localised on ET molecules due to the inter-site Coulomb repulsive interactions [90]; as shown in figure 15(d), charge-rich ET molecules denoted by A and B with ρ ∼ +0.7 and charge-poor molecules denoted by A' and C with ρ ∼ +0.3 form the horizontal stripe pattern. In the CO phase, the crystal symmetry is P1, so that the inversion symmetry of the crystal is broken [54]. In the CO phase, molecules A and A' have different ρ values, ∼+0.7 and ∼+0.3, so that a finite polarization is expected to emerge along the a-axis [55]. In fact, the SHG was observed in the CO phase [55, 91]. From the activation of SHG, it was suggested that the CO phase was accompanied by a ferroelectric polarization and that the polarization originates from the intermolecular CTs between molecules A and A', when the metal to CO transition occurs. This means that α-(ET)2I3 is an electronic-type ferroelectric. In α-(ET)2I3, however, the ferroelectric property had not been investigated in detail. The main reason was that it is difficult to measure a P − E characteristic in α-(ET)2I3, which gives direct evidence of ferroelectricity with the appearance of a hysteresis loop [92]. This is because the resistivity of this compound is low along the ET conducting layer even at low temperatures [93–95]. As a result, the direction of the ferroelectric polarization had not been determined. Note that the crystal symmetry P1 of α-(ET)2I3 is low, so that the polarization direction cannot be determined from the polarization dependence of the SHG signals.
From these backgrounds, the THz-pulse pump SHG probe and optical-reflectivity probe measurements were performed on α-(ET)2I3 in the CO phase [36]. If the ferroelectric polarization is dominated by intermolecular CTs as mentioned above, ultrafast responses to a THz electric field will be observed. In addition, by detecting the dependence of the optical responses to the THz electric-field direction, the polarization direction may also be determined. A THz electric-field pulse is advantageous for the studies of dielectric properties in such low-resistivity materials, since the electric field is applied only within ∼1 ps by a THz pulse, so that any current flow due to the electric field is negligibly small.
3.4.1. Rapid modulation of ferroelectric polarization in the CO phase of α-(ET)2I3
We first review the results of the THz-pulse pump SHG probe measurement to investigate the change of ferroelectric polarization P due to the THz electric field (ETHz(t)). As discussed in section 3.2, in general, the second-order nonlinear susceptibility χ(2) determining the SHG process is proportional to the amplitude of the polarization P and, therefore, the intensity of SH light, ISHG, is proportional to the square of P (ISHG ∝ P2). From this relation, the electric-field-induced change of P, ΔP, can be derived from the change in ISHG by the THz pulse.
Figure 16(a) shows the schematics of the THz-pulse pump SHG probe measurements; all the measurements were performed on the ab plane of α-(ET)2I3 and at 10 K in the CO phase. In the CO phase, two structures are possible, which are characterised as the right-handed structure or the left-handed structure as shown in the lower part of figure 16(a) [54]. Those structures in the CO phase cannot be discriminated without detailed structural analyses at low temperatures. The electric field (E) of incident (0.89 eV) and SH (1.78 eV) pulses are parallel to the a- and b-axis, respectively. In this combination of light polarizations, the intensity of SHG, ISHG, is the highest [55].
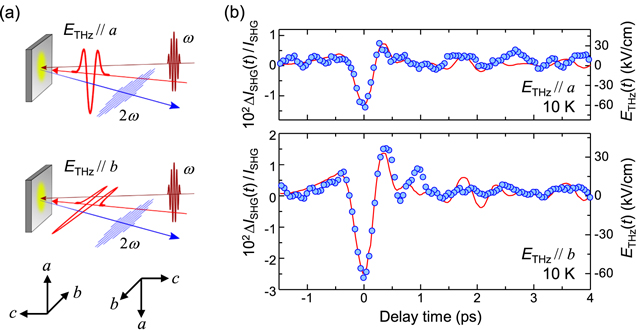
Figure 16. (a) Schematics of THz pump SHG probe measurement. Upper and lower figures show ETHz//a and ETHz//b respectively. Two possible directions of the crystal with right-handed and left-handed structures in the CO phase are shown in the lower part. Electric fields of incident (ω) and SH (2ω) lights are parallel to the a- and b-axis, respectively. (b) Time evolution of changes (ΔISHG(t)/ISHG) in the SH intensities ISHG for ETHz//a (upper panel) and ETHz//b (lower panel) at 10 K. Red lines show the electric-field waveform ETHz(t) of the THz pump pulse with ETHz(0) = 60 kV cm−1.
Download figure:
Standard image High-resolution imageFigure 16(b) shows the time evolutions of the changes of the SH intensity, ΔISHG(t)/ISHG. The upper and lower panels of figure 16(b) show the results for ETHz//a and ETHz//b respectively. The maximum electric field of the THz pulse, ETHz(0), is 60 kV cm−1. The time characteristics of ΔISHG(t)/ISHG are almost in agreement with the electric-field waveform of the THz pulse shown in the red lines in figure 16(b). In the initial change of SH light, no delay is observed. Thus, we can consider that the ferroelectric polarization completely follows the THz electric field and this feature originates from the electronic-type ferroelectricity of this compound. The electric-field-induced change ΔP of the polarization P can be evaluated from the value of ΔISHG/ISHG via ΔISHG/ISHG ∼ 2ΔP/P as mentioned in section 3.2. When the THz electric field is parallel to the b-axis, ΔISHG(0)/ISHG is estimated to be 2.6% at ETHz(0) = 60 kV cm−1. This gives ΔP(0)/P = 1.3%. This magnitude of the polarization modulation corresponds to ∼8.5% at ETHz(0) = 415 kV cm−1, which is comparable to ∼6.5% at the same electric-field amplitude in TTF-CA.
3.4.2. Electronic origin of rapid polarization modulation
To investigate the dynamical aspect of the polarization modulation by a THz electric field in more detail, THz-pulse pump optical-reflectivity probe measurements were performed. Figure 17(a) shows the polarized reflectivity spectra of α-(ET)2I3 [36]. The electric field of the light (E) is parallel to the b-axis (E//b). The red line and the black line represent the spectra in the metallic phase (136 K) and the CO phase (5 K) respectively. A broad band below 0.6 eV observed in the CO phase is assigned to the charge-transfer transition of localised electrons between ET molecules [96]. The green line in figure 17(b) is the differential reflectivity spectrum (R136K − R5K)/R5K, which shows the spectral change when the CO is melted or weakened. Thus, the reflectivity in the near-IR to mid-IR region is sensitive to the molecular valence, so that it reflects the amplitude of the CO.

Figure 17. (a) Reflectivity spectra at 136 K in the metal phase and at 5 K in the CO phase for E//b. (b) Spectrum of reflectivity changes ΔR(0)/R induced by the THz electric-field pulse with ETHz//b (yellow circles) at 10 K. The solid green line is the differential reflectivity spectrum (R136K − R5K)/R5K.
Download figure:
Standard image High-resolution imageFigures 18(a) and (d) show the schematics of the THz-pulse pump optical-reflectivity probe measurements and the electric field waveform of a THz pump pulse, respectively. The time evolutions of ΔR(t)/R at 0.65 eV for ETHz//a and ETHz//b are shown by yellow circles in figures 18(b), (e) and (c), (f) respectively. The time evolutions of ΔR(t)/R at around the time origin −0.5 ps < td < 0.5 ps are in good agreement with the THz electric-field waveform (the red lines) in figures 18(b), (c). Subsequently, the prominent oscillatory components appears at td > 0.5 ps (figures 18(e), (f)), although no THz electric field exists in this time domain.
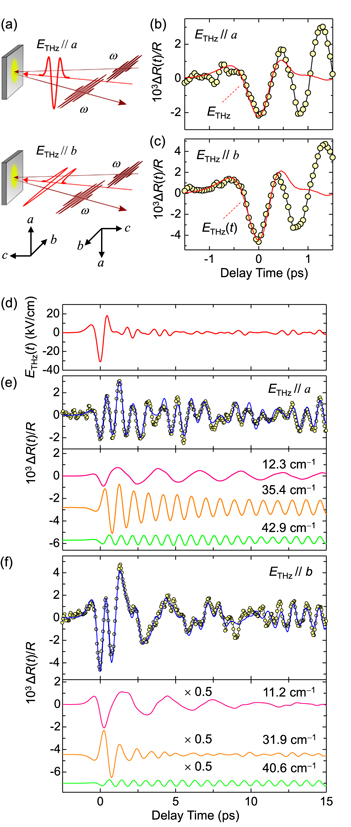
Figure 18. (a) Schematics of THz pump optical-reflectivity probe measurement. Two possible directions of the crystal with right-handed and left-handed structures in the CO phase are shown in the lower part. (b), (c) Time evolution of THz-electric-field-induced reflectivity changes ΔR(t)/R at 0.65 eV for (b) ETHz//a and (c) ETHz//b up to 1.5 ps. (d) Electric-field waveform of a THz pulse (ETHz(t)). (e), (f) Time evolutions of ΔR(t)/R for (e) ETHz//a and (f) ETHz//b. Solid blue lines show fitting results (see text). The lower panels show the oscillatory components included in the fitting curves.
Download figure:
Standard image High-resolution imageFirst, we discuss the initial response at −0.5 ps < td < 0.5 ps. The yellow circles in figure 17(b) show the probe energy dependence of ΔR(0)/R for ETHz//b. This spectral shape is in good agreement with the differential reflectivity spectrum, (R136K − R5K)/R5K shown by the green line in the same figure. This suggests that the CO is weakened by the THz electric field at td = 0 ps. As mentioned above, the initial ΔR(t)/R signals at −0.5 ps < td < 0.5 ps completely follow the electric-field change (figures 18(b), (c)). This indicates that the molecular valence is rapidly modulated by the THz electric field via the intermolecular CTs and that the modulation of SHG or the polarization P shown in figure 16(b) occurs also via the same intermolecular CTs. These results also suggest that the ferroelectricity in α-(ET)2I3 is electronic in nature.
The modulation amplitude of the CO by the THz electric field can be evaluated by comparing ΔR(0)/R with the differential reflectivity (R136K − R5K)/R5K. The difference in the charge, δρ, between charge-rich molecule A and charge-poor molecule A' is ∼0.4 in the CO phase at 20 K [54]. (R136K − R5K)/R5K at 0.65 eV is almost equal to 53%. When the THz electric field with 31 kV cm−1 is applied parallel to the b-axis, ΔR(0)/R at 0.65 eV is 0.46%. Therefore, the THz electric-field-induced change of the CO, Δρ/δρ, for ETHz(0) = 31 kV cm−1 is calculated to be 0.46/53, that is, 0.87%. For ETHz(0) = 60 kV cm−1, Δρ/δρ is estimated to be 1.68%, which is comparable to the change of the polarization ΔP(0)/P = 1.3% at 60 kV cm−1 evaluated from the results of the SHG probe measurements.
3.4.3. Determination of the ferroelectric polarization direction
As seen in figures 18(b), (c), the magnitude of the reflectivity change ΔR/R at td = 0 ps and at 0.65 eV for ETHz//b is twice as large as that for ETHz//a. This result seems to contradict with the simple prediction that the ferroelectric polarization is parallel to the a-axis mentioned above and suggests the possibility that the direction of ferroelectric polarization is diagonal in the two-dimensional ET layers on the ab plane.
To determine the direction of the ferroelectric polarization P, the dependence of the ΔR/R signals on the direction of the THz electric field was investigated. Figures 19(a) and (b) show the schematics of two possible CO patterns at low temperature [54]. They cannot be discriminated without detailed structural analyses on that crystal itself. Therefore, we must consider two possibilities. In figure 19(c), ΔR(0)/R at 0.65 eV is plotted as a function of the angle θ of the THz electric field measured from the b-axis. The experimental results are reproduced well by −cos(θ − 27°), shown by the red line. As shown in the inset of figure 19(c), ΔR(0)/R shows its minimum at θ = +27°. These results indicate that the polarization directs to the angle of +27° or −153° from b (−b)-axis. Since the amplitude of the polarization is decreased at θ = +27°, the polarization directs along −153° from b (−b)-axis.

Figure 19. (a), (b) Two possible configurations of the CO patterns with (a) right-handed and (b) left-handed crystal structures. The white arrow in (b) shows the direction of the polarization P determined from the electric-field direction dependence of the reflectivity changes ΔR(0)/R at 0.65 eV. The green and orange arrows show candidates of molecular displacements responsible for the oscillations with frequencies of ∼40 and ∼35 cm−1 respectively. (c) Reflectivity changes ΔR(0)/R at 0.65 eV as a function of the angle θ of THz electric field measured from the b(−b)-axis. The experimental result is reproduced well by the red solid line of −cos(θ − 27°). The inset shows the direction of the THz electric field corresponding to the minimum of ΔR(0)/R.
Download figure:
Standard image High-resolution imageAs mentioned above, the observed polarization modulation is attributable to the intermolecular CTs by the THz electric field. Therefore, it is natural to consider that the ferroelectric polarization itself would also be caused by collective CTs when the metal to CO transition occurs. This is similar to the formation of the ferroelectric polarization in the ionic phase of TTF-CA.
We next discuss the reason for the formation of the diagonal polarization. It is reasonable to consider that a fractional CT between two neighbouring molecules strongly interacting with each other is responsible for the ferroelectric polarization. In figure 19(a), the magnitude of the intermolecular transfer energy t is shown in the unit of eV [54]. t is relatively large along the diagonal directions, as shown by the solid green lines connecting A'−B−A and A'−C−A, which are inclined +157° and +27° from the b-axis, respectively. The direction of the polarization is considered to be −153° from the b (−b)-axis, so that the fractional CTs between A'−B and B−A are responsible for the polarization. Since the polarization is decreased at θ = +27° (figure 19(c)), we can conclude that the experimental condition is shown in figure 19(b) and the polarization is inclined −153° from the b (−b)-axis as shown by the white arrow in figure 19(b).
3.4.4. Charge-lattice coupled dynamics after initial polarization modulation
Here, we discuss the oscillatory components observed in the time evolutions of ΔR(t)/R at td > 0.5 ps in figures 18(e) and (f). They are considered to be the lattice modes driven by the THz electric field [35, 96]. To analyse the time evolutions of those oscillatory components, we adopted the following formula:
Here, τi, ωi and ϕi are the decay time, frequency and initial phase, respectively, of the oscillation denoted by i. The first term represents the instantaneous response proportional to the THz electric field ETHz(t) and the second term is a convolution of ETHz(t) and n damped oscillators. By assuming three damped oscillators (n = 3), the experimental results are well-reproduced as shown by the blue lines in figures 18(e) and (f). Each oscillatory component is shown in the lower parts of those figures. The frequencies ωi of three oscillators are evaluated to be 12, 35, 43 cm−1 for ETHz//a and 11, 32, 40 cm−1 for ETHz//b. The errors in ωi are very small (≤1%), while finite discrepancies between the experimental and calculated time evolutions of ΔR(t)/R exist. For those discrepancies, we suppose two reasons. First, a simple exponential decay might not be sufficient to reproduce the results. The decay of the oscillation would be caused by complicated processes including both the decay of amplitude itself and the disturbance of oscillation phase, so that a single exponential decay model might be too simple to reproduce the results. Second, besides the three oscillations included in the analyses, other weak oscillation modes might be generated. In this case, their oscillatory signals are superimposed on the reflectivity changes, which might cause the discrepancy.
In the polarized absorption spectra in the range 15–75 cm−1, the corresponding peaks of ∼35 and ∼40 cm−1 are observed, indicating that these oscillations are infrared-active molecular oscillations [36, 97]. Below 15 cm−1, no absorption spectra are reported. The observed oscillations are considered to be caused by the initial CTs induced by the THz electric field, or directly driven by the THz electric field. The amplitudes of oscillatory components were as large as that of instantaneous response to the THz electric field. This suggests that in α-(ET)2I3, the electron-lattice interaction was significant and the CO phase was stabilised by the molecular displacements as well as by the repulsive intermolecular Coulomb interactions. In figure 19(b), the candidates of molecular displacements responsible for the oscillations observed in the time evolutions of ΔR(t)/R are indicated by green and orange arrows. Note that such large oscillations were not observed in the SHG probe measurements. This demonstrates that the ferroelectric polarization originates from the intermolecular CTs and the modulation of the polarization by the THz electric field were purely electronic in nature. Further, the molecular displacements and their oscillations driven by the THz electric field did not play dominant roles in polarization formation and modulation but dominated only the stabilisation of the CO and its modulation triggered by the THz-electric-field-induced CTs.
3.5. Polarization modulation in other ferroelectrics
After ferroelectric polarization control via a THz pulse was reported in TTF-CA, several studies of THz-electric-field-induced polarization modulation were reported in conventional displacive-type ferroelectrics [98–102]. For example, F. Chen and collaborators reported that the SHG intensity in a thin film sample of multiferroic BiFeO3 was directly modulated by about 8% by a THz electric field with the peak amplitude of ∼400 kV cm−1 [98]. They also succeeded in achieving a larger change of SHG intensity in an 11% Sm-doped BiFeO3, which is a ferroelectric material located near the morphotropic phase boundary between the rhombohedral ferroelectric phase and the orthorhombic para-electric phase. In this compound, the steady-state SHG intensity is only one tenth of that in the undoped BiFeO3, since the atomic displacements are suppressed and the crystal structure approaches that in the para-electric phase. On the other hand, the SHG intensity under a THz electric field with the peak amplitude of ∼400 kV cm−1 becomes larger than that in the undoped BiFeO3 under the same THz electric field. Such an enhancement of the SHG intensity was attributed to the higher-order nonlinear effect characteristic of materials located near the ferroelectric−para-electric phase boundary. A similar quadratic response of SHG intensity to external electric field was also observed in a perovskite-type cobalt oxide BiCoO3 [102].
Using an x-ray pulse as a probe light, it is possible to detect atomic displacements and structural changes induced by a THz electric field. From the THz-pulse pump x-ray probe measurement on a BaTiO3 thin film, F. Chen and collaborators demonstrated that large displacements of titanium atoms were induced by a THz pulse polarized perpendicular to the ferroelectric polarization, resulting in a transient rotation of the ferroelectric polarization [99]. M. Kozina and collaborators observed THz-electric-field-induced coherent oscillations in a SrTiO3 thin film using an ultrashort x-ray probe pulse [101]. Time evolutions of the change in the x-ray scattering intensity include two coherent oscillations. By measuring the temperature dependence of those coherent oscillations, they directly observed the softening of the lower frequency mode with decreasing temperature.
The perovskite oxides mentioned above are displacive-type ferroelectrics. The speed of the polarization modulation would depend on the frequency of the specific phonon modes. Specifically, the upper limit of the polarization-modulation frequency is determined by the frequency of the phonon mode. In electronic-type ferroelectrics, it is expected that the polarization can be modulated in the time scale corresponding to the transfer energy t. If t is 0.1 eV, a possible polarization-modulation frequency reaches 25 THz. Such a feature might be utilised in future optical communication.
4. Insulator to metal transition by a THz electric field
4.1. Concept of THz-electric-field-induced insulator to metal transition
As mentioned in section 1, correlated electron materials are good candidates for the rapid control of electronic structure using a strong THz electric-field pulse. In this section, we review the studies aiming to drive a Mott insulator to metal transition with a THz electric-field pulse.
A Mott insulator to metal transition or equivalently a Mott transition is a typical phase transition in correlated electron materials [103]. Here, we consider a simple system with one orbital per site and N electrons are introduced to N sites. The band consisting of the orbitals on each site is half-filled, so that the system is metallic from the simple band theory. In the case that an on-site Coulomb repulsion energy is large, overcoming the electron itinerancy, electrons are localised on each site. As a result, the system becomes a Mott insulator. Such a Mott-insulator state is schematically shown in figure 20(a). By a carrier doping via element substitutions as well as by application of pressure, a Mott insulator state can be converted to a metal, as shown in figure 20(b). This is called a filling-control Mott transition. The layered cuprates such as La2−xSrxCuO4 and Nd2−xCexCuO4 are known as typical examples [104–108].
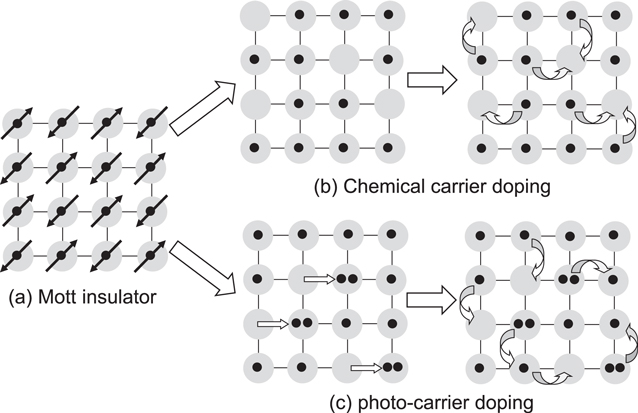
Figure 20. Schematic of Mott insulator to metal transition (Mott transition) by carrier doping. (a) Half-filled Mott insulator. (b) Mott transition by chemical carrier doping. (c) Mott transition by photocarrier doping.
Download figure:
Standard image High-resolution imageA photoexcitation is another effective method to create carriers in materials. When the Mott insulator is irradiated with a femtosecond laser pulse having photon energy larger than the Mott gap, doublons and holons are generated as shown in figure 20(c). Such a photocarrier doping makes localised electrons mobile, giving rise to a transition to a metal. This phenomenon is called a photoinduced Mott insulator to metal transition (or simply a photoinduced Mott transition) and is indeed observed in one-dimensional Mott insulators of a bromine-bridged nickel compound, [Ni(chxn)2Br]Br2 (chxn: cyclohexanediamine) [109] and an organic molecular compound, ET-F2TCNQ (F2TCNQ: difluorotetracyanoquinodimethane) [110], and two-dimensional Mott insulators of undoped cuprates, La2CuO4 and Nd2CuO4 [111, 112].
Theoretical studies have predicted that an application of a strong electric field to a Mott insulator can drive a Mott transition [113–124]. This phenomenon can be explained using a band description schematically shown in figure 21. The strong electric field applied to a Mott insulator inclines both the upper Hubbard band and the lower Hubbard band. When the amplitude of the applied electric field exceeds the Schwinger limit, doublon−holon pairs are generated through the quantum tunnelling processes between two bands, as shown by a thin solid arrow in figure 21. We can simply consider that this is a Zener tunnelling in a Mott insulator [115]. The theoretical study also suggested that in the quantum tunnelling process in Mott insulators, the electric-field dependence of the carrier number N is expressed by the following formula [122]:

where Eex is an external electric field and Eth is the threshold electric field. If the amount of generated carriers is enough to melt the electron localisation, the Mott gap collapses and a Mott transition may occur.
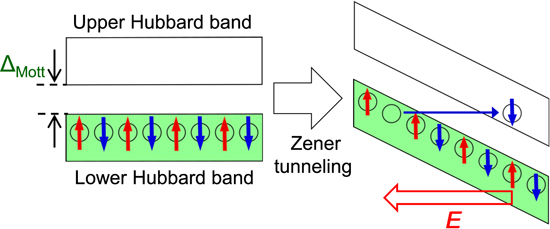
Figure 21. Quantum tunnelling process by an application of strong electric field. The left figure shows the band structure of a half-filled Mott insulator. ΔMott represents the magnitude of Mott gap. The right figure shows the carrier generations via a Zener tunnelling process. The upper and lower Hubbard bands are inclined by the electric field E and a doublon−holon pair is generated.
Download figure:
Standard image High-resolution imageThe insulator to metal transition by a THz electric-field pulse was first studied in vanadium dioxides VO2 [32]. At temperatures far above room temperature, VO2 exists in the metallic phase with a rutile-type structure shown in figure 22(a). With decreased temperature, VO2 shows a phase transition to a monoclinic insulator at Tc ∼ 340 K [33, 34], whose structure is shown in figure 22(b). This phase transition is accompanied by a large structural change, which includes the dimerization of two neighbouring vanadium atoms. Therefore, VO2 in the low temperature phase is considered not to be a simple Mott insulator. M Liu and collaborators demonstrated that VO2 in the insulator phase can be converted to a metal by a strong THz electric-field pulse [32]. In this experiment, a 75 nm thick VO2 thin film was grown on a sapphire substrate and metamaterial gold split-ring resonators (SRRs) were deposited on the film [125]. The sample is shown in figure 23(a). When a THz pulse is incident to this device, the electric field is enhanced in the 1.5 μm SRR capacitive gap. The blue line in figure 23(b) shows a THz electric field waveform used as a pump pulse, the peak electric field of which is about 300 kV cm−1. The absolute value of the local electric field is enhanced up to ∼4 MV cm−1 in the SRRs gap.
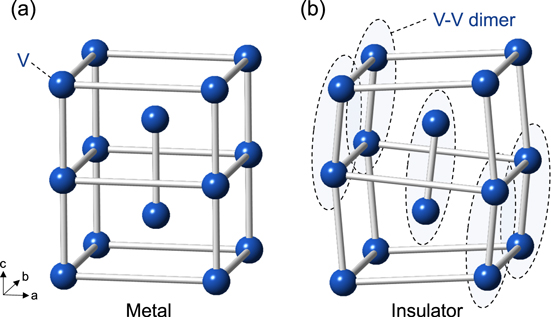
Figure 22. Crystal structure of VO2 (a) in the metallic phase with a rutile-type structure and (b) in the insulator phase with a monoclinic structure. V–V dimers are shown as broken ellipses in (b).
Download figure:
Standard image High-resolution image
Figure 23. (a) Optical image of the VO2 thin film with the metamaterial gold split-ring resonators (SRRs). The SRR capacitive gap length is 1.5 μm. (b) THz electric-field waveform used as a pump pulse (blue line) and the simulated electric-field waveform enhanced in the 1.5 μm SRR gap (red line). (c) Temperature dependence of the THz transmission spectrum of the VO2 thin film with the metamaterial gold SRRs. (d) Transient THz transmission spectra after the irradiation of the THz pump pulse at 324 K. (e) A time evolution of transmission at the frequency of 0.8 THz. Standard errors of the data are shown by bars. The red broken line is a fitting curve. Adapted by permission from Macmillan Publishers Ltd: [32], copyright 2012.
Download figure:
Standard image High-resolution imageFor the evaluation of electrical conductivity, the transmission spectrum in the THz region can be used. Figure 23(c) shows the temperature dependence of the transmission spectrum of the VO2 film, which reflects sensitively the insulator to metal transition at Tc = 340 K. To detect an insulator−metal transition induced by a THz pump pulse, the other THz pulse is prepared as a probe pulse to detect the change of the transmission spectrum. The result of the THz-pulse pump THz-transmission probe experiment at 324 K just below Tc is shown in figure 23(d). The change of the transient transmission spectrum with increase of the SRRs-gap field from 0.3 to 3.3 MV cm−1 is similar to that with increase of temperature from 300 K to 350 K shown in figure 23(c). The comparison of these two series of spectral changes demonstrates that the Mott insulator to metal transition is induced by a THz electric field. Figure 23(e) shows the time evolution of the transmission change at the frequency of 0.8 THz induced by a THz pulse with the maximum electric field of ∼1 MV cm−1. The decrease of the transmission is a signature of metallic states. The time constant of the insulator−metal transition was evaluated to be about 9 ps from the fitting analysis of the time evolution of the transmission change. The fitting curve is shown by the red line in figure 23(e). The THz-electric-field-induced metallic state persists for much longer than 100 ps. This suggests that the insulator−metal transition is accompanied by a large structural change and that the metallic state is a metastable state.
In this insulator to metal transition of the VO2 film, carriers are not directly generated by a THz pump pulse, since the band gap of VO2 (∼0.6 eV [126]) is much larger than the photon energy of the THz pump pulse (∼4 meV). The mechanism of the electric-field-induced transition is explained as follows. The electric field of the pump pulse reduces the Coulomb-induced activation barrier for carrier motions via the Pool−Frenkel effect [127, 128], and the carrier density increases. Those carriers are accelerated by the electric field of the pump pulse. The kinetic energy of carriers given by the THz electric field is converted to Joule heat through a strong electron−lattice interaction [129]. As a result, the temperature of the system increases above Tc and the insulator to metal transition occurs. In this case, the metallic state is generated after the large structural change, resulting in its observed long lifetime.
If the amplitude of the electric field is enhanced, carriers may be generated via the quantum tunnelling process as shown in figure 21. This was attempted on a VO2 film by B. Mayer and collaborators using a multi-cycle mid-IR pulse with the central frequency of ∼20 THz [130]. A mid-IR pulse is more advantageous than a THz pulse for the enhancement of electric field [131]. Since the studies to control electronic states by a mid-IR pulse are beyond the scope of this review, we show only the main result. Figure 24(a) shows a time evolution of transmission change of an 8 fs pulse with the wavelength of 1.2 μm induced by a mid-IR pulse in a 200 nm thick VO2 film. The grey line in figure 24(a) is an electric-field waveform of the mid-IR pulse with the wavelength of 15 μm, the maximum electric-field of which reaches ∼6.1 MV cm−1. The transmission at 1.2 μm decreases within the temporal width of the mid-IR pump pulse, 100 fs. This change is much faster than the transmission change induced by a nearly monocyclic THz pulse (figure 23(e)) mentioned above. This suggests that the carriers are not generated by a heating effect but by quantum tunnelling processes. To ascertain this interpretation, the dependence of the increase in the optical conductivity at the frequency of 25 THz on the maximum electric-field amplitude of the mid-IR pump pulse was investigated, the result of which is shown in figure 24(b). The change of the optical conductivity shows a threshold behaviour, which is well-reproduced by the exponential formula with the threshold electric field Eth of 14.2 MV cm−1, as shown by the red line. From these results, B Meyer et al suggested that carriers are produced through quantum tunnelling processes under a strong electric field. However, the actual mechanism was more complicated, since a multi-cycle electric field was used as an excitation.
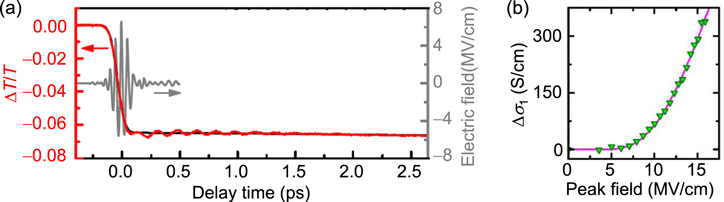
Figure 24. (a) Time evolution of the transmission change for an 8 fs pulse with a wavelength of 1.2 μm (red line). The grey line shows an electric-field waveform of the mid-IR pulse used as a pump pulse. (b) Mid-IR electric-field dependence of changes (Δσ1) in the optical conductivity σ1 at a frequency of 25 THz. Adapted figure with permission from [130]. Copyright 2015 by the American Physical Society.
Download figure:
Standard image High-resolution imageAs mentioned above, M Liu et al succeeded in achieving a THz-electric-field-induced insulator−metal transition in VO2. However, this transition was not induced via purely electronic processes but originated from the increase in the temperature of the system and the resultant structural change. B Mayer et al demonstrated that carriers were generated through quantum tunnelling processes. However, the application of a multi-cycle electric-field pulse makes it difficult to discuss the entire mechanism of the insulator−metal transition. It is anticipated that a measurement of transient spectral changes in the wide energy region would make it possible to fully understand the mechanism of the transition. From the time dependence of the wide range of transient spectra, it may be possible to discriminate the dynamics of charge and lattice degrees of freedom and clarify whether a metallic state can be produced with no structural changes or not.
From the viewpoint of physics of correlated electrons or Mott physics, it is valuable to achieve a purely electronic Mott transition by a simple monocyclic electric-field pulse, which enables a discussion of electronic dynamics. For this subject, it is desirable to choose a narrow-gap Mott insulator with small lattice distortions and to perform a THz-pulse pump optical probe spectroscopy over a wide probe-energy region. A good candidate is an organic molecular compound called a κ-type ET salt, which is expressed as κ-(ET)2X [132, 133]. In the next sub-section, we review the study on that compound to achieve a purely electronic Mott insulator to metal transition by a nearly monocyclic THz electric-field pulse [38].
4.2. Mott insulator to metal transition in κ-(ET)2Cu[N(CN)2]Br via an impulsive dielectric breakdown
In κ-(ET)2X, ET molecules and X− anions form layer structures, similarly to α-(ET)2I3. Figures 25(a) and (b) show the crystal structure and the two-dimensional ET layer, respectively, of a typical κ-(ET)2X salt, κ-(ET)2Cu[N(CN)2]Br [134, 135]. As seen in figure 25(b), ET molecules form dimers and those dimers arrange to form a distorted triangular lattice on the ET layer. In each dimer, the highest occupied molecular orbitals of two ET molecules are hybridised and split into bonding and anti-bonding orbitals. The nominal valence of each ET molecule is +0.5, and a dimer has a hole that occupies the anti-bonding orbital. The bonding and anti-bonding orbitals form two bands with a bandwidth W via inter-dimer molecular overlaps, so that the band consisting of anti-bonding orbitals is half-filled [132, 133]. Figure 25(c) shows the conceptual phase diagram for the κ-(ET)2X family [132, 133]. The vertical axis is the temperature, and the horizontal axis is the effective bandwidth W/Ud. Ud is the Coulomb repulsion energy on each dimer and approximated as 2tdimer, where tdimer is the transfer energy between two molecules forming a dimer (intra-dimer transfer energy). The thick solid line is the boundary between Mott-insulators and metals. In κ-(ET)2X, W can be changed by the choice of X, so that a variety of materials are obtained on both sides of the Mott insulator−metal boundary [132, 133, 136]. Applying pressure increases W, which can cause the Mott insulator to metal transition.

Figure 25. (a) Crystal structure of κ-(ET)2Cu[N(CN)2]Br (κ-Br). (b) Molecular arrangement in a two-dimensional conducting layer parallel to the a−c plane. Red circles denote a hole localised on each dimer. (c) Conceptual phase diagram of κ-Br. The horizontal axis is the effective Coulomb interaction Udimer/W, and the vertical axis is the temperature. PM, SC, PI, and AFI denote paramagnetic metal, superconductor, paramagnetic insulator, and antiferromagnetic insulator respectively. The blue solid and red broken lines show the temperature change of a bulk crystal and a thin single crystal on a diamond substrate of κ-Br respectively.
Download figure:
Standard image High-resolution image4.2.1. Preparation of a Mott insulator near insulator-metal phase boundary
The studied material for the electric-field-induced Mott insulator to metal transition is κ-(ET)2Cu[N(CN)2]Br. Hereafter, this compound is abbreviated as κ-Br. This compound is located on the metal phase near the Mott insulator−metal boundary. It shows a metallic behaviour below 60 K and exhibits superconductivity below 10 K as shown by the blue line in figure 25(c) [134]. To prepare a Mott insulator near the Mott insulator−metal boundary, a thin single crystal of κ-Br is placed on the diamond substrate shown in the inset of figure 26(a). An electronic phase in κ-(ET)2X can be controlled by the strain from the substrate, as was reported first by H M Yamamoto, M Suda and their collaborators [137–139]. When the temperature is decreased, the crystal experiences the negative pressure from the diamond substrate, since the expansion coefficient of κ-Br is much larger than that of diamond [140, 141]. As a result, κ-Br on the diamond substrate becomes a Mott insulator at low temperatures as shown by the red broken line, although the bulk crystal becomes metallic (figure 25(c)) [137, 138].
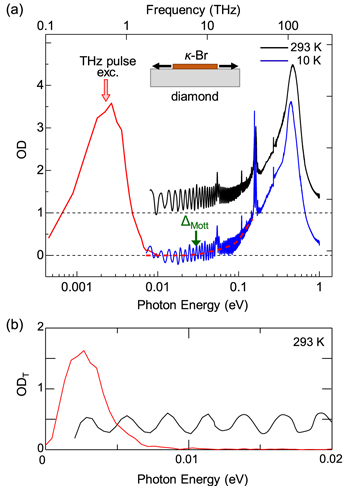
Figure 26. (a) Optical density (OD) spectrum of a thin κ-Br crystal on a diamond substrate at 10 K (blue solid line) and 293 K (black solid line). The red line shows the Fourier power spectrum of an electric-field waveform of the THz pulse. The inset shows a schematic of κ-Br on a diamond substrate. (b) Optical density spectrum ODT calculated only from the transmission (T) spectrum in the THz region at 293 K.
Download figure:
Standard image High-resolution imageThe quantitative evaluation of the Mott gap is possible by the measurements of absorption (optical density: OD) spectrum. Figure 26(a) shows the OD spectra along the c-axis in the κ-Br single crystal on the diamond substrate at 10 K and 293 K, which was obtained using a Fourier transform IR spectrometer. The thickness of the crystal is 0.6 μm. The oscillations on the low-energy region below 0.15 eV are due to the interference of light in the diamond substrate. At 293 K, the OD value is finite at the lower energy bound of the measured range (0.01 eV) reflecting a high conductivity. In contrast, at 10 K, the OD value is equal to zero below 30 meV. This demonstrates that a clear Mott gap ΔMott ∼ 30 meV is open at 10 K.
To measure the OD spectrum below 10 meV, the THz time-domain spectroscopy was performed. The details of the experimental setup was reported elsewhere [142]. In this measurement, the phase shift of the THz wave transmitted through the sample was difficult to be determined, since it was very small. Therefore, the OD spectrum was calculated only from the transmission (T) spectrum using the relation ODT = −log(T). The ODT value does not include the reflection loss, so that it is slightly larger than the OD value. In figure 26(b), the ODT spectrum from 20 meV to 2 meV at 293 K is shown by the black line. A monotonic interference pattern is observed, indicating that no absorptions exist in this region. These results demonstrate that in the thin crystal of κ-Br on the diamond substrate at 10 K is a Mott insulator with a Mott gap of 30 meV, below which it does not show any electronic or phonon absorption.
4.2.2. Observation of electric-field-induced Mott insulator to metal transition
Now, we can proceed to the discussion about the results of THz-pulse-pump optical-absorption-probe spectroscopy on the thin crystal of κ-Br on a diamond substrate, which are summarised in figure 27. The inset of figure 27(b) shows the schematic view of the measurement. The electric-field waveform of a THz pump pulse used in the measurement is displayed in the inset of figure 27(c). The maximum electric-field amplitude, ETHz(0), is 180 kV cm−1. The Fourier power spectrum of the THz pulse is shown by the red lines in figures 26(a) and (b). The comparison of this THz-pulse spectrum with the absorption spectrum of the sample demonstrates that the sample is completely transparent to the THz pulse. Thus, this sample is an appropriate choice to investigate the electric-field-induced carrier generations via the quantum tunnelling mechanism.
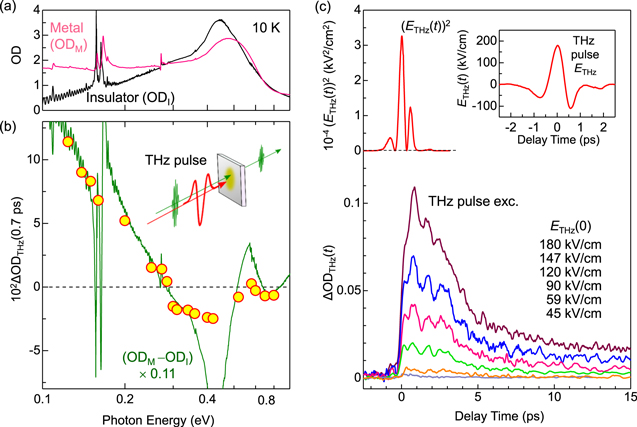
Figure 27. (a) Absorption spectrum of a thin κ-Br crystal on a diamond substrate in the Mott insulator phase (ODI, black line) and that in the metal phase (ODM, pink line) at 10 K (E//c). (b) Transient absorption changes ΔODTHz at td = 0.7 ps induced by the THz pulse shown in the inset of (c). Maximum electric field of the THz pulse, ETHz(0), is 180 kV cm−1. The green solid line is the differential absorption spectrum 0.11 × ΔODMI (ΔODMI = ODM − ODI). The inset shows the experimental configuration of the THz pump optical probe spectroscopy. (c) Red line in the upper part shows the waveform of the square of THz field (ETHz(t))2. In the lower part, the time evolutions of absorption changes ΔODTHz(t) at 0.124 eV are shown for various electric-field amplitudes ETHz(0) of THz pulse.
Download figure:
Standard image High-resolution imageBefore the detailed discussions of the results, we refer to the spectral change between the metal phase and the Mott insulator phase at 10 K. Figure 27(a) shows the optical density spectra of a bulk κ-Br crystal in the metal phase (ODM) and of the thin κ-Br crystal on the diamond substrate in the Mott-insulator phase (ODI) at 10 K. The two spectra are different in the wide energy region from 0.9 eV down to 0.1 eV. The green line in figure 27(b) shows the differential OD spectrum, ΔOD(=ODM − ODI), which corresponds to the absorption change expected when a Mott insulator to metal transition occurs at 10 K. With decrease of the photon energy, ΔOD increases monotonically, which is the signature of the metallic state.
In the lower part of figure 27(c), we show the time evolutions of the absorption change ΔODTHz at 0.124 eV for various maximum electric fields of THz pulses, which can be a measure of the metallisation. The absorption change ΔODTHz is rapidly increased at td = 0 ps in all the electric fields in common. These initial rises in the signals seem to follow the square of the THz electric field shown by the red line in the upper part in figure 27(c). Subsequently, the ΔODTHz signals show the fast decay up to ∼5 ps and the slower decay up to ∼100 ps. Moreover, oscillatory components are observed, which are ascribed to coherent molecular oscillations [143, 144].
To obtain information about the electronic-state changes, similar measurements were performed at various probe photon energies, and the spectrum of ΔODTHz signals was obtained. The red circles in figure 27(b) show the probe-photon-energy dependence of the ΔODTHz signals at td = 0.7 ps, at which the ΔODTHz signals reach their maxima. This ΔODTHz spectrum shows the decrease of the original absorption peak around 0.4 eV. Below 0.3 eV, the absorption increases monotonically as the photon energy decreases. This change of ΔODTHz is quite similar to the differential absorption spectrum between the metal phase and the Mott insulator phase ΔOD, shown by the green line. Such a spectral change of ΔODTHz clearly demonstrates that a Mott insulator to metal transition is induced by a THz electric field.
The absorption change ΔODTHz is comparable to ΔODMI × 0.11 (ΔODMI = ODM − ODI). This indicates that the carrier number generated by the THz electric-field pulse is 11% of the carrier number in the metallic phase of a bulk crystal. In a bulk crystal, the effective carrier number was estimated to be 0.5 per dimer from the analyses of the steady-state optical conductivity spectrum [145, 146]. Hence, in the metallic phase induced by the THz pulse with ETHz(0) = 180 kV cm−1, the carrier number is estimated to be 0.055 per dimer.
4.2.3. Mechanism of electric-field-induced Mott insulator to metal transition
Here, we discuss the mechanism of carrier generation and metallisation by a THz electric-field pulse in κ-Br crystal on diamond substrate. A possible mechanism to be considered is the impact ionisation process observed in semiconductors [17–22]. We can exclude this possibility, since the κ-Br crystal has a clear Mott gap of 30 meV at 10 K and no carriers are originally introduced, as seen in figures 26(a) and (b). If some vibrational or lattice modes are directly excited by the THz pump pulse, the Coulomb repulsive energy Ud on each dimer is modified [147], which might give rise to the metallisation. This possibility can also be excluded, since no infrared-active modes exist below 2.5 THz (figure 26(b)).
The THz pulse is located in the transparent region, so that metallisation is attributed to the impulsive dielectric breakdown of the Mott insulator via doublon−holon pair production [122]. The Mott gap ΔMott(∼30 meV) is much larger than the THz-pulse photon energy (2–7 meV). Consequently, multiphoton processes are neglected. The most plausible mechanism involves quantum tunnelling between the lower Hubbard band and the upper Hubbard band, as mentioned in sub-section 4.1 (figure 21). This phenomenon corresponds to the Zener tunnelling in band insulators [115]. In the case of Mott insulators, doublon–holon pairs can be generated via similar tunnelling processes [122], which might lead to a Mott transition.
The electric-field dependence of absorption changes at 0.124 eV and at the time origin, ΔODTHz(0), is plotted by black circles in figure 28(a). ΔODTHz(0) values show a clear threshold behaviour. To see the ΔODTHz(0) data at the low-electric-field region, we also show a logarithmic plot in figure 28(b). As mentioned in the previous sub-section, in the quantum tunnelling process in Mott insulators induced by a monocyclic THz pulse, the electric-field dependence of the carrier number N can be expressed by  with the threshold electric field Eth. The ETHz(0) dependence of ΔODTHz(0) given in figures 28(a) and (b) (black circles) is in agreement with this formula with Eth = 64 kV cm−1 as shown by the green broken lines. The correlation length ξ, which represents the effective distance of a doublon and a holon thus generated (see figure 28(c)), is given by
  [122]. Using the Mott-gap energy of ΔMott = 30 meV and the threshold electric field of Eth = 64 kV cm−1, ξ is evaluated to be 23 Å. This value is reasonable as a spatial extension of the electron wavefunction shown schematically by the yellow shaded area in figure 28(c), since it is approximately three times as large as the inter-dimer distance (7.7 Å) along the c-axis [134].
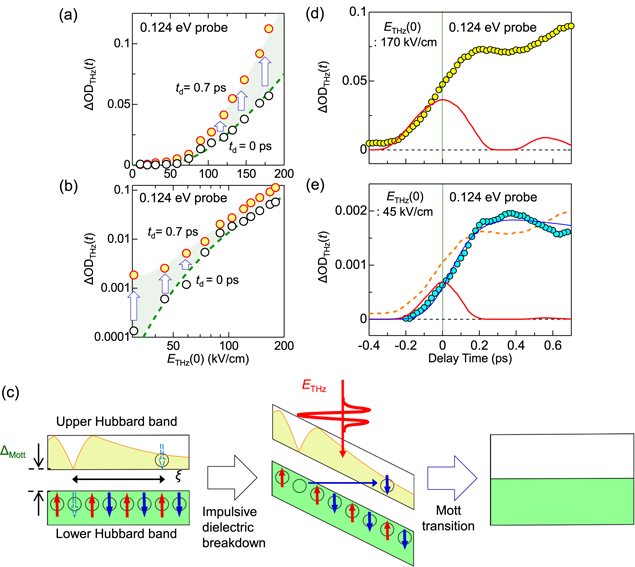
Figure 28. (a), (b) THz electric field ETHz(0) dependence of ΔODTHz(0) (black circles) and ΔODTHz(0.7 ps) (yellow circles) at 0.124 eV in κ-Br, which are the measures of carrier generation and the Mott transition respectively. The green broken lines show  with Eth = 64 kV cm−1. Blue open arrows indicate the changes by Mott transitions. (c) Electric-field-induced Mott insulator to metal transition. ξ in the left panel represents the correlation length between a doublon and a holon. The yellow shaded area in the upper Hubbard band shows an occupation probability of the electron on the second site from the left via quantum fluctuations. The middle panel shows the impulsive dielectric breakdown via quantum tunnelling process (Zener tunnelling) induced by a THz electric field. A doublon−holon pair is produced by this process. The right panel shows the subsequent Mott transition. (d, e) The time evolutions of ΔODTHz(t) at 0.124 eV (circles); (d) high-electric-field case of ETHz(0) = 170 kV cm−1 and (e) low-electric-field case of ETHz(0) = 45 kV cm−1. The solid blue line and the broken orange line in (e) are respectively the fitting curve explained in the text and ΔODTHz(t) at ETHz(0) = 170 kV cm−1 shown in (d). The red lines are the waveforms of tunnelling probability calculated from ETHz(t).
Download figure:
Standard image High-resolution image
4.2.4. Dynamical aspects of carrier generation and metallisation
As seen in figure 27(c), each absorption change ΔODTHz is the maximum at td = 0.7 ps, which is considered as the end point of Mott transition. ΔODTHz values at td = 0.7 ps are plotted by the red circles as a function of maximum electric field in figures 28(a) and (b). The scrutiny of figure 28(b) makes us notice that the electric field dependence of ΔODTHz at td = 0.7 ps deviates from the formula of  Such a deviation is prominent at the lower electric-field region below ETHz = 70 kV cm−1. It shows that finite time is necessary for the Mott insulator to metal transition after the carrier generation at td = 0 ps.
To obtain more detailed information about the dynamics of the Mott insulator to metal transition, we analyse the time evolution of ΔODTHz for the strong electric-field case with ETHz(0) = 170 kV cm−1 and the weak electric-field case with ETHz(0) = 45 kV cm−1, which are shown in figures 28(d) and (e) respectively. The red line shows the waveform of  calculated from the THz electric-field waveform. This waveform denotes the possibility that a doublon–holon pair can be generated through the quantum tunnelling process. Note that the two waveforms shown by the red lines depend nonlinearly on the magnitudes of THz electric field and therefore are different from each other. The time evolution of ΔODTHz for ETHz(0) = 170 kV cm−1 in figure 28(d) shows no delay compared to the waveform of
  On the other hand, the initial rise of ΔODTHz(t) for ETHz(0) = 45 kV cm−1 in figure 28(e) is delayed in comparison to ΔODTHz(t) for ETHz(0) = 170 kV cm−1 in figure 28(d). The time evolution of the latter is also shown by the broken orange line in figure 28(e) for comparison. To evaluate the rise time of ΔODTHz(t), we performed a fitting analysis using the following formula:
The parameters of τ1 and τ2 show the rise time and the decay time of carriers responsible for the absorption change ΔODTHz(t), respectively. The initial response of ΔODTHz for ETHz(0) = 45 kV cm−1 can be reproduced as shown by the blue line in figure 28(e) with a rise time τ1 of 0.13 ps and decay time τ2 of 2.4 ps. On the other hand, in the time evolution of ΔODTHz(t) for ETHz(0) = 170 kV cm−1, the delay of the initial response is not observed. In fact, ΔODTHz(t) can be reproduced well by equation (5) with the rise time τ1 = 0 ps.
The results of these analyses can be explained in the following way. When the electric field strength is low, the number of carriers generated via the quantum tunnelling processes at td ∼ 0 ps are relatively small, and thus the Mott gap does not collapse as shown in the middle part of figure 28(c). Subsequently, the Mott transition occurs in the period up to td = 0.7 ps with nonlinear increases in carrier population, as indicated by the arrow in figure 28(b). The rise time of the absorption change ΔODTHz(t) for the weak electric field ETHz(0) = 45 kV cm−1, 0.13 ps, is considered to be a characteristic time for the collapse of the Mott gap. It is natural to compare this characteristic time (0.13 ps) to the inter-dimer transfer energies. In κ-Br, two kinds of inter-dimer molecular overlaps with the transfer energy of 78 meV and 33 meV, the characteristic time of which is 0.05 ps and 0.12 ps, respectively [148, 149]. The latter time 0.12 ps almost accords with τ1 = 0.13 ps, suggesting that the time scale of Mott transition would be determined by the smaller inter-dimer transfer energy.
4.2.5. Role of electron−lattice interaction in the Mott insulator phase
After the electric-field-induced Mott insulator to metal transition occurred, an oscillatory structure was observed on the time evolution of absorption changes ΔODTHz(t) (see the lower part of figure 27(c)). We briefly discuss the origin of this oscillation. Detailed analyses of the oscillatory component revealed that it consisted of three oscillation modes with the frequencies of 28 cm−1, 37 cm−1, and 46 cm−1. We consider that these oscillation modes were related to the dimer structure characteristic of κ-type ET compounds and the corresponding molecular displacements stabilised the original Mott insulator state [143, 144]. When two molecules in a dimer neared each other, the intra-dimer transfer energy tdimer increased. This led to an increase of the effective Coulomb repulsive energy Ud on each dimer, since Ud is equal to 2tdimer [132, 133]. The enhancement of Ud made the Mott insulator state stable. When the electric-field-induced Mott insulator to metal transition occurred, these molecular displacements were released, giving rise to the coherent oscillations. Thus, the observation of the coherent oscillations suggests that the effect of the electron−lattice interaction cannot be neglected in κ-type ET compounds. As discussed here, a response to a strong THz electric field sometimes includes information about an important interaction hidden in the material.
4.2.6. Comparison of electric-field-induced and photoinduced Mott insulator to metal transitions
Finally, we will compare the electric-field-induced Mott insulator to metal transition with a photoinduced transition. In the same thin single crystal of κ-Br on the diamond substrate, a photoinduced Mott insulator to metal transition was investigated using the near-IR pump pulse with the temporal width of 100 fs and the photon energy of 0.93 eV. After such a photoexcitation, the monotonic increase of the absorption change with decrease of photon energy similar to the ΔODTHz signals (red circles in figure 27(b)) was observed (not shown). When the excitation fluence Iex of the near-IR pump pulse was set to be the same as the THz electric-field pulse with ETHz(0) = 180 kV cm−1, that is, Iex = 7.7 μJ cm−2, the number of carriers generated was found to be 0.018 per dimer. In other words, the carrier generation efficiency (0.055 per dimer) due to the THz pulse excitation is about three times as large as that due to the near-IR pulse excitation. This evaluation demonstrates that the THz-electric-field-induced carrier generation is fairly effective. In the case of the near-IR excitation, the pump photon energy (0.93 eV) is much larger than the Mott gap (30 meV), so that the initial photoexcited states have large excess energies, which will be transferred to phonons rather than used to excite other carriers. This is the reason why the carrier generation efficiency of the THz pulse excitation is higher than that of the near-IR pulse excitation.
5. Conclusion
In this paper, we have reviewed ultrafast control of electronic states by a nearly monocyclic THz pulse in three kinds of organic molecular compound with correlated electron systems, TTF-CA, α-(ET)2I3, and κ-(ET)2Cu[N(CN)2]Br. The results are summarised as follows.
- (1)In the ferroelectric ionic phase of TTF-CA, sub-picosecond modulation of the ferroelectric polarization amplitude by a THz electric field was achieved via the modulation of the degree of intermolecular CT (ρ) within each dimer, or equivalently the molecular ionicity. This response is purely electronic, and characteristic of electronic-type ferroelectricity in this compound. The initial modulation of ρ causes coherent molecular oscillations of the spin-Peierls mode via the change in the spin moment of each molecule, which induces additional modulation in ρ and polarization.
- (2)In the para-electric neutral phase of TTF-CA, it was demonstrated that a THz pulse with the electric-field amplitude of ∼400 kV cm−1 produces a large macroscopic polarization in the sub-picosecond time scale, whose magnitude reaches ∼20% of that in the ferroelectric ionic phase. Such a large polarization generation is attributed to fractional intermolecular CTs and breathing motions of domain walls between microscopic NIDWs induced by the THz electric field.
- (3)In the CO phase of α-(ET)2I3, SHG had been observed, and the possibility of ferroelectricity had been suggested. However, due to the low resistivity of the compound, no P − E characteristic along the ET conducting layer has been measured and the nature of the ferroelectricity has not been clarified so far. By applying THz-pulse pump SHG probe and optical-reflectivity probe measurements on α-(ET)2I3 in the CO phase, unambiguous evidence for electronic-type ferroelectricity was obtained and the diagonal direction of the polarization with respect to the crystal axes was demonstrated. After the sub-picosecond polarization modulation by THz electric fields, prominent oscillations appear in the reflectivity but not in the SHG probe results, suggesting that the CO is strongly coupled with molecular displacements, while the ferroelectricity is electronic in nature.
- (4)In the Mott insulator phase of κ-(ET)2Cu[N(CN)2]Br, the irradiation of a THz electric-field pulse induces a nonlinear increase of the Drude-like low-energy spectral weights. From the analyses of the responses, it was revealed that the THz electric field produces doublon−holon pairs by quantum tunnelling processes and the original Mott gap of ∼30 meV is collapsed with a time constant of ∼0.1 ps. Thus, the application of a strong electric field can induce a Mott transition by a new pathway—namely, impulsive dielectric breakdown. Additionally, it was demonstrated that metallisation by this method occurs more effectively than that due to femtosecond laser-pulse irradiation. Thus, strong THz-pulse irradiation is an effective approach to achieve a purely electronic Mott transition.
Finally, we would like to comment on some future prospects. In most of the previously reported photoinduced phase transitions, an ordered phase is broken or melted by light. It is usually difficult to form a more ordered state or a lower-symmetry state using light [150]. However, as a THz pulse does not provide a material with a large amount of energy, a new ordered state can be expected to be formed by a THz pulse. For example, a THz electric-field-induced para-electric to ferroelectric phase transition is expected to be a possible candidate. By using a light pulse and THz pulse alternately, it might be possible to achieve ultrafast switching of an electronic state between an ordered (low-symmetry) phase and a less-ordered (high-symmetry) phase at a high repetition rate.
Acknowledgments
The authors thank N Kida, Y Kinoshita, K Miyagawa, K Kanoda, H Mori (Univ. of Tokyo), T Terashige, Y Matsumoto, S Watanabe, Y Shimoi (AIST), K Iwano (KEK), K Yamamoto (Okayama Univ. of Sci.), M Suda, H M Yamamoto (IMS), and R Kato (RIKEN) for collaborations and discussions. H O acknowledges support from the Japan Society for the Promotion of Science (JSPS) (Grant Number JP25247049) and CREST, Japan Science and Technology Agency (Grant Number JPMJCR1661). T Miyamoto acknowledges support from JSPS (Grant Number JP16K17721). T Morimoto and H Y acknowledge supports from JSPS through the Program for Leading Graduate Schools (MERIT) and Research Fellowship for Young Scientists.