

Abstract
Baicalein, a kind of flavonoid, has many medical benefits, and therefore, its accurate and efficient determination is necessary in the field of medical ingredient detection. To achieve the rapid and precise detection of baicalein, a three-dimensional (3D) expansion–contraction wave micromixer was designed and used along with an electrochemical detection method to assemble a micromixing electrochemical detection system. First, the performances of the wave micromixers were investigated using the COMSOL Multiphysics 5.3 a software with three optimisation objectives, namely, the mixing uniformity, pressure drop, and mixing performance index, to comprehensively evaluate the properties of the micromixers. Second, a 3D expansion–contraction wave micromixer with optimal mixing properties was fabricated using the 3D printing technology. Third, a micromixing electrochemical detection system was built to study the redox behaviours of baicalein through the electrochemical cyclic voltammetry method. The effects of buffer varieties, buffer pH values, scanning speeds, and inlet flow rates on the redox curves of baicalein were studied to determine the appropriate experimental conditions. The results demonstrated that the currents of the oxidation peak increased linearly with the baicalein concentrations within the range of 3.55 × 10⁻⁶–5.92 × 10⁻⁵ mol l−1 and the detection limit of 1.861 × 10⁻⁸ mol l−1 (S/N = 3). The relative standard deviation among the results obtained through repeated experiments was 2.86%; this proves a high detection reproducibility of the new method. Compared with spectrophotometry, the error determined using the novel method in a real sample detection was 0.31%, thus achieving an efficient and precise detection of baicalein. The micromixing electrochemical detection method can remarkably improve the mixing efficiency, shorten the detection time, and decrease the detection limit, and therefore could be popularised for the exact content detection of other flavonoids.
Export citation and abstract BibTeX RIS
1. Introduction
As an important component of the traditional Chinese medicine Scutellaria, baicalein has three ortho-phenolic hydroxyl groups, which are beneficial for scavenging free radicals [1], anti-inflammatory [2], anti-oxidation [3], liver protection, and diuresis [4]. Research on the functions of baicalein has received widespread attention for usage in the cure of breast cancer [5], colon cancer [6], lung cancer [7], Parkinson [8], and other diseases owing to its effects of inducing cell apoptosis [9] and inhibiting proliferation [10]. Hence, the efficient and accurate determination of the content of baicalein in medicine is of significant value in the medical field. Conventional detection methods, such as capillary electrophoresis [11], high-performance liquid chromatography [12], and chromatography-mass spectrometry [13], are powerful and reliable but are expensive and time-consuming. With the advantages of high sensitivity, good selectivity, and fast response [14], the electrochemistry detection method is a popular and affordable way to detect substances. However, the use of only the electrochemical detection method has the disadvantages of complex operation and large reagent consumption in food and drug industries. As detection methods become more sensitive, convenient, and automatic, a new technique must be devised to promote the efficiency of substance determination.
Scientists have made great efforts to promote substance detection through electrochemistry methods, mainly including three aspects: electrode modification, electrode material selection, and optimisation of detection parameters. Murtada et al[ 15] used aluminium-doped copper selenide nanoparticles (NPs) to modify screen-printed carbon electrodes (SPCEs). The research demonstrated that the Al-Cu-SE-NPS/SPCEs exhibited good analytical performance for L-tyrosine detection in drugs through the cyclic voltammetry (CV) method. Newair et al[ 16] applied a glassy carbon electrode and SPCEs modified with carbon nanotubes to detect polyphones in red wines through square wave voltammetry (SWV). They showed that compared with CV and differential pause voltammetry (DPV), SWV is fast and satisfactorily characterises polyphenols. Muhammad et al[ 17] presented gold NPs and carbon nanotubes to promote the detection accuracy of thiamphenicol in bovine milk through DPV and obtained satisfactory results. To achieve the precise detection of compounds and decrease the detection limits, various methods have been proposed to modify the electrodes or study different detection technologies. However, the modification of SPCEs by using methods, such as drop casting, makes it difficult for materials to be distributed evenly on the working electrode. The aforementioned detection methods, however, are not helpful in saving detection time, saving the amount of samples and realising continuous detection during the experiments.
In electrochemical detection, electrode reaction process includes the substance transportation from bulk solution to the electrode surface. Thus the distribution status of substance in bulk solution affects the accuracy of detection results. On the other hand, pH values and electrolyte concentrations affect the detection results of flavonoids [18], so it is necessary to mix samples and buffer solutions well before detection. Therefore, a micromixing electrochemical detection system was proposed to ensure accurate detection while achieving continuous detection, reducing the consumption of samples to be tested and simplifying experimental operations by applying a micromixer to realise the complete mixing of fluids.
Micromixers can achieve sufficient mixing between different species, and therefore promote rapid mixing, conserve the consumption of samples to be tested, and provide a stable background environment for subsequent biochemical reactions, substance detection, and environmental monitoring [19, 20]. Micromixers can be divided into two types: active and passive micromixers [21]. Owing to the influence of the internal structures of the passive micromixer, the microfluids are twisted, stretched, and folded [22]. Such phenomena can increase the contact area between species and promote molecular diffusion and chaotic convection [23]. Micromixers are conventionally manufactured through etching [24] and lithography [25] technologies. However, they must be operated in clean rooms, and the microchannel structures are mainly designed in a two-dimensional plane; achieving continuous structural changes in a three-dimensional (3D) space is difficult [26].
Li et al[ 27] simulated the mixing performance of a zigzag micromixer using the Fluent software. The results confirmed that the species possessed great mixing uniformity after passing through a Z structure, indicating that a sharp structural design could strongly promote micromixing. Mihret et al[ 28] studied the mixing efficiency of micromixers with repeated triangular wave structures. The investigation indicated an obvious improvement in the mixing efficiency compared with that of the Y-micromixer. However, if the equivalent diameter of the microchannel is too small or the length is too long, it would inevitably lead to excessive pressure drop in the micromixer, and this is not conducive for the long-term practical application and energy conservation of a micromixer. Based on the aforementioned literature review, a sharp corner wave (SCW) microchannel, a rounded corner wave (RCW) microchannel, and 3D expansion–contraction wave (3D-ECW) microchannels were designed to optimize wave microchannel structures and enhance micromixing. The mixing performances of these microchannels were determined using the COMSOL Multiphysics 5.3 a software. The effects of the inlet Reynolds (Re) number, microchannel structures, and ratios of expansion and contraction in the 3D-ECW micromixers on the mixing performances were simulated. As a comprehensive evaluation index, the mixing performance index was defined to obtain the optimal 3D-ECW micromixer structure. To the best of our knowledge, research on the combination of a 3D-ECW micromixers with the electrochemical detection technology for the determination of substance content in food and drug has not yet been reported.
This is the first study to design the 3D-ECW micromixer and fabricate it using the 3D printing technology; the micromixer consists of a feeding zone, mixing zone, detection zone, and discharge zone. In addition, a micromixing electrochemical detection system was established by integrating SPCEs. This system could promote the rapid and efficient mixing of different reagents, provide a stable fluid environment for electrochemical detection, and avoid detection errors caused by uneven mixed solutions. In this study, the new method was applied to explore the impacts of four factors, namely, buffer varieties, buffer pH values, scanning speeds, and inlet flow rates, on the redox curves of baicalein to determine the appropriate experimental parameters and baicalein content extracted from the baicalein Al capsules. Finally, the results were compared with those determined through spectrophotometry.
2. Microchannel structural design
Figure 1 shows the schematic of the three wave microchannels, namely the SCW microchannel [figure 1(a)], RCW microchannel [figure 1(b)], and 3D-ECW microchannel [figure 1(c)]. To improve the mechanical properties of the microchannels, the RCW microchannel was optimised based on the SCW microchannel. As the sidewall structure smoothed, the disturbing effect for the microfluids was weakened, and the expansion and contraction structure of the upper and lower bottom surfaces were designed to enhance the chaotic mixing between species. Each microchannel consists of two inlets, one outlet, and a mixing channel. In the three microchannels (figure 1), width d = 0.4 mm, height H = 0.4 mm, and total mixing channel length, L = 6.6 mm. In the 3D-ECW microchannel, the ratio of the structural expansion and contraction (EC ratio, α = h/s) is in the range of 4/3–8/3.
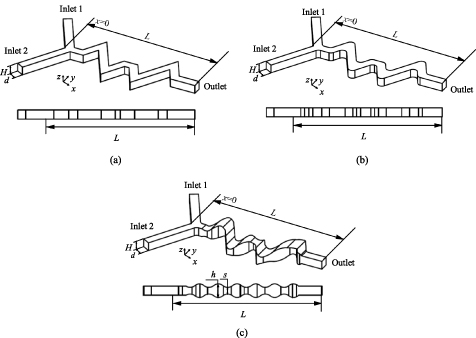
Figure 1. Schematic views of the (a) SCW microchannel, (b) RCW microchannel, and (c) 3D-ECW microchannel. H is the height of the inlet channel, d is the width of the inlet channel, L is the total length of the mixing channel, h is the maximum height of extraction structures in 3D-ECW microchannel, s is the minimum height of contraction structures in 3D-ECW microchannel.
Download figure:
Standard image High-resolution image3. Methods
3.1. Numerical simulation details
3.1.1. Governing equation.
The performances of the three passive micromixers, as shown in figure 1, were numerically simulated using the COMSOL Multiphysics 5.3 a software. The incompressible Navier–Stokes and continuity equations were executed to describe the single-phase and laminar flows. The governing equation of the solver is defined as


where ρ denotes the fluid density,
u
is the fluid velocity, p is the pressure,  is the dynamic viscosity,
F
is the body force,
I
denotes the identity matrix, and T represents the viscous stress tensor.
is the dynamic viscosity,
F
is the body force,
I
denotes the identity matrix, and T represents the viscous stress tensor.
The concentration distribution in the steady-state problem is described by the convection–diffusion equation:

To quantify the concentration distribution in a cross-section of the proposed microchannels, mixing uniformity M is defined as follows [29]:
where N represents the total number of concentration sampling points obtained in a microchannel cross section, cn is the mass fraction of the sampling point on node n, c* denotes the expected mass fraction of the sampling point, and c* = 0.5. M = 1 implies that the mixture is completely mixed and M = 0 implies that it is completely unmixed. Each calculation had more than 300 sampling nodes in the z= 0.2 mm section lines on the y–z cross-sections within a microchannel.
The driving force required for the fluid transport in the passive micromixer was affected by the pressure drop. Pressure drop  [30] is the pressure difference between the inlet and outlet sections of the microchannel.
The mixing performance index, IMP, is defined to comprehensively evaluate the mixing property of a micromixer:
3.1.2. Simulation setup.
The microchannels were first modelled using the SolidWorks software, which was later imported into the COMSOL 5.3 a software for simulation. The initial conditions of the simulation were set as follows. Water was used as the fluid material, and the initial concentrations of the two inlets were 0 mol l−1 and 1 mol l−1. The wall was set to incompressible nonslip boundary conditions. Other parameters and boundary conditions were set as shown in table 1. As the substance concentration is nanoscale in this simulation, the transfer of diluted substances module was coupled to model mixing, which is helpful to simulate the concentration distribution of dilute substance. The dynamic viscosity and the molecular diffusivity are the same as H2O (water)[liquid]'s, shown in table 1. The models were meshed with a tetrahedral grid by the meshing tool in the COMSOL software, and fluid dynamics was used as the grid calibration model. The simulation results are presented in section 4.1.
Table 1. Setting of simulation parameters.
| Simulation parameters | Value |
|---|---|
| Density | ρ = 1000 kg m−3 |
| Dynamic viscosity | μ =10−3 Pa·s |
| Molecular diffusivity | D =10−9 m2 s−1 |
| Outflow pressure | P = 0 Pa |
| Velocity of the flows at the channel walls | u = 0 m s−1 |
3.2. Experimental details
3.2.1. Reagents and apparatus.
Baicalein (>98%) and baicalein aluminium capsules were used as the reagents. Britton–Robinson (B–R), Citrate buffer saline (CBS), and Phosphate buffer saline (PBS) were prepared using analytical grade reagents. Other reagents included absolute ethanol, potassium chloride, sulphuric acid, and sodium bicarbonate. The experiment also used deionised water (DI water).
Preparation of baicalein stock solution: Dissolve 20 mg of baicalein in absolute ethanol and dilute it to 50 ml to obtain 1.48 × 10⁻³ mol l−1( 0.4 mg ml−1) baicalein stock solution, mixed well, and refrigerated at 4 °C.
Baicalein extraction from baicalein Al capsules: Dissolve a capsule (net weight 0.2 g) in DI water, and then filter it through a filter paper. Dry the filter residue and stir to dissolve it with absolute ethanol. Filter the solution and collect the filtrate, which should be diluted to 25 ml with absolute ethanol, mixed well, and refrigerated at 4 °C.
The apparatus included a dual-channel syringe pump (Wenhao Co., Ltd. Suzhou), a CHI660E electrochemical workstation (Chenhua Co., Shanghai), a precision electronic analytical balance (Ohaus Co., Ltd. Shanghai), micromixers (School of Mechanical Engineering, Jiangnan University), a screen-printed electrode (the working and counter electrodes were carbon while the reference electrode was made of silver/silver chloride), and a UV 1800 ultraviolet-visible spectrophotometer (Shimadzu Co., Japan).
3.2.2. Methods.
CV determination of baicalein: The baicalein stock solution was diluted with DI water. The baicalein and buffer solutions were pushed into the micromixer using a dual syringe pump. Further, the influences of the buffer varieties, buffer pH values, scanning speeds, and inlet flow rates on the redox currents of baicalein were studied in the 0–0.8 V potential window to obtain suitable experimental operating parameters. The calibration curve of baicalein was determined under the aforementioned conditions and used to detect the baicalein content in the baicalein Al capsules. After each set of experiments, the electrodes were replaced with new ones to ensure the reliability of the experimental results.
Spectrophotometric (SP) determination of baicalein: Transfer 0 ml, 0.25 ml, 0.5 ml, 0.75 ml, 1.0 ml, 1.25 ml, 1.5 ml, 2.0 ml of baicalein solution with the mass concentration of 0.4 mg ml−1 in 10 ml colorimetric tubes. The baicalein was treated using a sodium nitrite-aluminium nitrate-sodium hydroxide colour system. A UV 1800 ultraviolet-visible spectrophotometer was used to detect samples at 510 nm, and a calibration curve was obtained. The absorbance of the medicine was measured under the same conditions and the baicalein content in the medicine was calculated. The experimental results are presented in section 4.3.
4. Results and discussions
4.1. Simulation
4.1.1. Effect of Reynolds numbers on the mixing uniformity in various wave microchannels.
The mixing uniformity in different wave microchannels was simulated under Reynolds numbers of Re = 0.1–40. Figures 2–4 show the simulation results in SCW microchannel, RCW microchannel and 3D-ECW microchannel respectively, in which the (a) shows concentration distribution and the (b) shows velocity streamlines of two species. It can be learned from figure 2(a) that with the increase of Reynolds numbers, the concentration distribution became more and more uniform. The concentration cloud image mainly changed when the fluid flew through the corner structures. In figure 2(b) When Re < 10,the streamlines were basically paralleled to each other without crossing; when Re = 20, the streamlines overlapped on the contact interface; when Re = 40, vortex current could be observed but not obvious. In the RCW microchannel, as shown in figure 3, the simulation results had the same trend as figure 2. However, even when Re = 40, the streamlines in RCW microchannel did not appear vortex phenomenon. In figure 4(a), when Re > 10, the concentration distribution changed obviously in 3D-ECW michrochannel, which shows that the expansion and contraction structure has a significant disturbing effect on microfluids. In figure 4(b), the streamlines also changed obviously. The streamlines overlapped on the contact interface when Re = 10; vortex current could be observed when Re = 20 and streamlines overlapped almost in the entire microchannel. When Re = 40, an extremely obvious vortex phenomenon can be observed. After all, the expansion and contraction structure can disturb microfluids and increase the contact area of the microfluids at a relatively low Reynolds number, leading to an effectively improvement of mixing uniformity.

Figure 2. Simulation results in SCW microchannel. (a) Concentration distribution. (b) Velocity streamlines of two species.
Download figure:
Standard image High-resolution image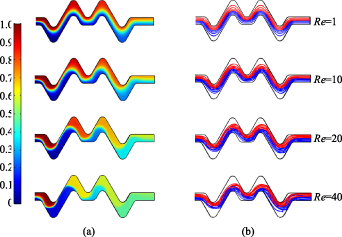
Figure 3. Simulation results in RCW microchannel. (a) Concentration distribution. (b) Velocity streamlines of two species.
Download figure:
Standard image High-resolution image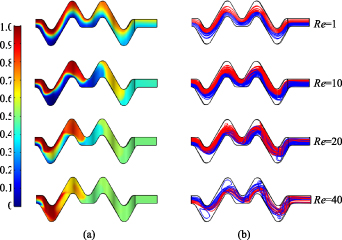
Figure 4. Simulation results in 3D-ECW microchannel. (a) Concentration distribution. (b) Velocity streamlines of two species.
Download figure:
Standard image High-resolution imageFigure 5 shows the influences of Re on the mixing uniformity of microfluids. As shown, in different wave microchannels, as Re increases, the mixing uniformity of the two species first decreases sharply, then increases, and finally stabilises. The worst mixing uniformity of species was observed when Re = 3. For Re < 3, the flow velocities of the microfluids were low, resulting in a long residence time in the microchannel. The species mixing was mainly dominated by molecular diffusion. When Re > 3, the uniformity of the species gradually increased with increase in Re. The mixing uniformity of the RCW microchannel was always the lowest when Re > 10; thus, this structure was not considered in later experiments. In the 3D-ECW microchannel with an EC ratio of 7/3, the mixing uniformity was always excellent when Re < 28 and was constant when Re = 20. The micromixing uniformity in the other wave microchannels was not stable until Re = 30. In summary, the 3D-ECW microchannel with an EC ratio of 7/3 could achieve good species mixing uniformity at a relatively low Reynolds number.

Figure 5. Mixing uniformity with various Reynolds numbers in different wave microchannels.
Download figure:
Standard image High-resolution image4.1.2. Effect of Reynolds numbers on pressure drops in various wave microchannels.
In a passive microchannel, the flow of microfluids are driven by external energy. The structures of microchannels and velocity of microfluids not only affect the mixing uniformity but also affect the inlet pressure in microchannels. Therefore, suitable microchannel structures and inlet flow rates can save driving energy as well as improve the performance of micromixers. The pressure distribution diagram in the SCW microchannel, ECW microchannel and 3D-ECW microchannel are demonstrated in figure 6. It can be learned that with the increase of Reynolds number, the inlet pressure increase gradually. Compared with the other two microchannels, the corner structure is the sharpest in the SCW microchannel, leading to an increase in pressure drop during fluid flow at the same Reynolds number. While in the RCW microchannel, the corners are relatively smooth, resulting in a lower local pressure drop. In the 3D-ECW microchannel, inlet pressure did not increase due to the continuous and smooth change of extraction and contraction structures.

Figure 6. Pressure distribution diagram in three wave microchannels.
Download figure:
Standard image High-resolution imageFigure 7 shows the pressure-drop diagram of different structural wave microchannels with Re in the range of 0.1–40. As shown, the pressure drops in the SCW and 3D-ECW microchannels with an EC ratio of 4/3 were relatively higher than in the other microchannels. In the RCW and 3D-ECW microchannels with an EC ratio of 8/3, the pressure drops were relatively low. The higher pressure drops might be due to the sudden change of the sidewall structures in the SCW microchannel and the continuous structural changes of the bottom surfaces and smaller flow space in the 3D-ECW microchannel with an EC ratio of 4/3, which led to an increase in the flow resistance of the microfluids. The lower pressure drop could be associated with the smooth and relatively simple structure of the RCW microchannel and the large flow space in the 3D-ECW microchannel with an EC ratio of 8/3. Therefore, we conclude that compared with the SCW microchannel, the use of rounded corners in the design could decrease the pressure drop and weaken the mixing uniformity simultaneously. With the optimal structure design of the 3D-ECW microchannels, both the mixing uniformity and pressure drop were affected to varying degrees with the variation of the EC ratio. Thus, a new evaluation standard must be derived to obtain an optimal microchannel structure.

Figure 7. Pressure drop with various Reynolds numbers in different wave microchannels.
Download figure:
Standard image High-resolution image4.1.3. Effect of EC ratios on mixing performance index at various Reynolds numbers.
Figure 8 describes the effect of the EC ratio on the mixing performance index in the 3D-ECW microchannels for the Reynolds numbers of 20, 30, and 40. As shown, the peak mixing performance occurred when the EC ratio was α= 7/3 and Re = 20. This is because in a microchannel, with the increase in the Re numbers (Re > 20), the mixing uniformity increased gradually while the pressure drop in the microchannel increased sharply, resulting in a decrease in the mixing performance.
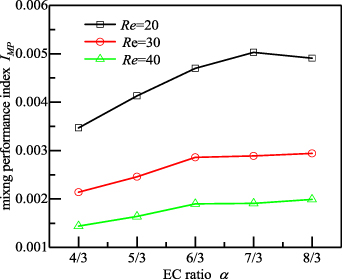
Figure 8. Mixing performance index in 3D-ECW microchannels with different EC ratios for Re = 20, 30, and 40.
Download figure:
Standard image High-resolution imageFigure 9 shows the velocity streamline diagrams of the 3D-ECW microchannel with EC ratio of 7/3. Figure 9(a) shows the velocity vector diagram on the y–z sections at corners of the microchannel (S1–S4 in figure 9). As the Reynolds numbers increased, the Dean flow phenomenon on the cross sections became increasingly obvious. The colours in figure 9(a) represent the concentration distribution of species in the microchannel. Figure 9(b) shows that when Re = 0.5, the streamlines of two species did not interfere with each other, and the diffusion mixing of species only occurred on the contact surface. When Re = 10, the streamlines appeared staggered and turbulent. In contrast, for Re = 20, the chaotic convection of the two species was obvious, and this greatly improved the mixing efficiency.
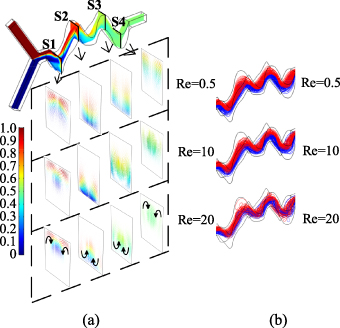
Figure 9. Streamlines of the velocity field at different Reynolds numbers in the 3D-ECW microchannel with an EC ratio of 7/3. (a) Velocity vector diagram in the y–z plane. (b) Velocity streamline of two species.
Download figure:
Standard image High-resolution image4.2. Fabrication of the 3D-ECW micromixer
Figure 10 shows the structure of the 3D-ECW micromixer with an EC ratio of 7/3. Figure 10(a) shows the schematic of the micromixer, in which A represents the feed area, from where baicalein solution and buffer were pushed into the micromixer using a dual channel syringe pump. B represents the microchannel where the species were mixed efficiently, C represents the electrochemical detection area where the screen-printed electrode was integrated with hot melt glue, and D represents the discharge area. The micromixer was printed through the DPL technology using a high-temperature-resistant resin material. The printed sample is shown in figure 10(b). Before the micromixer was used, the microchannel was made hydrophilic by using a piranha solution to avoid air bubbles remaining in the detection area and interfering with the detection.
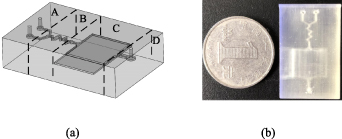
Figure 10. Structure of the 3D-ECW micromixer with an EC ratio of 7/3. (a) Schematic diagram. (b) 3D printed sample.
Download figure:
Standard image High-resolution image4.3. Experimental section
4.3.1. Redox curve of baicalein.
The redox curve of baicalein is shown in figure 11. Curve (a) in figure 11 was detected through SPCEs in the blank BR buffer (pH 2.5), and curve (b) shows the redox curve of the 1.184 × 10⁻⁴ mol l−1 baicalein solution mixed with BR buffer (pH 2.5). As shown, the substances in the BR buffer solution did not affect the CV behaviour of baicalein. Because the baicalein oxide on the electrode flowed out of the detection area with the fluid, the reduction peak was not observed, and therefore the oxidation peak was the object of research in the subsequent experiments.
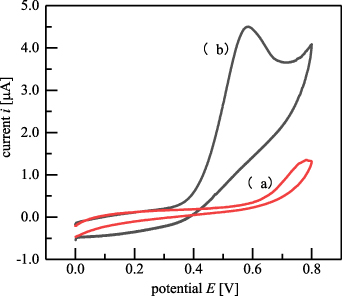
Figure 11. Redox curves of (a) a blank BR buffer and (b) baicalein in BR buffer.
Download figure:
Standard image High-resolution imageThe SPCEs activation method: First, scan 0.25 mol l−1 sodium bicarbonate solution for 300 s by using the amperometric i–t method with 2 V scanning potential. Then, scan the 0.1 mol l−1 dilute sulphuric acid circles (40) by using the CV method to remove impurities on the electrode surfaces. This activation method could enhance electrode reversibility, increase electron transfer speed, and promote electrode activity.
4.3.2. Effect of buffer varieties on oxidation peak currents.
In the baicalein solution with a concentration of 1.184 × 10⁻⁴ mol l−1, the influences of buffer varieties, including BR, CBS and PBS buffers in the pH range of 2.5–7 on the oxidation peak currents of baicalein were studied. The optimal result for each buffer solution is shown in figure 12. The highest oxidation peak current of baicalein for all three buffers appeared at pH = 2.5. Among the three buffers, baicalein showed the optimum redox peak current in the BR buffer at pH of 2.5.
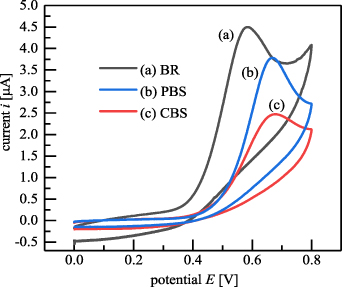
Figure 12. Effect of buffer varieties on oxidation peak currents of baicalein: (a) BR buffer, (b) PBS buffer, and (c) CBS buffer.
Download figure:
Standard image High-resolution image4.3.3. Effect of the pH of the BR buffer on the oxidation peak potentials.
Figure 13 shows the effect of the pH of the BR buffer on the redox curves of baicalein. As shown in figure 13(a), for the pH values of 2.5, 3, 4, 5, 6, and 7 of the BR buffer, the oxidation peak potentials gradually decreased with increase in the pH value, and the peak current reached its maximum value at the pH of 2.5. As shown in figure 13(b), the oxidation peak potentials of baicalein were linearly related to the pH values;  (R2= 0.9923). The slope of 56.07 mV pH−1 is close to the theoretical Nernst equation slope of 59.2 mV pH−1. Therefore, we can conclude that the number of electrons involved in the reaction of the electrode oxidation process was equal to the number of protons.
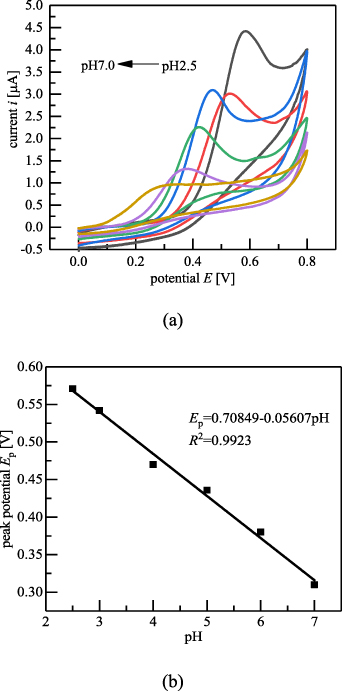
Figure 13. Effect of pH values of BR buffer on the redox curves of baicalein. (a) Redox curves of baicalein at different pH values in BR buffer. (b) Relationship between oxidation peak potential of baicalein and pH.
Download figure:
Standard image High-resolution image4.3.4. Effect of scanning speed on oxidation peak currents.
Figure 14 shows the effect of the scanning speed on the redox curves of baicalein. As shown in figure 14(a), with increasing scanning speeds of 50 mV s−1, 80 mV s−1, 100 mV s−1, 130 mV s−1, 150 mV s−1, 170 mV s−1, and 200 mV s−1, the oxidation peak currents increased. These peak current values and scanning speeds are linearly related, as shown in figure 14(b). The linear regression equation is given as  (R2 = 0.99333). Therefore, we conclude that the electrode reaction process is mainly controlled by adsorption.

Figure 14. Effect of scanning speeds on the redox curves of baicalein. (a) Redox curves of baicalein at different scanning speeds. (b) Relationship between oxidation peak currents and scanning speeds.
Download figure:
Standard image High-resolution image4.3.5. Effect of inlet flow rates on oxidation peak currents.
To investigate the influence of the inlet flow rates on the oxidation peak currents of baicalein, we analysed the rates in the range of 100 μl min−1 and 1500 μl min−1, as shown in figure 15. With an increase in the inlet flow rates, the oxidation peak currents first increased and then decreased. For the inlet flow rate of 960 μl min−1, the peak current reached its maximum value, and the corresponding Reynolds number was Re = 20. In the micromixer, the inlet flow rate showed a significant influence on the mixing uniformity. As the inlet flow rates increased in the range of 100 μl min−1 and 960 μl min−1, the peak currents increased significantly. When the inlet flow rate was higher than 960 μl min−1, the peak current decreased; this may be because the flow rates were too fast, thus reducing the residence time of the reagents. The reagents were not mixed perfectly because of insufficient contact; this might have led to the decrease in peak currents. For the inlet flow rate of 960 μl min−1, the residence time of the reagents in the microchannel was less than 200 ms, and thus a millisecond-level micromixing of reagents was realised; this is beneficial for rapid detection and reduced sample consumption.
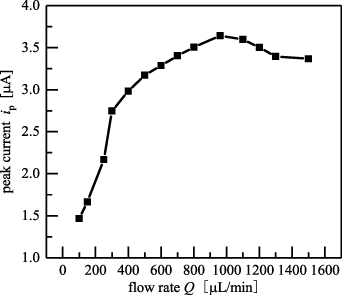
Figure 15. Effect of inlet flow rates on oxidation peak currents.
Download figure:
Standard image High-resolution image4.3.6. Calibration plot and limit of detection.
A series of baicalein solutions with different concentrations were prepared and the baicalein content was determined through the CV method under the conditions of 2.5 pH of the BR buffer, scanning speed of 100 mV s−1, and inlet flow rate of 960 μl min−1. As shown in figure 16(a), the oxidation peak currents increased with the increase in baicalein concentration. Figure 16(b) shows that the oxidation peak current had a good linear relationship with the baicalein concentration in the range of 3.55 × 10⁻⁶ mol l−1 and 5.92 × 10⁻⁵ mol l−1, with the linear equation of  (R2 = 0.99711) and the detection limit of 1.861 × 10⁻⁸ mol l−1( S/N = 3).
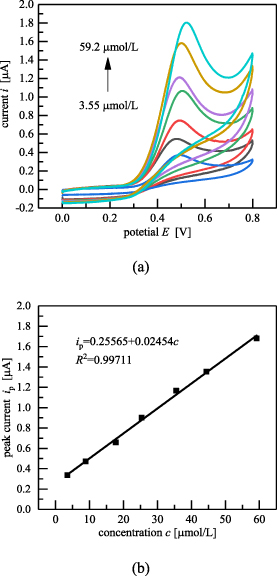
Figure 16. Calibration curve of baicalein. (a) Redox curves of baicalein with different concentrations. (b) Relationship between oxidation peak currents and concentrations of baicalein solution.
Download figure:
Standard image High-resolution image4.3.7. Reproducibility and stability.
Under the appropriate experimental conditions, as mentioned in section 4.3.6, the reproducibility and stability of the detection system were determined. The detection of the baicalein solution with a concentration of 7.104 × 10⁻⁶ mol l−1 was measured five times, and the relative standard deviation of the oxidation currents was measured as 2.86%, indicating that the detection method had good reproducibility. The detection system was used to detect the baicalein solution with a concentration of 7.104 × 10⁻⁶ mol l−1 after the device was stored in a dark place at room temperature for 1 week. The relative standard deviation of the oxidation peak current was 4.15%, indicating that the new detection method has good stability.
4.3.8. Determination of baicalein in real samples.
To evaluate the application of the micromixing electrochemical detection system, it was used to determine the baicalein solution extracted from baicalein Al capsules. Before the determination, the spectrophotometry method was employed as a control method.
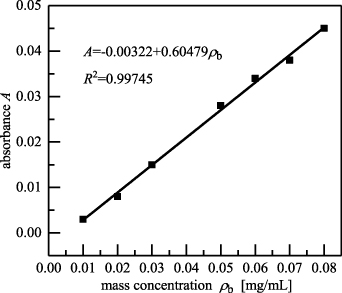
A series of baicalein solutions with different mass concentrations were detected through spectrophotometry. The absorbance of baicalein was linearly related to the mass concentration in the range of 0.01–0.08 mg ml−1. The linear equation is written as  (R2
= 0.99745), as shown in figure 17. The baicalein solution extracted from the baicalein Al capsules was later detected through spectrophotometry. The results showed that the baicalein content in one capsule was 12.86 mg. The results of the sample recovery test are listed in table 2, and the recovery was in the range of 98.9%–103.6%, indicating that the detection results were reliable.
(R2
= 0.99745), as shown in figure 17. The baicalein solution extracted from the baicalein Al capsules was later detected through spectrophotometry. The results showed that the baicalein content in one capsule was 12.86 mg. The results of the sample recovery test are listed in table 2, and the recovery was in the range of 98.9%–103.6%, indicating that the detection results were reliable.
Figure 17. Calibration curve of baicalein detected through spectrophotometry.
Download figure:
Standard image High-resolution image
Table 2. Recoveries of baicalein through spectrophotometry.
| Sample | Baicalein added (mg) | Absorbance | Recovery |
|---|---|---|---|
| 1 | 0 | 0.009 | |
| 2 | 0.3 | 0.013 | 103.6% |
| 3 | 0.6 | 0.020 | 98.9% |
| 4 | 0.8 | 0.025 | 100.8% |
The extracted baicalein solution was then diluted 5000 times and tested using the CV method. The diluted sample concentration was measured at 9.489 μmol l−1, which can be converted to 12.82 mg of baicalein in one capsule. This value differs from the aforementioned results by 0.31%, confirming that the micromixing electrochemical method was effective, and the rapid and accurate detection of real baicalein samples was thus realised.
5. Conclusions
To achieve efficient and accurate detection of baicalein, a micromixing electrochemical detection system was proposed. The proposed 3D-ECW micromixer was initially designed to achieve a rapid and efficient mixing of reagents, and its mixing uniformity, pressure drop, and mixing performance influenced by the Reynolds number and structural parameters were studied using the COMSOL software. Then, the optimised 3D-ECW structure with an EC ratio of 7/3 was obtained, which could result in a high mixing uniformity and a relatively low pressure drop. This micromixer could realise a millisecond-level micromixing of reagents under the Reynolds number of 20. The micromixer was fabricated using the 3D printing technology, and a micromixing electrochemical detection system was established to achieve continuous operations of feeding, mixing, detecting, and discharging. The CV method was used to investigate the effects of buffer varieties, buffer pH values, scanning speeds, and inlet flow rates on the CV behaviours of baicalein to obtain the optimal experimental conditions. The CV-method-based detection of baicalein content in baicalein Al capsules differed by 0.31% from the results of spectrophotometry, indicating that this new method meets the demand for high-efficiency and high-precision detection of baicalein. This paper showed great application prospects of the micromixing electrochemical detection method in the determination of other flavonoids.
Acknowledgments
This work was supported by the National First-Class Discipline of Food Science and Engineering Construction Project (JUFSTR20180205), the Independent Research Project of Jiangsu Key Laboratory of Advanced Food Manufacturing Equipment and Technology (FMZ-202016), and the Postgraduate Research and Practice Innovation Program of Jiangsu Province (SJCX20-0758). The authors also wish to thank Professor Yu Liu for his technical support on the fabrication of micromixers.