

Abstract
Micro injection moulding has been demonstrated as one of the most efficient mass production technologies for manufacturing polymeric microfluidic devices, which have been widely used in life sciences, environmental and analytical fields and agro-food industries. However, the filling of micro features for typical microfluidic devices is complicated and not yet fully understood, which consequently restricts the chip development. In the present work, a microfluidic flow cytometer chip with essential high aspect ratio micro features was used as a typical model to study their filling process. Short-shot experiments and single factor experiments were performed to examine the filling progress of such features during the injection and packing stages of the micro injection moulding process. The influence of process parameters such as shot size, packing pressure, packing time and mould temperature were systematically monitored, characterised and correlated with 3D measurements and real response of the machine such as screw velocity and screw position. A combined melt flow and creep deformation model was proposed to explain the complex influence of process on replication. An approach of over-shot micro injection moulding was proposed and was shown to be effective at improving the replication quality of high aspect ratio micro features.
Export citation and abstract BibTeX RIS
1. Introduction
Injection moulding is one of the most common and important techniques in micro/nano manufacturing. The growing demand for micro systems and micro electromechanical systems (MEMS) has driven the trend towards miniature components and micro/nano features and micro injection moulding has proven to be a predominant technology for mass fabrication of polymer micro components and products with complex and high precision features. To date, micro injection moulding has been used successfully in diverse fields such as optics [1, 2], chemistry, mechanics, electronics and bio-engineering, including microfluidics [3]. In the last two decades, the study of microfluidics has been playing an extraordinary role for molecular detection [4], analysis and separation [5], drug delivery [6] and other bio-scientific aspects. These so-called lab-on-a-chip and micro total analysis systems can reduce the cost, complexity and sample volume and can provide more accurate diagnostic information than larger conventional systems. However, various crucial subcomponents in microfluidic chips such as micro channels and in-channel protruding arrays for separation may require high aspect ratio features. This means that the structural integrity of microfluidic chips is highly dependent on the successful replication of high aspect ratio features.
Although the processes in injection moulding and micro injection moulding are similar, the filling of micro featured cavities is more complex and difficult than that of larger sizes using conventional injection moulding, and technological limits exist in micro injection moulding when replicating high aspect ratio features [7]. Attempts had been made to establish analytical models to provide relationships between the processing parameters and the filling distance to estimate the filling of different microstructures [8]. Meanwhile, various studies have been conducted regarding the filling of micro features including high aspect ratio ones using indicators and methodologies such as short shots [9], flow visualisation [10], flow length [11] and weld lines [12] with variations in material and process parameters. So far, mould design, gate design, injection velocity, packing pressure, mould temperature and melt temperature [2, 13–17] have been investigated to improve the filling of high aspect ratio features. Despite discrepancies in terms of the flow front profile and the filling depth between simulation and experiments, injection velocity, feature width and mould temperature were shown to be important for mould filling [18]. Su et al identified mould temperature as the key factor that determines the quality of injection-moulded micro structures using both simulation and experiments [19]. Xu et al concluded that the injection stage and the packing stage both contribute to the filling of the micro channel, while the holding stage is not important [20]. Moreover, short shot experiments and numerical methods were used to determine that the cross-sectional shapes of the micro features had an influence on the filled length due to the heat transfer and pressure drop variation, and layouts of the micro features were proven to have an effect on the filled length and the surface morphology [21]. Although considerable work has been done to analyse the influence of the factors from process settings, feature geometry, feature layout, mould design, etc on the replication quality, which is typically filling height or length, the filling process of an individual feature is still not completely understood. Additionally, most of the studies to date have focused more on the experimental replication of generic ridges and cantilevers, and cylindrical and conical arrays rather than on production features.
In the present work, the filling behaviour for a high aspect ratio micro feature was analysed based on correlation of machine settings, real response of the machine and the filling process of the micro feature. Short-shot experiments were performed in the first place, and the filling of microfluidic chips were compared by observing macro substrate filling and micro feature filling. Then, the packing process was introduced with various mould temperatures to study the continuous flow of material into micro cavities. By process monitoring and measuring high aspect ratio micro features in a 3D manner, the evolution of material flow in such geometries was revealed and correlated with process setting and machine response. In order to understand the complex filling behaviour of micro features, a combined melt flow and creep deformation model was proposed based on our experimental results. On the basis of this understanding, a process optimisation strategy was suggested to replicate this micro feature and had been proven to be effective.
2. Experimental approach
2.1. Machine, mould and material
All experimental components were manufactured using a Fanuc Roboshot S-2000i 15B reciprocating injection moulding machine. In addition, a fast prototyping mould was developed for this study. The mould cavity was composed of a tool steel mould insert with an embedded nickel (Ni) mould tool insert assembled in a cassette mould, as shown in figure 1(a), with additional detail being provided in figure 1(b). The micro features on the surface were used to fabricate inverted channels for a microfluidic chip, all of which were 250 µm wide and 150 µm deep for the parts that had rectangular cross-sectional areas. As indicated in the lower schematic drawing of the chip in figure 1(b), the horizontal channel worked as a fluidic channel, in which biological particles, such as cells, were focused by sheath flow from side inlets. Meanwhile, an optical fiber was integrated into the microfluidic chip using tilted channels. One channel was used for a fiber laser excitation beam and the other two were allocated for detection of forward scattering and side/fluorescence scattering by fibers. In order to minimise light intensity reduction of the excitation laser and to decrease potential scattering when the laser beam passes through plastic material, the distance between the fluidic channel and optical fiber channels had to be as small as possible. This requirement necessitates high aspect ratio features, as shown in the upper image in figure 1(b). The protruding features demonstrated a gradual aspect ratio, and the highest ones were at the places between the edge and the fluid channel, which had an aspect ratio of 3:1 nominally; it is these that were mainly investigated in this present research. In theory, the high aspect ratio feature should fill more easily under such a layout because that the gate was parallel to the feature of interest [22]. The manufactured chip has an area of 26.12 mm × 26.12 mm and a thickness of 1.05 mm.
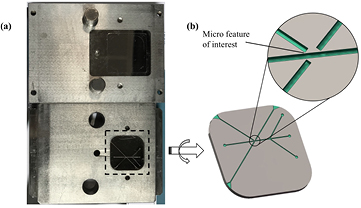
Figure 1. Mould cavity and mould insert features: (a) mould cavity, (b) features on the chip including those of high aspect ratio.
Download figure:
Standard image High-resolution imageIn terms of fabricating the mould tool insert, standard UV-LIGA and DRIE processes were used to transfer relatively high aspect ratio features onto a silicon (Si) master, as shown in figure 2 [23]. A Ni layer of approximately 300 µm thickness was electrochemically deposited onto the substrate in a bespoke nickel bath using a well-defined recipe. Afterwards, the Si substrate was totally removed by wet etching with potassium hydroxide (KOH) at 82.8 °C. CNC milling was then used to dice the Ni wafer into the dimensions of the mould insert and the uneven back surface was polished using SiC polishing paper. In order to heat the mould to a certain degree, four heating rods that were controlled by a heater were adopted. Specifically, two rods were inside the fixed plate, with the other two being inside the moving plate near the mould cavity. TOPAS (5013 Grade) cyclic olefin copolymer (COC) was used as the moulding material.
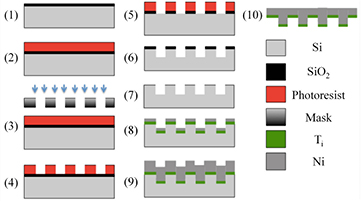
Figure 2. Process chains for the manufacturing of Ni using UV-LIGA process: (1) Si oxidation, (2) spin coating photoresist, (3) UV lithography, (4) development, (5) etching SiO2 and removing photoresist, (6) RIE etching of Si, (7) PVD coating Ti and Ni, (8) electroplating, (9) Si dissolving, (10) Ni wafer dicing and polishing.
Download figure:
Standard image High-resolution imageA Kistler CoMo injection process monitoring system (2869B) was used for data acquisition and process monitoring (figure 3), the details of which were described in previous work [24]. Screw position and screw velocity were acquired by CoMo and subsequently delivered to a computer via Ethernet. The injection signals from the injection moulding machine were used to trigger the CoMo monitoring system in order to ensure that all signals were received simultaneously. As shown in figure 4, larger screw position represented further distance between the nozzle and the screw, which indicated that more polymer would be injected during the process.

Figure 3. Process monitoring.
Download figure:
Standard image High-resolution image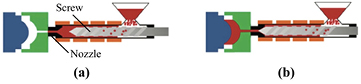
Figure 4. The role of screw position: (a) the end of plasticisation, (b) polymer injection.
Download figure:
Standard image High-resolution image2.2. Experimental design
After several dozen preliminary trials to consider variations in shot size, packing pressure, packing time and so on, the experiments were designed with the process parameters as listed in table 1. Because replication of the micro feature of interest was observed to be unsatisfactory when using low values of injection velocity during preliminary trials, a fixed high injection velocity (with the machine's upper limit being 525 mm s−1) was used to reduce the polymer's viscosity and cooling rate during the injection stage, thereby largely preventing the formation of the premature solidified skin layer. In the first stage, short-shot experiments were conducted, which served as the basis to validate the filling of macroscale microfluidic chips and to examine the preliminary filling of high aspect ratio features. It was quite apparent that packing was of vital importance to the filling of micro structures [25], and the packing stage was included during the second phase using a one factor at a time method, where packing pressure and packing time represented the factors, respectively. Meanwhile, V-P position was modified according to the change in shot size to ensure comparability. Finally, the third stage was considered as an over-shot experiment.
Table 1. Process parameters for all stages of experiments.
| Stage | Injection velocity (mm s−1) | Shot size (mm) | Packing pressure (MPa) | Packing time (s) | Nominal mould temperature (°C) |
|---|---|---|---|---|---|
| 1 | 450 | 5–9.4 | NA | NA | 130 |
| 2 | 450 | 15.4 | 30, 42.5, 55, 67.5, 80 | 4 | 130, 140, 150, 160 |
| 80 | 1, 2, 3, 4, 5 | ||||
| 3 | 450 | 16.2–20.2 | 80 | 5 | 150 |
In terms of all experiments during these three stages, at least three samples were collected under every combination of parameters, excluding the first two parts manufactured after changing the parameters each time and other parts influenced by unexpected factors, which means that at least five chips were made with each set of parameters.
2.3. Measurements
A Keyence digital microscope (VHX-5000) was used to obtain profile measurements. The locality of interest (as shown in figure 1) on each valid sample was examined at a magnification of 500 times with the functions of depth composition and 3D display. As a consequence, a 3D image within the field of view could be acquired, as shown in figure 5(a). After 3D tilt correction was performed, a profile line (the blue line in figure 5(c)) used to create a reference plane was drawn across the feature to examine the filling. The line was located in the gap area, namely the area where the melt from both sides of the feature met. Moreover, the profile line was vertical to the edge of the micro channel. Then, a cross-sectional profile could be derived from the intersection of the 3D image and the reference plane, as shown in figure 5(d). In order to quantify the filling condition from different perspectives, two parameters were defined to facilitate the interpretation of the filling process and the comparison between different samples, namely, cross-sectional area and cross-sectional height. Based on the cross-sectional profile, cross-sectional area referred to the integral along the profile line with the upper and lower limits being set at the edges of the high aspect ratio feature. For example, as figure 5(c) illustrated, the line in the middle was the profile line and the two red dots on the line were upper and lower bounds, respectively. Cross-sectional height was defined as the vertical distance between the highest area on the profile line and the bottom of the micro channels, which could also be seen as the lowest area on the profile line. Consequently, any increase of cross-sectional area and cross-sectional height indicated better filling of the area. In order to make sure that the results were comparable, all the profile lines were drawn where the weld line formed and the positions of all the boundaries were located in nominally the same place, as illustrated typically in figure 5(c). If such a place could not be ascertained, the lines were drawn to be at the lowest place within the area because prior assessment was made by moving the profile vertically to the edge of the lower micro channel as in figure 5(c), and this showed that the weld line was the place where the micro feature was replicated the least.
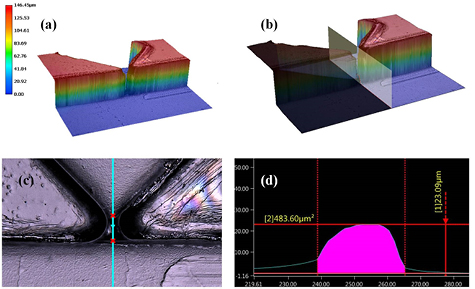
Figure 5. Profile measurement scheme: (a) 3D image, (b) intersection between 3D image and the reference plane, (c) plane graph composed of the locality and profile line, (d) profile line along with the measured cross-sectional area and height.
Download figure:
Standard image High-resolution imageTo establish the criterion for replication from the mould insert, polydimethylsiloxane (PDMS) was used to fill the mould cavity. As a result, three PDMS pieces with the micro channels on the surface could be acquired. After measuring the features on the PDMS pieces with the aforementioned methods, the numerical benchmark to determine when the area was filled up for cross-sectional area and cross-sectional height are 4684.45 ± 105.08 µm2 and 135.56 ± 2.35 µm, respectively.
3. Results and discussion
3.1. Filling of the macroscale microfluidic chip and the micro feature during the injection stage
With the conditions in short-shot experiments, the macroscale chip mould cavity was filled up for the first time when the shot size reached 9.4 mm. Images of the macroscale chips with shot size ranging from 6.2 mm to 9.4 mm (9 groups) were compared with each other in figure 6. The part was gradually filled with the increase of shot size and the filling of micro features was examined during the injection stage.
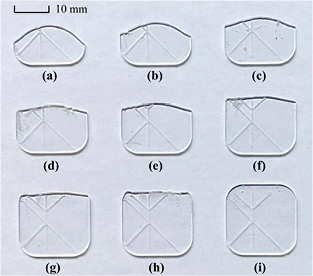
Figure 6. Images of macroscale chips by short-shots with different shot sizes: (a) 6.2 mm, (b) 6.6 mm, (c) 7 mm, (d) 7.4 mm, (e) 7.8 mm, (f) 8.2 mm, (g) 8.6 mm, (h) 9 mm, (i) 9.4 mm.
Download figure:
Standard image High-resolution imageAs for micro features, 3D images of the area of interest with this shot size range are illustrated in figure 7, corresponding to each one of figure 6 in the same order from a macroscale perspective. It could be seen that the area of the high aspect ratio feature of interest gradually came into shape when the shot size was larger than 7 mm. Hence, values of cross-sectional area and cross-sectional height could be measured directly, as summarised in figure 8.

Figure 7. 3D images of the high aspect ratio feature as shot size increased. (a) Shot size equaled 6.2 mm, (b) 6.6 mm, (c) 7 mm, (d) 7.4 mm, (e) 7.8 mm, (f) 8.2 mm, (g) 8.6 mm, (h) 9 mm, (i) 9.4 mm.
Download figure:
Standard image High-resolution image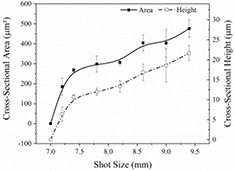
Figure 8. Development of cross-sectional area and cross-sectional height with the increase of shot size in short-shot experiments.
Download figure:
Standard image High-resolution imageAs figure 7 showed, the gap was not filled in a homogeneous way. It was noticed that the melt tended to fill the less resistant areas, which corresponded to the hesitation phenomenon [26]. The pressure inside the cavity was relatively small during the injection stage, which was much lower than the pressure needed for the highest aspect ratio locality. Meanwhile, either side across the gap became bigger relatively evenly along the slope before the shot size reached 7 mm; when both sides met from the bottom (shot size larger than 7 mm), the upper melt gathered quicker than at the bottom, which was similar to the process of transferring from 'V-shape' to 'U-shape'. The slopes decreased significantly in figure 8 after the shot size reached 7.4 mm, which was consistent with this trend. However, the gap with the high aspect ratio area was far from completely filled, even with the shot size being 9.4 mm when the macroscale chip mould cavity was filled up for the first time. As a result, the injection stage alone only contributed to part of the filling of such a micro feature, and measures including packing should be taken to further facilitate filling of the micro area.
3.2. Filling progress of the micro feature during the packing stage
During the packing stage, packing pressure and packing time could potentially influence cavity pressure and the time for how long pressure was applied. Additionally, mould temperature significantly influenced the gate solidification time and determined whether it was or was not effective for packing pressure and packing time to contribute to the filling of micro features.
3.2.1. Effect of packing pressure on the filling of the micro feature.
Figures 9 and 10 depict the comparison of cross-sectional area and cross-sectional height respectively when packing pressure served as the factor. Different curves were established with different nominal mould temperatures. Typical 3D images of the area of interest when the nominal mould temperature was 150 °C are shown in figure 11. It can be seen from figures 9 and 10 that packing pressure influenced the filling of the micro feature in dissimilar ways under different nominal mould temperatures, which meant that it was also necessary to investigate the nominal mould temperature. It should be mentioned that the standard deviation of cross-sectional area and cross-sectional height for the curve 130 °C was much higher, which indicated the existence of process variation. The general trend should only be taken as a reference. As seen in figures 9 and 10, when the nominal mould temperature was between 140 °C and 160 °C and compared to the little influence shown on cross-sectional area and cross-sectional height from packing pressures between 30 MPa and 67.5 MPa, clear evidence of growth was seen when packing pressure was larger than 67.5 MPa. In order to understand this trend, the evolution of screw velocity and screw position with the increase of packing pressure was studied.
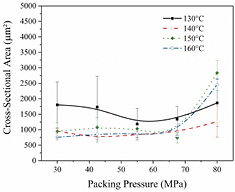
Figure 9. Development of cross-sectional area as packing pressure varied.
Download figure:
Standard image High-resolution image
Figure 10. Development of cross-sectional height as packing pressure varied.
Download figure:
Standard image High-resolution image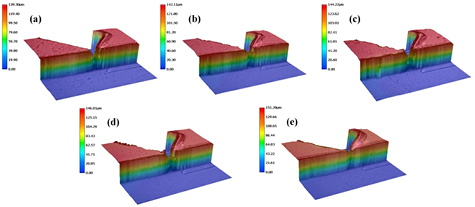
Figure 11. 3D images of the high aspect ratio feature under 150 °C. (a) Packing pressure was 30 MPa, (b) 42.5 MPa, (c) 55 MPa, (d) 67.5 MPa, (e) 80 MPa.
Download figure:
Standard image High-resolution imageFigure 12 shows the screw velocity and screw position versus time for the 30 MPa and 80 MPa groups at 150 °C, and three points were defined for further assessment: point A was the peak screw velocity during the injection stage, point B was the peak screw velocity during the packing stage and point C was the screw position at a time of one second after injection. Point A normally represented the time when the V–P (velocity control to pressure control from the injection stage to the packing stage) transition started, which indicated that the screw would be controlled by pressure; B marked where the transition to the packing stage was completed and packing pressure started taking effect. It was seen that both screw velocity and screw position under 30 MPa and 80 MPa during injection stage agreed well with each other. The screw position at 1 s, which could be referred to as cushion size, was chosen after observing all process curves to assess material being pushed into the mould (figure 4).
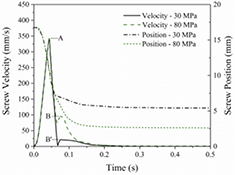
Figure 12. Typical screw velocity and screw position curves with packing pressure as 30 MPa and 80 MPa.
Download figure:
Standard image High-resolution imageAs shown in figure 12, the maximum screw velocity was less than 350 mm s−1, whereas the nominal value was 450 mm s−1. That was related to the injection moulding machine's dynamic response. Values for the three points related to different conditions were shown in figure 13, where 130 °C and 150 °C were mainly examined. The machine conditions were practically identical for these two groups: the maximum screw velocities during the injection stage were almost the same; the peak screw velocities during the packing stage increased and the screw position at 1 s decreased as packing pressure increased. Hence, the screw was running in a regular way. When the nominal mould temperature was lower (130 °C), the gate tended to solidify shortly after the macroscale mould cavity was filled, so packing pressure could not affect the filling condition much. However, when the nominal mould temperature was higher (140 °C–160 °C), the melt froze slower; creep deformation could happen when packing pressure was large enough to compress more melt into the cavity [27]. As a result, the cross-sectional area and cross-sectional height could be increased dramatically when packing pressure was larger than 67.5 MPa.

Figure 13. Values of points A (maximum screw velocity during the injection stage), B (maximum screw velocity during the packing stage) and C (screw position at 1 s) as packing pressure changed.
Download figure:
Standard image High-resolution imageThe best filling condition in this section appeared with the packing pressure and nominal mould temperature being 80 MPa and 150 °C respectively as shown in figure 11(e). Nevertheless, it only reached 60.60% of the cross-sectional area criterion and 77.70% of the cross-sectional height criterion, which is not acceptable for practical applications.
3.2.2. Effect of packing time on the filling of the micro feature.
The comparison of cross-sectional area and cross-sectional height when packing time served as the factor was illustrated in figures 14 and 15, respectively. Different curves represented different nominal mould temperatures. Though some points for the 130 °C and 140 ºC tests had larger standard deviations, the overall evolution is clear. The screw velocities and screw positions at points B and C are shown in figure 16 when the nominal mould temperatures ranged from 130 °C to 150 °C. Due to the similarity in the maximum screw velocity during the injection stage (point A), which was 343.31 ± 1.44 mm s−1, the values were not included.

Figure 14. Development of cross-sectional area when packing time changed.
Download figure:
Standard image High-resolution image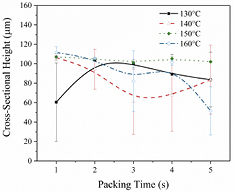
Figure 15. Development of cross-sectional height when packing time changed.
Download figure:
Standard image High-resolution image
Figure 16. Values of point B and point C relative to various packing time.
Download figure:
Standard image High-resolution imageIt can be discerned that the maximum screw velocity during the packing stage (B) generally deceased as packing time increased for each nominal mould temperature, except for 5 s under 140 °C. But no obvious differences in screw position (C) were observed. This implied that, although the screw eventually moved to similar positions under the same packing pressure, when packing time was set to be longer, the screw tended to move more slowly at the time when the packing stage was set during these experiments. It could be seen as the pace for packing was different when packing time changed. However, lower screw velocity (B) leads to lower pressure and less material filling in the micro feature. Consequently, undesirable trends can be seen at 140 °C and 160 °C as the packing time was extended. It is worth mentioning that the maximum screw velocities during the packing stage at 150 °C remained at a relatively high level, which contributed to better filling conditions and facilitated creep deformation with melt that would freeze more slowly with a higher nominal mould temperature.
After the best filling condition (1 s; 160 °C) was identified and evaluated, it was found that it only reached 70.67% of the cross-sectional area criterion and 82.30% of the cross-sectional height criterion, which is still not suitable for practical applications.
3.2.3. Effect of nominal mould temperature on the filling of the micro feature.
Figure 17 showed how the cross-sectional area and cross-sectional height developed when nominal mould temperature served as the factor under different packing pressures. The packing time was fixed at 4 s. The maximum screw velocity during the packing stage (point B) and screw position at 1 s (point C) were depicted in figure 18. Similarly, the maximum screw velocity during the injection stage was 343.30 ± 1.07 mm s−1 and was not included in this figure.

Figure 17. Development of cross-sectional area and cross-sectional height relative to different nominal mould temperatures (30 MPa, 55 MPa or 80 MPa for packing pressure, 4 s for packing time).
Download figure:
Standard image High-resolution image
Figure 18. Values of point B and point C as nominal mould temperature altered (30 MPa, 55 MPa or 80 MPa for packing pressure, 4 s for packing time).
Download figure:
Standard image High-resolution imageWhen smaller packing pressures were employed, such as 30 MPa, 42.5 MPa or 55 MPa, the 130 °C temperature generally was the best setting for replication. In view of the fact that no obvious deviation was observed in figure 18, the phenomenon could be explained in terms of the polymer's PVT properties and the pressure and temperature variation in the mould cavity. The glass transition temperature for this material is about 134 ºC, so most of the measured replication was achieved during the injection stage when the nominal mould temperature was 130 °C–140 °C. Moreover, the cavity pressure was reduced as cavity temperature was elevated (when nominal mould temperature was 140 °C–160 °C) especially during the injection stage and neither the reduced pressure nor the lower packing pressure was sufficient to fill the micro structure well. However, when the packing pressure was increased from 67.5 MPa to 80 MPa, an apparent improvement in replication was found when a high nominal mould temperature such as 150 °C or 160 °C was used. When nominal mould temperature increased, the melt froze more slowly when it filled in the cavity; though cavity pressure might be lower during the injection stage, higher packing pressure could contribute to further filling by pushing material towards the micro feature. Hence, the micro feature was probably composed of filling during the injection stage and creep deformation during the packing stage. When the nominal mould temperature and packing pressure were higher, creep deformation contributed more to the replication.
The development of cross-sectional area and cross-sectional height when nominal mould temperature served as the factor under different packing time conditions was illustrated in figure 19, with the packing pressure being fixed at 80 MPa. The maximum screw velocity during the injection stage was 342.91 ± 1.68 mm s−1, and the maximum screw velocities at point B and screw positions at point C were depicted in figure 20.
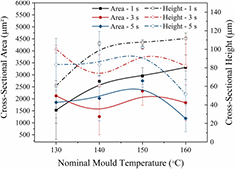
Figure 19. Development of cross-sectional area and cross-sectional height relative to different nominal mould temperatures (1 s, 3 s, 5 s for packing time, 80 MPa for packing pressure).
Download figure:
Standard image High-resolution image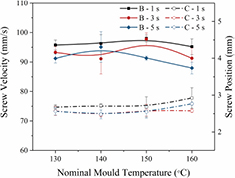
Figure 20. Values of point B and point C as nominal mould temperature altered (1 s, 3 s, 5 s for packing time, 80 MPa for packing pressure).
Download figure:
Standard image High-resolution imageWhen packing time was 1 s, despite the fact that little difference was observed in maximum screw velocities during the packing stage (figure 20) and the value of screw position at 160 °C was higher, a major improvement of the replication could be seen as temperature changed (figure 19). This was attributed to the generally higher screw velocities and more desirable fluidity of melt under higher nominal mould temperatures. Meanwhile, the maximum screw velocities generally declined with the extension of packing time (3 s–5 s) and the development agreed well with the overall replication shown in figure 19. Moreover, the three sets of curves in figure 20 represented different combinations of variation in screw velocities and screw positions. The evident trend from 140 °C to 160 °C was taken as an example. When packing time was 1 s, curve B was steady with a little decrease and curve C eventually increased. The corresponding result has been discussed above. Then, as curve B—3 s was parabolic and curve C—3 s was stable, curve Area—3 s and curve Height—3 s match well with curve B—3 s. Finally, curve B—5 s dropped while curve C—5 s ascended, the values eventually decreased as shown by curve Area—5 s and curve Height—5 s. The consequences from these combinations imply that the screw velocity was much more vital to the replication under higher nominal mould temperatures, specifically the creep deformation during the packing stage.
3.3. Filling mechanism for micro features
As discussed in section 3.2, process parameters, such as packing pressure, packing time and nominal mould temperature, enabled a complex variation in replication of micro structures. The variation was related to the complex filling mechanism of micro features. The overall filling was ordinarily composed of two parts: melt flow during the injection stage and creep deformation during the packing stage. Figure 21 illustrated the scheme for this mechanism. At first, in the injection stage as shown in figure 21(a), the melt could flow into the micro feature as the flow front advanced until the macroscale substrate was filled up as illustrated in figure 21(b), despite the hesitation that could be observed. Meanwhile, the skin layer would gradually come into shape with heat being transferred to the mould. However, the filling of the micro feature was still insufficient. Then, packing pressure was applied as illustrated in figure 21(c), pushing melt that had not entirely solidified forward and into the micro cavity. Therefore, the skin layer at the micro feature would be compressed, which facilitated the melt's movement inside the micro feature for further filling. The creep deformation of the skin layer had been observed previously [13] from the morphology of a micro feature fabricated by micro injection moulding using polyether block amide (Pebax 7233 SA01). Such phenomena were also observed for amorphous COC 5013 L10 and semi-crystalline high-density polyethylene (HDPE HMA016), as shown in figure 22, where two cross-sectional planes on the 100 µm semi-circular ridge were observed by polarized light microscope. Clearly, the section of 100 µm semi-circular ridge feature that was close to the gate displayed curvature of the skin layer, while that at the end of part showed no curvature due to the lower pressure. This provided clear evidence that the combined stage melt flow and creep deformation dominated the micro feature's filling. Undoubtedly, creep deformation was associated with parameters such as material properties, nominal mould temperature, packing pressure and packing time, making material flow into a micro cavity in a rather complex method.
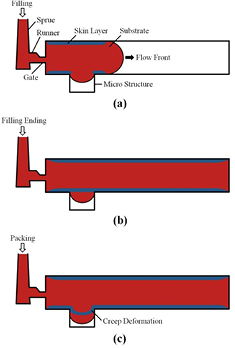
Figure 21. Filling mechanism of micro structure on a substrate. (a) The injection stage, (b) the end of the injection stage, (c) the packing stage.
Download figure:
Standard image High-resolution image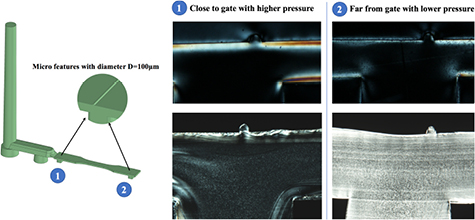
Figure 22. Evidence of creep deformation in the filling of micro features demonstrated using a tensile specimen with 100 µm semi-circular ridge features. (Features close to the gate showed clear deformation of the skin layer adjacent to the part surface, while features far away from the gate demonstrated less deformation, no matter which kind of material was used.)
Download figure:
Standard image High-resolution image3.4. Filling optimising using over-shots
Although high injection velocity and different packing pressure, packing time and nominal mould temperature values were adopted, the micro feature was not completely replicated. Considering the filling mechanism of the micro feature as discussed in section 3.3, increasing shot size to improve filling velocity and pressure in order to acquire desirable replication of the micro feature between the fluid channel and fiber channel was adopted. Since the nominal mould temperature and packing pressure were close to the limit of our current setup, the process parameters of stage 3 as summarised in table 1 were proposed. As shown in figure 23, when shot size increased, replication of the micro feature could be improved considerably. When shot size reached 20.2 mm, the high aspect ratio feature was visibly fully filled with ~94.10% of the cross-sectional area criterion (PDMS replica in figure 24(h)) and ~91.07% of the cross-sectional height one, which may be due to local deformation of the area of interest from demoulding. Furthermore, SEM was used to characterise the high aspect ratio feature under the best conditions in Stage 2 and Stage 3, which are 160 °C, 80 MPa and 1 s for Stage 2 and 20.2 mm for Stage 3, respectively, corresponding to table 1. As shown in figure 25, increasing shot size obviously optimises the replication, and the local deformation on the optimisation chip (figure 25(b)) can be compensated for by subsequent thermal bonding. Indeed, certain chips have already been used successfully after thermal bonding. However, increasing shot size can result in high pressure, requiring large clamping forces and generating high level of residual stress. Thus, such side effects do need to be considered for specific applications.
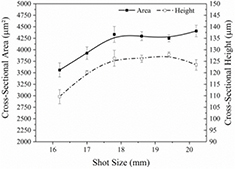
Figure 23. Development of cross-sectional area and cross-sectional height with the increase of shot size in over-shot experiments.
Download figure:
Standard image High-resolution image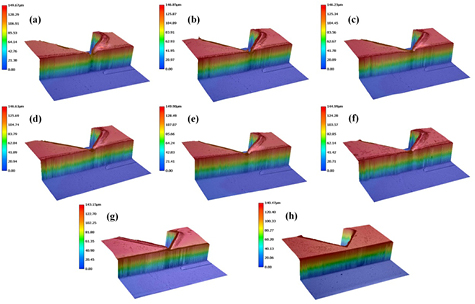
Figure 24. 3D images of the high aspect ratio feature with different shot sizes and PDMS replication. (a) Shot size: 15.4 mm, (b) 16.2 mm, (c) 17.0 mm, (d) 17.8 mm, (e) 18.6 mm, (f) 19.4 mm, (g) 20.2 mm, (h) PDMS reference part.
Download figure:
Standard image High-resolution image
Figure 25. SEM images of the high aspect ratio feature under the best conditions. (a) In stage 2 (conventional micro injection moulding), (b) in stage 3 (optimisation).
Download figure:
Standard image High-resolution image
4. Conclusions
Focusing on a high aspect ratio spacing feature that exists between a fluid channel and an optical fiber channel on a microfluidic flow cytometer chip, the progress of the feature's filling was revealed by means of using short-shot experiments and single factor experiments on packing pressure, packing time and nominal mould temperature combined with microscopy, process monitoring and morphology. It was found that the feature did not fully fill during the injection stage with an increase of shot size until after the macroscale chip was fully filled. During the packing stage, increasing packing pressure caused an increase in packing velocity and a smaller melt cushion, which led to better filling, while the extension of packing time decreased the packing velocity and resulted in less filling. Meanwhile, mould temperature manifested less influence on packing velocity and cushion size. However, no simple monotonic variation was observed for replication of the high aspect ratio spacing feature. As a result, a combined melt flow and creep deformation model was proposed to explain the complex filling behaviour of the micro feature. The overall filling of micro feature was composed of two phases: melt flow during the injection stage and creep deformation during the packing stage. Melt flow was related to injection velocity and pressure, while the extent of creep deformation was linked to mould temperature, packing pressure, packing time, etc. The complex filling behaviour of high aspect ratio spacing features was explained successfully with a combined melt flow and creep deformation model. Based on this, increasing shot size to improve replication quality of micro features was proposed and feature replication was significantly improved, sufficiently to satisfy the practical requirements of a microfluidic flow cytometer chip. Furthermore, the combined melt flow and creep deformation model explained the complicated and non-uniform process by which such micro features replicate; this is not thoroughly considered in current commercial simulation software. Future work will elucidate the coupled and dynamic filling process in order to provide more accurate simulations for products such as microfluidic chips and optical components.
Acknowledgments
The authors gratefully acknowledge support from China Scholarship Council, Science Foundation Ireland (SFI) (Grant Number 15/RP/B3208 and 14/IFB/2719) and National Science Foundation of China (Grant Number 61675149).