

Abstract
TianQin is a planned Chinese space-based gravitational wave (GW) observatory with a frequency band of 10−4–1 Hz. Optical telescopes are essential for the delivery of the measurement beam to support a precise distance measurement between pairs of proof masses. As the design is driven by the interferometric displacement sensitivity requirements, the stability control of optical path length (OPL) is extremely important beyond the traditional requirement of diffraction-limited imaging quality. The recurring tilt-to-length (TTL) coupling noise arises from the OPL variation due to the wavefront deformation and angular misalignment. Reducing the residual chief ray aberration in the optical design helps suppress TTL coupling noise. To correct the pupil aberrations, we derive primary pupil aberrations in a series expansion form, and then refine the formulation of merit function by combining the pupil aberration theory and traditional image aberration theory. The automatic correction of pupil aberrations is carried out by using the macro programming in the commercial optical software Zemax, leading to a high performance telescope design. The design results show that on one side the pupil aberrations have been corrected, and on the other side, its optical performance meets the requirements for TianQin project. The RMS wavefront error over the science field of view (FOV) is less than λ/200 and the maximum TTL coupling noise over the entire ±300 μrad FOV is 0.0152 nm µrad−1 . We believe that our design approach can be a good guide for the space telescope design in any other space-based GW detection project, as well as other similar optical systems.
Export citation and abstract BibTeX RIS
1. Introduction
The TianQin project is a space-borne gravitational waves (GWs) detector mission that operates in the millihertz frequency range [1–3]. The GWs observatory involves three spacecraft forming an equilateral triangle in a geocentric orbit in space, with arms approximately 105 km in length. Laser interferometry is used to monitor the distances between the test masses, where the signal to be obtained is the optical path length (OPL) between the transmitting transceiver system and the receiving transceiver system. The OPL signal from matching proof masses between different spacecrafts will correspond to the distortion of the equilateral triangle constellation caused by GWs, which is measured using well-known heterodyne interferometry techniques [4]. At the end of each arm, a space-borne telescope is equipped to expand and deliver the measurement beam to support precise distance measurements between pairs of proof masses. Since the afocal telescope serves for heterodyne interferometry detection, the design motivation and performance evaluation of the telescope is necessitated to differ from that of a traditional imaging system.
Afocal telescopes have been extensively studied in ongoing laser interferometer projects, such as LISA [5–10], DECIGO [11], Taiji [12, 13], and TianQin [14, 15]. The designs place great emphasis on addressing unusual requirements, including the scattered light, the wavefront quality, and OPL stability. The scattered light will introduce phase noise into the interferometric beat signal [16, 17]. The expected tolerable level of scattered noises should be roughly in line with the received signal power from the far spacecraft. To avoid Narcissus reflection, an off-axis configuration is employed in almost all current designs, as the main source of scattered light on the detector comes from the backward scattering of the transmitted beam. Achieving ultra-high wavefront quality is of great necessity to support precision metrology, with the optical design specifications of the telescope exceeding the diffraction limit. Additionally, the OPL stability requirement for the telescope necessitates that the wavefront over the field should be smooth enough to prevent jitters from changing the OPL to the far spacecraft. After years of exploration, the telescopes described in these literatures are usually far beyond the diffraction limit. Nonetheless, there is still considerable potential for improving the design of diffraction-limited telescopes for space-based GW detection, particularly with regard to the tilt-to-length (TTL) coupling noise performance.
The angular misalignments between the reference beam and measuring beam can directly change the OPL traveled by the measurement beam, leading to the phenomenon of TTL coupling noise [18, 19]. This coupling noise between the misalignments and the OPL readout is a significant noise source in precision interferometric length measurements. Therefore, a key goal in telescope design for space-based GW detection is to minimize or eliminate TTL coupling noise. Livas's group proposed that pupil aberrations could serve as a significant performance metric for the laser telescope in space GW detection and upgraded the design of LISA telescope by correcting pupil aberrations [10]. While preserving the wavefront performance, the correction of pupil aberrations has effectively minimized the field footprints wander. This revamped design demonstrates excellent TTL and wavefront error (WFE), and provides ample margin for component manufacturing and alignment.
The so called pupil aberrations can be defined as the aberrations observed at the exit pupil when an object is placed at the entrance pupil for an optical system [20–22]. LISA team adopts the Seidel aberration theory to assess the afocal telescope's pupil aberration performance by interchanging the roles of the marginal and chief rays in the image aberration formula [10, 23–26]. Figure 1 illustrates the imaging principle from the point P on the entrance pupil to the point Pʹon the exit pupil, where the chief ray determines the imaging position and the marginal ray decides the imaging height [21]. The 'pupil' for the conjugate system of both pupil planes is the image plane of normal imagery. However, due to the lack of mature tools for analyzing pupil aberration performance, the systematic design method based on performance metrics regarding to pupil aberrations are not adequately developed.

Figure 1. The function of the chief ray and marginal ray in pupil imaging.
Download figure:
Standard image High-resolution imageOur previous work about TianQin telescope design described wavefront aberration correction and related performance simulation, with no consideration on pupil aberrations [15]. The purpose of this paper is to present the recent development for the TianQin telescope design that specifically addresses the correction of pupil aberrations. An automated method based on the pupil aberration theory is developed for the development of an improved focusing reflective telescope, aimed at correcting pupil aberrations without compromising wavefront quality. This study comprehensively discusses the optimization strategy and method for correcting the pupil aberrations, which differs from conventional imaging systems in ways such as the definition of the field of view (FOV), the construction of the merit function, and the performance metric for evaluation. We also develop tools for pupil aberration correction using the macro programming in the commercial optical software Zemax. The proposed design method is utilized to improve the TianQin telescope design, and its feasibility and validity are demonstrated and verified.
2. Design specifications and special requirements
Table 1 lists the design specifications, which are derived from the requirements of TianQin project [14, 15] and other LISA-like missions [5–7, 10, 12, 13]. The working wavelength λ = 1064 nm is determined by the Nd:YAG laser used in the heterodyne interferometry Frequency and amplitude stabilization are the determining factors for this wavelength choice [22]. The design residual WFE is allocated from the total budget of the entire system, with the Strehl ratio as the performance metric. Although the correction of pupil aberrations is taken as the main design goal, the optical system still needs to reach the diffraction limit for the correction of wavefront aberrations. If the WFE ⩽λ/20 in the single link, the corresponding total Strehl ratio value is above 0.8, which is generally considered the threshold for achieving the diffraction limit [27]. Large afocal magnification and the aperture are chosen to provide guarantees for efficient power transfer. The field of regard (FOR) is determined by the selected acquisition time, arm length, and orbit, and represents the FOV that the valid link can be established to acquire initial pointing signal [5]. The science FOV represents the angular range that the complete GW measurement can be carried out, considering the stability of orbit and pointing accuracy. The position of the entrance pupil is located in the test mass plane for the consideration of pupil aberrations. The TTL noise allocation derives from the OPL noise budget, and we expect that the differential change in OPL with angle can be as low as possible when the receiving beam passes through the afocal telescope.
Table 1. Specifications of the TianQin telescope.
| Parameter | Specification |
|---|---|
| Wavelength | 1064 nm |
| Wavefront quality (design residual) | ⩽λ/200 RMS@1064 nm |
| Acquisition FOR | ±200 μrad |
| Science FOV | ±7 μrad |
| Entrance pupil diameter | 220 mm |
| Stop location | Test mass plane |
| TTL noise | ⩽0.6 nm µrad−1 |
Correcting pupil aberrations involves several considerations. Although this is a geometric optics concept, it is necessary to analyze the effect of phase aberrations on the interferometry in the TianQin mission. Figure 2 shows the telescope's role in light transfer and heterodyne interferometry [4, 18, 28–30]. Based on the far-field propagation's diffraction calculating results, the measuring beam received by the telescope can be simplified as a plane wave [31]. In the simplest case, we assume that the wavefront deformation of the measured beam during interferometry originates solely from the WFE of the telescope. Although the object and the image are in the spaces at infinity, a finite entrance pupil plane can be imaged to a finite exit pupil plane. The tilted measuring beam is rotated on the pupil plane instead of image plane. Therefore, pupil aberrations in the form of wavefront aberration is a more insightful merit function to optimize OPL in an afocal system.

Figure 2. Simplified diagram shows the process where the measuring plane beam from another spacecraft is compressed to be a flat beam with aberrations caused by telescope, and then interfere with local reference Gaussian beam after passing the relay optical system.
Download figure:
Standard image High-resolution imageOn the other hand, when discussing system distortion, the transverse ray aberrations are usually chosen to evaluate the magnitude of aberrations. Figure 3 illustrates the pupil aberrations and reference Gaussian image points in an optical system. It is well-known that the image wavefront aberration, Wi, can be expanded as a power series [25]:
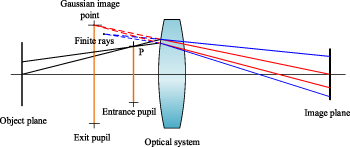
Figure 3. Geometric spot for pupil imaging. The blue lines depict the path of light when the lens is assumed to have perfect imaging capabilities, whereas the red lines illustrate the path of light when there are pupil aberrations. The aberrations are exaggerated for clarity.
Download figure:
Standard image High-resolution imageThe primary aberrations in an optical system are commonly represented by the five three-order terms with coefficients c1 to c5. The terms that only depends on the field, such as c6, d10..., are typically assumed to be zero, based on the assumption that wavefront aberrations should vanish in the center of the pupil [22]. Since this term is independent of pupil coordinates, it is typically ignored when differentiating the wavefront aberration with respect to xp and yp to derive the transverse ray aberrations. Nevertheless, the aberrations that only depends on the field can cause the OPL to change as the field coordinate of the characteristic rays, which contradicts our design goals [32].
Therefore, it makes sense to consider realizing pupil aberration correction to improve the design. In the following sections, we will introduce the study about correcting the primary pupil aberrations at the third-order level, and subsequently optimize the optical system variables and evaluate pupil aberrations with higher-order terms.
3. Primary pupil aberration
We wish to clarify the physical meaning of coordinate transformation of pupil aberration in the derivation under the geometric optical framework. The total aberrations can be computed as the sum of aberration contributions from various surfaces of the optical system.
Welford derived the optical path difference introduced at a single refracting surface, which is also applicable to pupil imaging [25]. As shown in figure 4, PA and PA1 are the radius of the reference sphere with the center at Gaussian image point P. Pʹ is the real image when the pupil aberrations are present. PA1 intersects the refracting surface at point B (0, y1, z1), and the extension of  B intersects the reference surface at point
  . The total wavefront aberration can be written as
  and we have
  = A1
B when the higher order aberrations are negligible in deriving the primary aberration [25, 26]. The Σ notation indicates the summation operator taken over all the refracting surfaces, and the
= A1
B when the higher order aberrations are negligible in deriving the primary aberration [25, 26]. The Σ notation indicates the summation operator taken over all the refracting surfaces, and the  signifies the incremental change in refraction. Then based on a simple geometric relationship, we obtain

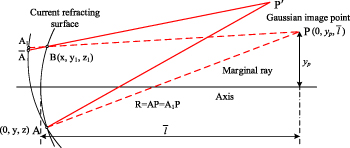
Figure 4. Diagram of OPL in a pupil imaging system.
Download figure:
Standard image High-resolution imagewhere PA and PB can be expressed as


where the  is the Gaussian conjugate distance and yp is the Gaussian image height in pupil imaging. Equation (4) can be expanded by the Taylor series, and we neglect the terms of order higher than four-order:
where z1 represents the sag of refracting surface. Let the radius of curvature of the surface be r, then according to geometric relations we obtain:

Solving the roots of the quadratic equation (6) and expanding it with the Taylor series we get

Substituting the equation (7) to equation (5), we have
By simple transformation using Lagrange invariants, yp in equation (8) can be substituted by paraxial quantities. Figure 5 depicts the configuration of pupil imaging and shows two characteristic rays along with some basic paraxial quantities. From this figure, we can infer that  , and we can further eliminate the aperture angle u from the expression and obtain:

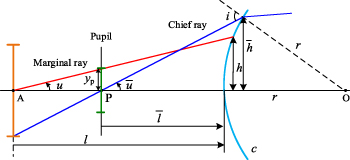
Figure 5. The derivation of paraxial invariants in a pupil imaging system. u,  : paraxial angles. h,
  : height of the traced ray at the refracting surface. yp: height of the marginal ray at pupil plane. l: distance of the axial object point to the refracting surface.
  : distance of the pupil to the refracting surface.
Download figure:
Standard image High-resolution imageIt can be seen that the paraxial angle of incidence, and from the Snell's law we can obtain

Each side of equation (10) is denoted by  , which is called the refraction invariant. Similarly, we can define another refraction invariant A for the marginal ray. Then we can use these invariants to define the paraxial quantity ho = y1 − y. This eliminates the y1 from the equation:

Substituting the expressions in equations (9) and (11) into equation (8) we can get
If we let x = 0 and y1 = y in equation (12), PA can be quickly acquired as

Now, by subtracting the equation (12) from equation (13), we can obtain the expression for PB− PA in equation (2)
We will only derive the term with coefficient B1 as an example. However, it is worth noting that the derivation process for the other terms can be completed in a similar way. Further simplification involves dealing with the Δ symbol, which indicates that we need look for quantities that remain constant before and after refraction. The well-known Gaussian imaging formula is:

Rewrite equation (14) in the following form

We can find that the quantity n(c–1/l) is an invariant on refraction. Then, the first term of the primary pupil aberration expression can be transformed into:
The aberrations at other positions can be obtained by proportional relations. In the meridian section where x= 0, we can obtain the value of h0 by tracing a paraxial ray from an axial object point with the conjugate distance  . We let h0 =
  , which corresponds paraxially to
  . With this, we can simplify equation (16) to the familiar form:
The coefficients of other primary pupil aberrations can be expressed as
where  is defined as
  , which is the Smith–Helmholtz invariant in the pupil imagery system. It is obviously
  in the same optical system.
In a polar coordinate, the wavefront aberration can be expressed in term of these primary pupil aberration sums with the normalized field coordinate ρ and pupil coordinate η:

From equation (19), the effects of phase aberrations can be quantitatively discussed on the basis of geometrical optics in the design.
4. Coaxial system design
The afocal telescope design for the TianQin mission currently adopts a near diffraction-limited off-axis four-mirror configuration. During the coaxial design phase, the quaternary mirror (QM) contributes very little to the overall optical power of the system, and can even be a flat mirror without optical power. Therefore, an initial Cassegrain-style three-mirror configuration with a relay image can adequately satisfy the design requirements [33–36]. Figure 6 shows a ray tracing of an on-axis Cassegrain design for the TianQin mission, including a real relay image. In the sequence of ray propagation, the system consists of primary mirror (PM), secondary mirror (SM), and tertiary mirror (TM). The aperture stop of system is behind the PM, where the test mass is situated, and all mirrors are designed as spherical surfaces.
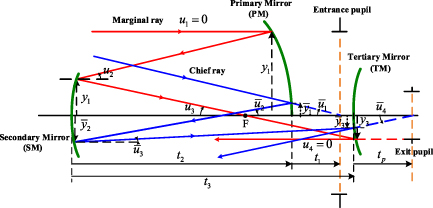
Figure 6. Ray tracing of initial coaxial structure.
Download figure:
Standard image High-resolution imageThe curvature radius of the PM, SM and TM are respectively R1
, R2
, and R3. t1, t2, t3 and t4 represent the distance between the entrance pupil and PM, the distance between PM and the SM, the distance between SM and the TM, and the distance between TM and the image plane respectively. The transmission media refractive index is set as  ,
,  . The height y of the intersection point of the ray with the surface and the paraxial angle u of the ray's inclination can be calculated according to paraxial y-u method:
where ϕi represents the optical power of the ith mirror, which can be determined by

From equations (17)–(21), the primary pupil aberration coefficients can be expressed as the functions of y1,  , ϕi
(i = 1, 2, 3), and ti
(i = 1, 2, 3, 4) as equations (22)–(26) [36]
, ϕi
(i = 1, 2, 3), and ti
(i = 1, 2, 3, 4) as equations (22)–(26) [36]

To ensure the optimal performance of the afocal telescope for the TianQin mission, several constraints have been applied to the overall layout of the optical system. The aperture of the PM has been set as 220 mm, which not only satisfies the requirements of energy transmission but also ensures convenience in manufacturing and testing. Additionally, the optical length of the telescope has been limited to 400 mm, excluding the supporting structure. To initiate the design process, we set the initial values of y1 = 110 mm,  1 = 5 mm, t1 = −500 mm and t3 = 250 mm. Further design and optimization will be carried out using the ZEMAX [37] commercial software. Due to the lack of pupil aberration calculation programs in current commercial software, the initial structural parameters of the coaxial system are obtained based on the Zemax Programming Language (ZPL) macro described in table 2. At this phase, the QM is a flat mirror without any optical power. The initial design prescriptions, including the curvature radii of three mirrors and the distances between them, are listed in table 3.
Table 2. Programming description for the optimization based on primary pupil aberrations.
| ZPL macro 1: Pupil aberrations correction in a coaxial system | |
|---|---|
Input: y1,  1, t1, t3
| |
| Output 1: Primary pupil aberrations coefficient for wavefront power series expansion | |
| Output 2: Primary pupil aberration value for merit function | |
| 1: | Field Sampling Module |
| 2: | For m = 1 to Nm // determines how many radial arms of rays in the circularly pupil |
| 3: | for n = 1 to Nn do // determines how many rays are traced at each field |
| 4: | Fov(m, 2*n-1) = (m-1)*2*pi/Nm |
| 5: | Fov(m, 2*n) = (n-1)*Maxfield/(Nn-1) |
| 6: | end for |
| 7: | end for |
| 8: | Ray Tracing Module |
| 9: | For t = 1 to nfield do // nfield = Nm in rotationally symmetric system |
| 10: | hy(1, t) = Fov(t,2)/Maxfiled // Calculating the normalized field coordinates |
| 11: | RAYTRACE hx, hy(1,t), 0, 0, PWAV //marginal ray |
| 12: | Record the height Hm(i,t) and angle Im(i,t) // i is serial number of current surface |
| 13: | RAYTRACE hx, hy(1,t), 0, 0, PWAV //chief ray |
| 14: | Record the height Hc(i,t) and angle Ic(I,t) |
| 15: | End for |
| 16: | For p = 1 to Nm |
| 17: | For q = 1 to Nn do |
| 18: | Calculate the  , ,  , ,  , ,  , and , and  using equations (22)–(26) using equations (22)–(26) |
| 19: | Calculating the W(p,q) using equation (19) |
| 20: | End for |
| 21: | End for |
| 22: | 
|
| Optimization algorithm: damped least square method | |
Table 3. Coaxial initial structure parameters.
| Surface | Radius (mm) | Distance (mm) | Conic |
|---|---|---|---|
| Stop | — | −500 | — |
| PM | −644.453 | −300 | −0.916 |
| SM | −48.596 | 350 | — |
| TM | −189.028 | −60 | — |
| QM | Infinity | — | — |
| Image | — | — | — |
5. Off-axial system design and optimization
The coaxial afocal telescope is transformed to an off-axis system with conic surfaces. TTL coupling noise generated by geometrical WFE can be suppressed efficiently by making the OPL uniform or at least symmetric over the FOV. The WFE should be kept as uniform as possible and have a uniform distribution at the sampled FOVs in all directions. The imaging quality of TianQin telescope is evaluated by both imaging RMS WFE and pupil aberrations in the optimization process.
However, due to the limitations of existing programs, ZPL macros are still used as an auxiliary tool for subsequent optimization. Thompson's nodal aberration theory suggests that the misalignment of the system only affects the aberration nodal position [38–40]. The ZPL macro described in table 2 is used to calculate the wavefront aberration coefficient in the coaxial system, which partially characterizes the pupil aberration level [41, 42]. Furthermore, the uncorrected pupil aberrations can be reflected in the locations where the chief ray crosses the pupil plane. In an ideal optical system without any aberration, the chief rays tracing from any field should pass through the center of the exit pupil plane. Hence, we use the RMS radius of the chief ray on the pupil plane to quantitatively assess the level of pupil aberration [15]:

where N is the number of sampling points, xi is the x coordinate of ith sampling point on the pupil plane, yi is the y coordinate of ith sampling point on the pupil plane, the notation with bar is the corresponding arithmetic mean. RCRMS can be a suitable metric when the optimization involves high order aberrations. In our previous design, no pupil aberration correction was implemented, and the results showed that RCRMS = 0.729 mm at the FOV = 220 µrad.
To meet the demanding requirements of correcting pupil and image plane aberrations simultaneously, a progressive strategy is employed during the design process, gradually increasing the number of aspheric terms. Lens parameters, including the radius of curvature, aspherical coefficients of the TM and QM, decenter value in Y-direction, and tilt about the x-axis, are set as variables in the optimization. The merit function comprises the default WFEs generated by Zemax, boundary conditions, and ZPL macros described in tables 2 and 4. A more detailed description of optimization in software is beyond the scope of this article, and can be found in our previous work. After repeated optimization, the design of the TianQin telescope with pupil aberration correction is obtained.
Table 4. Programming description for the optimization in the off-axial design.
| ZPL macro 2: Pupil aberrations correction in an off-axial system |
|---|
| Input 1: Exit pupil position // Called from the Zemax main program |
| Output 1: Coordinates on exit pupil plane // Called from ZPL macro 1 |
| Output 2: RCRMS |
| 1: For m = 1 to Nm |
| 2: For n = 1 to Nn do |
| 3: // Field Sampling |
| 3: Fov(m,2*n-1) = (m-1)*2*pi/Nm |
| 4: Fov(m,2*n) = (n-1)*Maxfield/(Nn-1) |
| 5: hx(m,n) = cos(Fov(m,2*n-1))*Fov(m,2*n)/Maxfiled |
| 6: hy(m,n) = sin(Fov(m,2*n-1))*Fov(m,2*n)/Maxfiled |
| 7: // Ray Tracing |
| 8: RAYTRACE hx(m,n), hy(m,n), 0, 0, PWAV |
| 9: Record the x-coordinate on exit pupil plane Px(m,n) |
| 10: Record the y-coordinate on exit pupil plane Py(m,n) |
| 10: End for |
| 11: End for |
12:  ; ; 
|
| 13: Calculating the RCRMS using equation (23) |
| 14: Plot the 'chief ray spot diagram'// in MATLAB software |
| Optimization algorithm: damped least square method |
6. Design results and performance
The layout of the final off-axial design, along with rays for 3 fields (−200 μrad, 0, +200 μrad measured in receiver-mode object space) is illustrated in figure 7. The PM is a large-diameter paraboloid mirror, while the other three mirrors are even-order aspheric surfaces. An intermediate image plane is placed inside the system so that the stray light outside the FOV can be shielded by the field stop placed at the focal plane. In the coordinate system shown in this figure, the real exit pupil is located 98.77 mm behind the vertex of PM along the z-axis. The combination of the TM and QM directs the laser beam to the optical bench, where the beam measures about 1.5 mm in width. The fundamental structural parameters and even-order aspheric coefficients are detailed in tables 5 and 6.
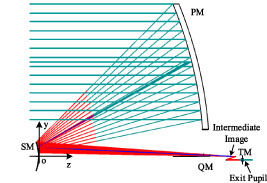
Figure 7. Optical layout of the TianQin telescope design.
Download figure:
Standard image High-resolution imageTable 5. Parameters of final off-axial structures.
| Surface | Radius (mm) | Distance (mm) | Conic | Decenter Y (mm) | Tilt about x (°) | Size (mm) |
|---|---|---|---|---|---|---|
| Stop | — | −500 | — | — | — | |
| PM | −708.325 | −320 | −0.916 | −180 | — | 230 |
| SM | −75.103 | 382.363 | −5.409 | — | — | 55 |
| TM | −195.349 | −18.68 | 16.46 | 0.125 | −8.1 | 2.5 |
| QM | 49.017 | — | 18.494 | 7.69 | −5.5 | 9.1 |
| Image | — | — | — | — | — | — |
Table 6. Detailed even-order aspheric coefficients.
| Surface | 4th-order term | 6th-order term | 8th-order term | 10th-order term | 12th-order term |
|---|---|---|---|---|---|
| SM | −1.36 × 10−06 | 4.62 × 10⁻¹⁰ | −1.72 × 10⁻¹³ | 3.61 × 10⁻¹⁷ | — |
| TM | 4.08 × 10−03 | 1.06 × 10−03 | −4.22 × 10−03 | −1.12 × 10−03 | 4.75 × 10−03 |
| QM | −5.87 × 10−05 | 1.81 × 10−06 | −4.15 × 10−08 | 1.56 × 10⁻¹⁰ | 2.04 × 10⁻¹² |
The WFEs for each field are presented in figure 8, revealing excellent RMS WFEs and wavefront consistency. Figure 9 depicts the locations where the chief rays intersect the exit pupil plane for a set of fields. The blue circles represent the chief rays in the scientific FOV, while the red asterisks represent the chief rays in the acquisition FOR. The RCRMS for the two FOV is shown in the figure, with the center of mass as the reference. The RCRMS-S = 0.0073 mm and the RCRMS-A = 0.1605 mm are indicated in the figure. The subscripts S and A represent the scientific FOV and the acquisition FOR, respectively. Our design results demonstrate that pupil aberrations and image plane aberrations are well corrected, surpassing our previous design results.

Figure 8. Wavefront error over the scientific field of view.
Download figure:
Standard image High-resolution image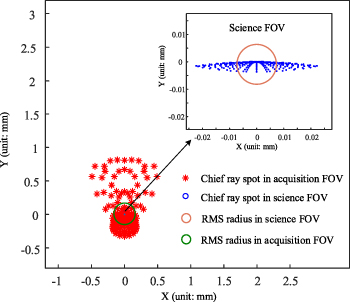
Figure 9. Chief ray spot diagram at the exit pupil plane.
Download figure:
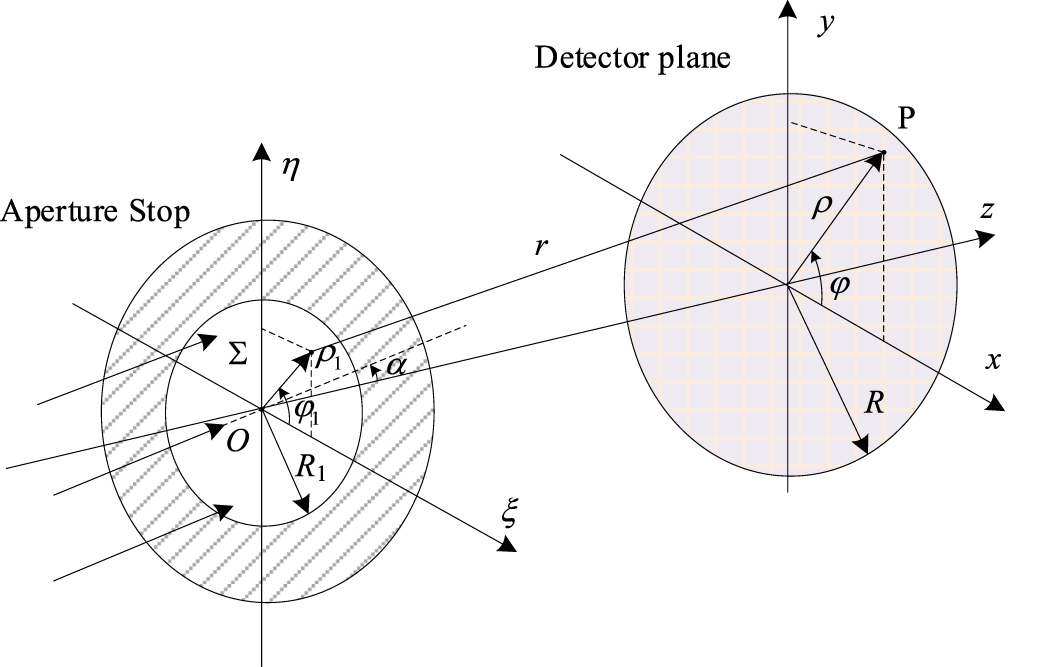
Standard image High-resolution imageTo investigate the TTL noise resulting from wavefront distortion in the telescope, we temporarily disregard the aberrations of other optical systems. This allows us to focus on the impact of imperfect wavefront and continuous jitter on TTL coupling noise in the transceivers during GW detection [30, 43–45]. We consider a simplified interferometer whose essential components contain the aperture stop, the reference beam, the tilted measurement beam, and the photodiode. In figure 10, the plane where the aperture is positioned is denoted as Σ, with the pivot set as the coordinate origin. The reference beam is tilted by an angle α around the pivot, which corresponds to the center of the aperture. The electric field for the measuring beam can be expressed as follows:

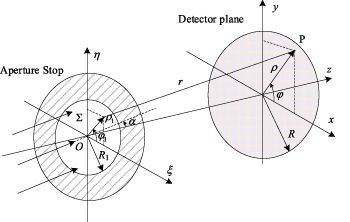
Figure 10. The field vectors placed in the coordinate system to be used for the interferometer. The field at any point P on the detector is affected by the diffraction effect caused by the finite aperture stop.
Download figure:
Standard image High-resolution imagewhere the k= 2π/λ is the wave number, w is the frequency, A is the amplitude, and the Ф is the initial phase. The longitudinal path length sensing signal (sLPS) does not change with time, allowing us to set t= 0. Since the signal is the variation of the phase difference between the two beams, the initial phase can be also set to 0. The wavefront phase distribution ΔW at the exit pupil is described by the first 15 orders of Fringe Zernike polynomials, with the polar form polynomials and their corresponding coefficients provided in table 7 [46]. The degradation of the wavefront phase caused by the telescope can be precisely expressed as ΔW= Σaizi .
Table 7. Wavefront error in the form of Fringe Zernike series expansion.
| Index | Coefficient ai | Polynomial Zi | Index | Coefficient ai | Polynomial Zi |
|---|---|---|---|---|---|
| Z1 | −1.34 × 10−03 | 1 | Z9 | 9.20 × 10−04 | 6ρ^4-6ρ^2 + 1 |
| Z2 | 9.55 × 10−05 | ρ * cos α | Z10 | 1.16 × 10−03 | ρ^3 * cos 3α |
| Z3 | 1.93 × 10−05 | ρ * sin α | Z11 | −7.80 × 10−04 | ρ^3 * sin 3α |
| Z4 | −1.45 × 10−03 | 2ρ^2-1 | Z12 | −6.00 × 10−06 | (4ρ^2-3) ρ^2 * cos2α |
| Z5 | −3.02 × 10−03 | ρ^2 * cos 2α | Z13 | −4.20 × 10−04 | (4ρ^2-3) ρ^2 * sin2α |
| Z6 | 5.86 × 10−03 | ρ^2 * sin 2α | Z14 | −3.30 × 10−05 | (10ρ^4-12ρ^2 + 3) ρ * cosα |
| Z7 | −3.70 × 10−06 | (3ρ^2-2) * cosα | Z15 | 1.36 × 10−04 | (10ρ^4-12ρ^2 + 3) ρ * sinα |
| Z8 | 7.40 × 10−04 | (3ρ^2-2) * sinα | — | — | — |
In practical scenarios, the measuring beam will experience diffraction, leading to changes in both amplitude and phase on the detector. To account for this, Kirchhoff's diffraction formula is employed to calculate the field after diffracted propagation. In our numerical analysis, we set the size of the aperture stop and the detector to R1 = 0.6 mm, R = 9 mm, respectively. As the integration is conducted over a circular region, the Cartesian coordinates are converted to polar coordinates using the following relationship:
Then the field on the detector plane can then be written as

where

The fundamental Gaussian beam is used to describe the reference beam, which is assumed to normally incident to the aperture. Its field distribution can be expressed as:

where the complex parameter q is defined as q = (z-z0) + izr,  is the Rayleigh range, z0 denotes the location of the waist, ω0 is the beam waist radius. Similarly, the field of the diffracted reference beam on the detector can be expressed by

The difference in the OPL between the tilted measuring beam and Gaussian beam from the local optical bench can be calculated by evaluating the complex phase of the integral over the overlap term:

The equation (34) appears to be highly complex, making it challenging to derive an analytical solution. As a result, we resort to employing numerical integration methods using MATLAB software to tackle this problem. For the simulation, we set the detector location at z = 500 mm, the beam waist location at z0 = 250 mm, and ω0 = 0.5 mm. Within the range of [−300 μrad, 300 μrad], we continuously vary the rotation angle α to observe the corresponding changes in the longitudinal pathlength signal (LPS). The derivative of LPS with respect to α reflects its sensitivity to jitter. Due to the difficulty in obtaining an analytical expression, we utilize the difference method to approximately compute in the numerical simulation. The simulation results are presented in figure 11. The maximum TTL over the entire ±300 μrad FOV is 0.0152 nm µrad−1, and the improved design specification meets the noise budget of 0.6 nm µrad−1 anywhere.

Figure 11. Analysis of TTL coupling noise. (a) The curve of LPS with angle α; (b) TTL noise caused by wavefront error.
Download figure:
Standard image High-resolution image
7. Conclusion
In this paper, we systematically analyze the physical meaning of the pupil aberration and its impact on the optical path difference caused by the different fields of view in the telescope system for space GW observatories. This concept is successfully introduced into the design of the telescope which has strict requirements for the optical path noise caused by the field jitter. By exploring pupil aberration theory and applying the tools such as the chief ray spot diagram and RCRMS, we established an automated correction algorithm for the pupil aberration and image wavefront aberration for the TianQin telescope system, achieving a high-performance optical design. The image plane aberration maintains low wavefront distortion after the pupil aberration correction, with the wavefront aberration less than λ/200 at the science FOV, well beyond the diffraction limit. The impact of residual aberrations in the exit pupil on TTL coupling noise was numerically simulated, and the upgraded design demonstrated improved performance in terms of TTL. Overall, our work demonstrates the critical role of correcting pupil aberrations in achieving optimal telescope performance. This approach to design has the potential to be significant in upcoming missions focused on detecting GWs in space.
Acknowledgments
This work was supported by the National Natural Science Foundation of China (12274156); Science, Technology, and Innovation Commission of Shenzhen Municipality (JCYJ20210324115812035).
Data availability statement
All data that support the findings of this study are included within the article (and any supplementary files).
Conflict of interest
The authors declare no conflicts of interest.