Abstract
Nocturnal respiration rate parameters were collected from 20 COPD subjects over an 8 week period, to determine if changes in respiration rate were associated with exacerbations of COPD. These subjects were primarily GOLD Class 2 to 4, and had been recently discharged from hospital following a recent exacerbation. The respiration rates were collected using a non-contact radio-frequency biomotion sensor which senses respiratory effort and body movement using a short-range radio-frequency sensor. An adaptive notch filter was applied to the measured signal to determine respiratory rate over rolling 15 s segments. The accuracy of the algorithm was initially verified using ten manually-scored 15 min segments of respiration extracted from overnight polysomnograms. The calculated respiration rates were within 1 breath min−1 for >98% of the estimates. For the 20 subjects monitored, 11 experienced one or more subsequent exacerbation of COPD (ECOPD) events during the 8 week monitoring period (19 events total). Analysis of the data revealed a significant increase in nocturnal respiration rate (e.g. >2 breath min−1) prior to many ECOPD events. Using a simple classifier of a change of 1 breath min−1 in the mode of the nocturnal respiration rate, a predictive rule showed a sensitivity of 63% and specificity of 85% for predicting an exacerbation within a 5 d window. We conclude that it is possible to collect respiration rates reliably in the home environment, and that the respiration rate may be a potential indicator of change in clinical status.
Export citation and abstract BibTeX RIS

Content from this work may be used under the terms of the Creative Commons Attribution 3.0 licence. Any further distribution of this work must maintain attribution to the author(s) and the title of the work, journal citation and DOI.
1. Introduction
Respiration rate has recently been referred to as a 'neglected vital sign' which is often overlooked, despite its potential utility in the early recognition of changes in disease state (Cretikos et al 2008). One reason for its lack of use, particularly in the home setting, is the relative inconvenience of respiratory rate measurement. In this paper, we report on the use of a novel non-invasive technology for the measurement of respiration rate (SleepMinder, ResMed Sensor Technologies) and its pilot application in a clinical subset of interest, namely COPD patients being monitored at home following discharge from the hospital following an exacerbation. The non-invasive technology considered is radio-frequency biomotion sensing which determines the movement of the chest by comparing the phase of the reflected waves with those transmitted. The principles of operation of this technology are described further in section 2.3, and also in prior publications from this group (Shouldice et al 2010, de Chazal et al 2011, Zaffaroni et al 2013, Pallin et al 2014). Section 2.4 also describes the signal processing steps by which the respiration rate can be extracted from the measured signal
We believe that this technology may have application in a number of disease conditions such as COPD or CHF, under the hypothesis that respiration rate changes may indicate a change in the underlying clinical condition. Chronic obstructive pulmonary disease (COPD) is of particular interest to us, as it is a chronic irreversible condition marked by periods of relative stability punctuated by acute exacerbations (Donaldson and Wedzicha 2006, Franciosi et al 2006). These exacerbations can be triggered by opportunistic infections, and often result in emergency hospitalization or significant unscheduled medical intervention, which impose both a significant cost burden on the healthcare system and quality-of-life impact on the sufferer and their family. Exacerbations are frequently under-reported–it is estimated that perhaps less than 50% are reported by patients (Langsetmo et al 2008). A key goal in COPD management is to reduce the frequency and severity of these acute exacerbations of COPD (ECOPD). Hence techniques which allow quicker and more accurate detection of potential exacerbations may have clinical utility.
A number of authors have already suggested that increases in breathing rate are associated with ECOPD (e.g. Franciosi et al 2006). A recent study showed an increase in respiratory rate up to 5 d in advance of a reported exacerbation (Yañez et al 2012). Their study was carried out on 89 patients who were on home oxygen therapy, where respiration rate could be measured using the VisonOx monitor installed with the oxygen supply. Motivated by the findings of Yañez et al, the goals of this paper were (a) to demonstrate the feasibility of longitudinal respiration rate monitoring in COPD subjects using a non-contact biomotion sensor, and (b) investigate whether there was any evidence of changes in respiration rate prior to acute exacerbations of COPD events, based on pilot data from 20 COPD patients.
2. Methods
2.1. Subjects
Data was collected from a set of twenty participants with COPD over a period of approximately 8 weeks in a purely observational manner (i.e. the recorded data was not used to guide clinical treatment in any way, and data was not analyzed until after the end of the observation period). This study was approved by the St Vincent's University Medical Ethics Committee. Patients provided written informed consent for study participation. Subjects were enrolled at the point of discharge from St Vincent's University Hospital, Dublin following an in-hospital stay for an exacerbation of their underlying COPD condition. The inclusion criteria required that patients had experienced an ECOPD-related hospitalization within the previous 12 months prior to enrolment, were Gold Stage 2 to 4 (GOLD 2014), were capable of giving informed consent and, for logistic reasons, lived within a 50 mile radius of the hospital. Note that the subset of patients selected (i.e. patients with a COPD related hospitalization) may not be representative of the general class of Gold Stage 2 to 4 patients. The demographics of the patients who took part in the study are listed in table 1.
Table 1. Demographic details of subjects.
| Patients studied | N = 20 |
| Male Sex, n (%) | 11 (55%) |
| Age, years | 68 ± 10 |
| Body mass index (m kg−2) | 27.2 ± 5.9 |
| Spirometry | |
| FEV1 (litres) | 1.27 ± 0.62 |
| FEV1,predicted (%) | 51 ± 20 |
| FVC (litres) | 2.79 ± 1.09 |
| FEV1/FVC (%) | 48 ± 16 |
| GOLD | |
| I | 1 |
| II | 8 |
| III | 10 |
| IV | 1 |
| Comorbidities | |
| Left ventricular failiure, n (%) | 7 (35%) |
| Right ventricular failure, n (%) | 6 (30%) |
| Prior diagnosis of SDB, n(%) | 5 (25%) |
2.2. Protocol
Following recruitment, patients were issued with a SleepMinder device, which is a biomotion sensor designed to collect respiration rate information during a person's sleep (the SleepMinder is more fully described in section 2.3 below). This device did not require any patient intervention, as it continuously logged respiration rate information on to an SD card on a nightly basis. The SleepMinder was set to record on an automated schedule from 3 to 2 PM the following day to guarantee that the sleeping period was recorded. Patients were followed for an approximate 2 month period using the SleepMinder recording in their home environment, and returned the device to the study coordinators at the end of the 2 month period. An automated algorithm was developed to only analyze the portion of the signal during the night time period when the person was present in bed. As part of the protocol, events associated with an exacerbation of COPD (ECOPD) were recorded by the study co-ordinator: ECOPD events were defined as either hospitalizations or ECOPD-related non-scheduled visits to the emergency room(ER) or primary care doctor. If a person was hospitalized, there is a loss of SleepMinder data for that subject during their period of admission; similarly, there will be periods of missing data if the subject is out of their home for other reasons.
2.3. Respiratory movement measurement
The non-contact radio frequency biomotion sensor (SleepMinder, ResMed, Dublin) used in this study has been described elsewhere (de Chazal et al 2011, Zaffaroni et al 2013, Pallin et al 2014, O'Hare et al 2014), but for convenience we provide a brief description of the technology here. The SleepMinder system has been developed specifically to measure movement in sleeping human subjects. This sensor operates by transmitting two short pulses of radio-frequency energy at 5.8 GHz (each pulse is approximately 5 ns long). The first pulse acts as the main transmit pulse, and the second pulse is the mixer pulse. The first pulse reflects off nearby objects to create an echo pulse that is received back in the sensor. By multiplying ('mixing') the echo pulse with the mixer pulse inside the receiver, a signal proportional to any phase shift of the echo pulse is generated. Moving objects (such as a person breathing) generate a variable phase shift that can be detected by the electronics in the circuit. In addition, it employs a technique to overcome a well-known limitation in radio frequency sensing called the range correlation effect (Droitcour et al 2004), which refers to the fact that if a moving object is undergoing small movements centered about a location with a fixed phase relationship to the sensor which is in a sensitivity null, then the movements will be detected poorly if only a single channel is used. The technique, referred to as quadrature detection, effectively means there are two modes of transmission, which leads to two estimates of the movement, called I and Q channels. Figure 1 shows the illustrative size and positioning of the non-contact sensor relative to the monitored subject. Figure 2 shows an example of a typical signal acquired by this sensor over 60 s, in which the main movement is chest movement associated with respiratory effort, but with a larger body movement (associated with a change of bodily position) in the middle of the record, followed by a return to stable breathing.

Figure 1. A schematic of how the non-contact biomotion sensor is positioned relative to the subject being monitored.
Download figure:
Standard image High-resolution image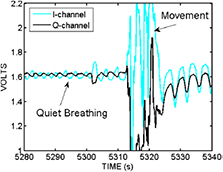
Figure 2. A 60 s snapshot of the raw movement signal recorded by the biomotion sensor during a person's sleep. There are two channels I and Q which give quadrature views of the reflected movement off the torso. Note that in this example the I and Q are initially out of phase for the period 5280–5310 s, but that after the large body movement (probably a body turn and reposition) which occurs between 5310 and 5320 s, the steady breathing signal returns, but with I and Q now more or less in phase.
Download figure:
Standard image High-resolution imageAs seen in figure 2, movement signals received in this device contain a mixture of all movements within the field of the sensor. For example, if a person is moving both arms and head, the received signal will reflect components of all three movements. Fortunately, during sleep, most movement is related to respiratory effort, which is the key to its utility in respiration rate monitoring.
The sensor is also designed to be directional (only measures movement in front of the sensor) and range limited (it only responds to objects which are within 1.5 m of the sensor). The system operates at low power (total average emitted power is less than 1 mW), to comply with safety and regulatory guidelines for radio-frequency devices.
The sensor system outputs two analog baseband voltage signals which represent the I and Q signals of the sensor. Once the baseband signals are available, signal processing techniques are then required for robust respiration rate (RR) estimation. In the ideal case of a high SNR signal, with infrequent movement artefacts, then simple non-parametric spectral estimation techniques could be used (such as a periodogram (PG) estimator technique). In practice, there are some limitations to such a technique (a) the signal may have periods of poor SNR and high movement artifact, (b) a reliable estimate may require a long time window, which is longer than the time period over which RR is useful to measure—therefore a simple periodogram based approach may be incapable of capturing the fine dynamics of the respiratory rate. In practice, we would like to obtain reliable estimates of RR over a time period of 30 s or less, since it is quite reasonable that the RR will vary over such epochs. Given these limitations of a periodogram approach, we have investigated other alternate approaches to measure the RR.
2.4. Analysis of respiratory movements to determine respiration rate
The technique used in this paper for extracting respiration rate from the raw respiratory movement recorded by the SleepMinder is an adaptive notch filter (ANF) (Nehorai 1985, Ballal et al 2012). We adapt the modified approach suggested by Tan who chose an Infinite Impulse Response (IIR) filter architecture for use in the adaptive filter (Tan and Jiang 2009). IIR filters are preferred to FIR (finite impulse response) filters when a target performance is required at low computational cost. Contrary to the general case for multi-pole IIR adaptive filters, no multiple local minima occur with an adaptive (second order) IIR notch filter, only a single global minimum (Chicharo and Ng 1990, Tan and Jiang 2009). Also, no stability issues have been noticed during the experimental work. Frequency estimation and tracking using an adaptive second-order IIR notch filter is described in this section. Here we follow the approach of Tan and Jiang (2009) for the single-harmonic case. The second order transfer function of an IIR notch filter is given by

where  is the filter notch frequency and r is the parameter that controls the bandwidth of the notch. From the transfer function, the filter output for an input x[n], where n denotes discrete time, can be written as

For the frequency estimation/tracking case, θ is not known. If x[n] is a narrowband signal (i.e. a breathing signal with a single strong breathing frequency so that signal is approximately sinusoidal) with a center frequency  , the filter output will be minimum when
  . Therefore, an estimate of
  can be obtained from an N-sample segment of x[n] using
In the above equation,  could be obtained by evaluating the expression for all sample values of
  This approach may yield good frequency estimates but it may not be computationally efficient for real-time frequency tracking, unless the density of
  is reduced. Reducing the density of
  leads to a poorer resolution. Therefore in practice, a more effective approach is to use an adaptive algorithm to adjust the parameter θ and provide estimates of the frequency
  without the resolution limitation. The well-known least mean squares (LMS) algorithm can be used to carry out this task. The LMS algorithm for updating the filter parameter θ, to track the input signal frequency (which coincides with minimizing
 ![$|y\left[n\right]{{|}^{2}}$](https://content.cld.iop.org/journals/0967-3334/35/12/2513/revision1/pmea503974ieqn010.gif) ) can be derived as:
) can be derived as:

where μ is the adaptive step-size. For a good convergence rate, a suitable value of μ is required. In this work, the amplitude of the input signal varies with time. To achieve good performance, μ needs to be adapted to the input. Therefore, an implementation of the normalized LMS algorithm was used by varying the parameter μ as

where β is a constant parameter and ![$\hat{P}\left[n\right]$](https://content.cld.iop.org/journals/0967-3334/35/12/2513/revision1/pmea503974ieqn011.gif) is an estimate of the signal power at instant n, which is approximated as
is an estimate of the signal power at instant n, which is approximated as ![$P\left[n\right]=\left(1/L\right)\sum\nolimits_{L-1}^{l=0} |x\left[n\right]{{|}^{2}}$](https://content.cld.iop.org/journals/0967-3334/35/12/2513/revision1/pmea503974ieqn012.gif) . The length L should be sufficiently small to capture input amplitude changes, and sufficiently large to provide a good local estimate of the signal power. To summarise, an estimate of the input signal frequency, starting from some value
. The length L should be sufficiently small to capture input amplitude changes, and sufficiently large to provide a good local estimate of the signal power. To summarise, an estimate of the input signal frequency, starting from some value ![$\theta \left[0\right]={{\theta}_{0}}$](https://content.cld.iop.org/journals/0967-3334/35/12/2513/revision1/pmea503974ieqn013.gif) is updated on a sampling interval basis using (4). The output, y[n], is computed directly from (2), while the same equation can be differentiated and evaluated to obtain an estimate of the derivative
is updated on a sampling interval basis using (4). The output, y[n], is computed directly from (2), while the same equation can be differentiated and evaluated to obtain an estimate of the derivative ![$\delta y\left[n\right]/\delta \theta \left[n\right]$](https://content.cld.iop.org/journals/0967-3334/35/12/2513/revision1/pmea503974ieqn014.gif) . Appropriate choice of the tracking parameter β will ensure that a normalized LMS (nLMS) algorithm will converge to a correct value of
. Appropriate choice of the tracking parameter β will ensure that a normalized LMS (nLMS) algorithm will converge to a correct value of  up to a small misadjustment parameter (recall also that there is a fundamental tradeoff between the speed of tracking and the root mean square error in the estimate of the respiratory frequency).
In practice, the idealized signal model above suffers from a number of practical challenges. The real signals do not consist of a single strong purely sinusoidal component corrupted by a small amount of uncorrelated noise. Rather, the signal received is a combination of a respiration signal and bodily movement signal (see figure 2 as example), together with a small amount of intrinsic system noise (internal electronic circuit noise plus background mechanical noise in the environment). Moreover, the respiration signal is seldom sinusoidal in nature; rather it has multiple harmonic components. There will also be periods when the subject is absent (e.g. bathroom break) and in those situations, the algorithm may take on arbitrary values dependent on the random noise signal presented. Also, as noted above, the system outputs two quadrature signals, whose relative strength will depend on the relative distance for the subject and the particular reflection pattern they observe, so either the I or Q signal is often significantly higher in SNR than the other. So in practice, the value for  may be attracted to a local minimum, in particular for the case of a breathing signal with strong harmonic components. Because of all these reasons and since IIR adaptive filters are slow in convergence, it is a good idea to try to initialize the algorithm as close as possible to the correct BR value, such that it converges quickly. Since the change in BR is slow, BR tracking can be achieved without problems following good initialization. We propose that, the initial value be derived from a high quality data window that is not dominated by noise or artefacts. The calculation of the initial value from such data window can be carried out using equation (3). This process is applied once and should not affect the computational simplicity of the tracking algorithm. To overcome these problems, we need to ensure that in parallel with the ANF algorithm, we must also (a) recognize whether a valid biomotion signal is present, (b) select the optimal channel between I and Q, and (c) ensure that the nLMS is operating close to the true respiration frequency as much as possible.
The first step, is to ensure that a signal with sufficient signal-to-noise ratio is presented to the ANF algorithm. The SNR may be low because there is low amplitude signal (i.e. the subject is at the range of detection of the sensor, or presents an unusually low reflected signal to the sensor), or conversely the noise may be high (due to lots of body movement, external mechanical movement, etc.). We have developed a simple signal selection algorithm as follows:
A data segment of length  is chosen (in our case we will typically use TW = 15 s). The data segment is zero-meaned, and the following procedure is implemented on the data segment:
- (a)Find the sign (+/−) of each of the data samples.
- (b)Determine zero-crossings as the points where sign changes.
- (c)Calculate the time durations between consecutive zero-crossing pairs.
- (d)Ignore/remove durations smaller than a certain threshold (e.g. durations less than 0.2 s)
- (e)Combine pairs of durations to form new larger durations,
 . (where is the number of cycles)
 - (f)Calculate the signal power associated with each new duration,


The above procedure is used to identify 'clean' respiration signals. Such signals are characterized by their relatively regular and small number of zero-crossings compared to the noise and movement signals. Clean breathing signals also tend to have approximately equal breathing rate power distribution between consecutive cycles. If the procedure above is executed on a clean respiration segment, the  (corresponding to breathing cycles) produced in step 5 will have a very small variation over different i values, provided that the data window is sufficiently small. The same applies for
  obtained from step 6. The purpose of step 4 is to suppress the effect of any small disturbances around the zero-crossing points. From the above procedure, a number of parameters will be available that can be utilized as signal quality measures. From step 2, the number of zero-crossings (
 ) is directly obtained. The outcomes of step 5 and step 6 are used to calculate the coefficients of variation
  and
and  of
of  and
and  respectively (the coefficient of variation is the standard deviation divided by the mean—the coefficient of variation will be close to zero for a very regular signal). Therefore, the smaller
  and
and  the more likely the data is due to a clean respiration. In addition to these parameters, the average signal power
  is used as another parameter for quality evaluation. To detect the presence of a signal suitable for the ANF algorithm, a number of tests are performed. The first test is to detect the presence of a bio-signal in the data segment under test. For this purpose a certain power threshold,
  has to be exceeded. Data whose power does not exceed the threshold, is considered due to background noise—and absence of any bio-information is declared (i.e. no subject is in range). Since breathing signal power is quite variable, finding a strict value for
  is difficult. In practice, we use quite a low value of
  and an additional metric is applied for bio-signal/noise discrimination. The number of zero-crossings,
  is utilised for this purpose. It was mentioned previously that data consisting of background noise tends to cross the zero level more times than when bio-signals are present. A very small number of zero-crossings can also indicate absence of useful respiration data due to a large DC shift. Therefore, two thresholds,
  and
and  are used to confirm the presence/absence of a bio-signal. The detection of a useful bio-signal is declared if:

and

If detection is declared, the data window needs to pass additional tests to qualify for being used for computation of the initial value of the ANF,  . A data window is adequate for calculating
  if, in addition to satisfying (8), it satisfies

where  , and
, and  are appropriately chosen thresholds. The operation involving
  in (8) is to ensure that the value
  is within the appropriate range determined by the practical BR range (e.g. for 15 segment data windows a range of
  would correspond to an allowed breathing rate range of 8–32 breaths min−1. The final operation in (8) is to ensure that the detected cycles occupies a sufficient proportion of the window. A data window that satisfies the criteria in (8) is classified adequate (for the initialization purpose). In the case where both I and Q signals are adequate, we select the optimal channel by choosing the one with the lower number of zero crossings, and in the event of a tie, select the channel with the lowest value of
  . Contrary to a periodogram approach, which processes a large data block each time a BR estimate is produced, the ANF tracking algorithm updates its output by processing only three consecutive samples of the input data (see equations (2) and (4)). Tracking is achieved by sliding the three-sample block one sample at a time to update the previous output This feature of the ANF approach enables it to capture fine changes in breathing rate.
2.5. Validation of respiratory rate estimation versus inductance plethysmography and expert human scorer
Prior to analysis of the nocturnal respiration rates of the COPD subjects, we conducted a validation exercise on previously acquired clinical data to confirm that the ANF algorithm was producing accurate results. In a previously published study (Zaffaroni et al 2013), SleepMinder was used to collect biomotion data of patients who were referred to the St. Vincent's University Hospital Sleep Disorders Clinic, Dublin, Ireland. In addition to SleepMinder signals, full polysomnography (PSG) was performed using the Jaeger-Toennies 1000 E system. Movements of the ribcage and abdomen were monitored using respiratory inductance plethysmography sensors around these regions, as is standard in PSG. Ten full-night recordings (each of duration longer than 6 h) were selected from this data set. A 15 min section was selected from each recorded night, based on the requirement that it is free of significant movement and disordered breathing to benchmark the ANF algorithm against a human scorer. The human scorer used a visualization tool to annotate the 15 min sections with end-points of inspiration and expiration (for both the chest and abdomen channels). An expert derived breathing rate was generated on a 1 s basis using data blocks of 15 s that were shifted every 1 s. Expert results were manually scored by an experienced respiratory scientist. Final expert results were formed by averaging the results obtained from each of the chest and abdomen data (see Shouldice et al 2010 for details). The data were analyzed using Matlab (Mathworks, Natick, MA). The system used the value T = 1 s, and a data segment length  of 15 s. The ANF algorithm was applied separately to the I and Q channels. A combined estimate was formed by averaging the ANF-I and ANF-Q respiration rate, to form an ANF-C.
3. Results
3.1. Accuracy of respiratory rate estimation versus inductance plethysmography and expert human scorer
The ANF algorithm was applied to the ten 15 min recordings and the resulting respiratory rates on 15 s segments were compared to the human expert scoring based on the respiratory inductance plethysmogram recordings (this equates to 885 respiration rate estimate values on a 1 s basis). Table 2 shows the performance of the algorithm for both the I and Q channels, and for a simple combination algorithm where the combined respiration rate is the average of the I and Q rates. The root mean square error in the rate is about 0.35 breath min−1 (note that an inherent feature of any adaptive filter is a residual RMSE term which is related to the choice of the normalized step size β, so it is not surprising to see some error. Encouragingly, there is no appreciable bias in the estimate. The percentage of respiration rate estimates which is within ±1 breath min−1 is >98.0%. These results confirm that under conditions of quiet breathing, the non-contact sensor and the ANF algorithm can produce robust estimates of respiration rate.
Table 2. Estimation errors in breathing rates over 15 min sections of data from 10 subjects.
| RMSE | bias | % within 0.25 breath min−1 | % within 0.5 breath min−1 | % within 1 breath min−1 | |
|---|---|---|---|---|---|
| ANF-I | 0.358 | −0.007 | 70.2 | 91.5 | 98.0 |
| ANF-Q | 0.340 | −0.007 | 71.5 | 92.5 | 98.3 |
| ANF-C | 0.346 | −0.010 | 71.2 | 92.3 | 98.2 |
3.2. Home measurement of nocturnal respiration rate
For the 20 subjects, a total of 1118 nights gave valid nocturnal respiration rates (which represented 89.8% of the available nights to be monitored). Lost nights were due to hospitalization, the device being turned off or incorrectly positioned, or the person not sleeping in their home bed (i.e. staying with family members). Figure 3 provides an illustration of the nocturnal respiration rate (recorded between approximately 23:00 and 7:00) for a typical subject, with the respiration rate reported on a per/second basis by the ANF algorithm. In this case the average breathing rate over the night is 15.35 breaths min−1, with a standard deviation of 1 breath min−1. The average breathing rate and its variability was subject dependent over the 20 subjects we studied. It also varied night to night as we show in later figures.
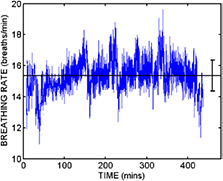
Figure 3. The respiration rate reported by the ANF algorithm over the duration of a single night recording. The horizontal black line indicates the average over the night, and the error bars show ± one standard deviation.
Download figure:
Standard image High-resolution imageThe ultimate goal was to see whether patterns in nocturnal respiration rate are linked with clinical status. Figure 4 shows an example of the time series of mean nocturnal respiration rate over the study duration for Subject 1 in the study. In this case, the overall respiration rate is high (~22 breaths min−1) and there is a link between an elevated respiration rate and an unscheduled visit to their primary care physician shortly thereafter. Figure 5 shows a second example from a different subject (Subject 15) which was a patient with three unscheduled clinical events (physician visit, accident and emergency room visit, and hospitalization). In this case, the baseline breathing rate is lower, and while there is some evidence of respiration rate increase in advance of the events, these are not particularly pronounced. This case shows the difficulty of applying a single simple rule to identify underlying clinical changes, and suggest that future studies should look for more sophisticated and robust rules, when there is sufficient date to avoid overtraining effects.

Figure 4. The time course of the mean nocturnal respiration rate (with standard deviation indicated by the error bars) for Subject 1 over an approximate 8 week period from 10 August 2011 to 10 October 2011. The vertical line indicates an unscheduled visit to a primary care physician with a complaint of shortness of breath. The patient was prescribed oral antibiotics at the visit. Note that in this case, there is a clear rise in the mean respiration rate prior to the visit.
Download figure:
Standard image High-resolution image
Figure 5. The time course of the mean nocturnal respiration rate (with standard deviation indicated by the error bars) for Subject 15 over an approximate 8 week period from 15 December 2011 to 14 February 2012. The vertical lines indicate three unscheduled healthcare visits, firstly to a primary care physician, secondly to an Accident & Emergency department, and finally a rehospitalization.
Download figure:
Standard image High-resolution imageA total of 19 ECOPD events occurred during the trial over 11 patients. The average monitored duration was 62.5 d for an average event rate of 3.3 events/patient year. For illustrative purposes, we developed a number of simple rule-based classifiers to determine the performance of a simple respiration rate based system to predict exacerbations of COPD in this data set. Three exemplar rule based classifiers were determined as follows. On a given day, the previous night's nocturnal respiration rates were compared with the values for the previous five days. The three rules were (a) if the median breathing rate showed an increase of more than x breath min−1 compared to any of the previous five nights, then the following day was marked as a likely event day, (b) if the mode of the breathing rate showed an increase of more than x breath min−1 compared to any of the previous five nights, then the following day was marked as a likely event day, and (c) if the mode or the median of the breathing rate showed an increase of more than x breath min−1 compared to any of the previous five nights, then the following day was marked as a likely event day. By choosing different values of x, we can build up a set of different classifier performances which trade sensitivity for specificity. The performance of these three rules is shown as a set of Receiver Operator Characteristics in figure 6. As an example, the post-hoc rule of an observed increase in the mode of the breathing rate of >1 breath min−1 over the previous 5 d period, gave an event sensitivity of 63% (12/19) with a specificity of 85% (in this case specificity is defined as the number of days with a prediction of 'no-event' on the following day divided by the total number of days on which a prediction could be made). There were no major differences between the three illustrative rules, but given that this is a pilot data set with a sample number of events, it would be hard to reliably identify a consistently optimal classifier without the risk of overtraining.

Figure 6. Receiver Operator Characteristic curves for the detection of exacerbations based on changes in respiration rate. Three rules are illustrated: (a) changes in median rate of x, (b) changes in the mode of respiration rate values of x, and (c) change in either median or mode by x breaths min−1. The sample operating point chosen is for a change in the mode of the respiration rate equal to x = 1 breath min−1 compared to the previous five nights. As smaller values of x are increased, the sensitivity increases, but the specificity decreases. The Area Under Curve values (AUCs) of the three classifiers are 0.84, 0.82 and 0.86 respectively.
Download figure:
Standard image High-resolution image
4. Discussion
The purpose of this paper was to introduce a new tool for measurement of overnight respiration rate in ambulatory subjects, to provide some initial validation of its accuracy under controlled conditions, and to carry out pilot observations of nocturnal respiration rates in a clinical population of interest. We believe that such monitoring may play a useful role as part of a broader connected health infrastructure (Caulfield and Donnelly 2013).
To our knowledge, there have been no reports of longitudinal respiration rate monitoring in the home environment using a completely 'untethered' system. However, Yañez et al were able to report on respiration rates in COPD patients who were on home oxygen therapy (HOT) (Yañez et al 2012). In such a case, the oxygen concentrator unit (VisionOx, Air Products) is able to report a respiration rate based on observations of the oxygen flow. Based on these respiration rates, Yañez et al developed a post-hoc rule to correlate changes in respiration rate with subsequent ECOPD events. In their case, an empirical rule of an increase of 2.3 breath min−1 had a sensitivity of 72% and a specificity of 77%.
However, in this study as in ours, a respiration increase is generally associated with ECOPD, but there appears to be a cohort of patients who may not show this increase, and where more subtle respiratory markers may be required.
To place some clinical context on this, others have tried alternate home measurements of respiratory function to predict ECOPD. For example, Shu et al (2008) and Hurst et al (2010) showed some promising results with overnight oximetry. Hurst et al noted a sensitivity of 71% and specificity of 74% when using a measurement which combined SpO2 and heart rate. However, patients may not tolerate overnight oximetry and required peak flow measurements on a continuous daily basis. Daily monitoring of patient reported symptoms has also proven to be not particularly reliable in the prediction of ECOPD events (Calverley et al 2005). In a recent paper, Xie et al developed a classifier to determine 'high-risk' and 'low-risk' for COPD exacerbation based on combinations of intermittent measurements of heart rate, SpO2, blood pressure, weight and temperature (Xie et al 2013). No single physiological parameter proved to be clearly superior, with SpO2 and distaolic blood presuure proving most effective. They reported an accuracy of approximately 80% in determining the low/high risk classification, but the 'high-risk' status does not necessarily imply a pending exacerbation.
An alternative technology which could potentially provide robust estimate of nocturnal respiration rate are under-mattress piezoelectric sensors. For example, the Earlysense 2 system has been reported as a potentially useful tool for tracking respiration rate in a convenient manner (Bennett and Gorodeski 2012).
There are quite a number of limitations to the interpretation of the clinical aspects of the study. Sleep disturbance is a common symptoms reported by COPD patients, reportedly occurring in ~40% of cases (Rennard et al 2002) so the respiration rates may reflect a mixture of waking and sleeping rates. The presence of sleep disordered breathing may also impact the estimation of breathing rate as the net effect of apneas plus recovery breathing on median and mode respiration rate is unknown. In this cohort, five patients (25%) had confirmed SDB, and four may have used CPAP or bilevel PAP during the observation period. Due to the small scale pilot nature of the study, there was no independent event review committee on COPD exacerbations; in practice, these are typically complex patients with co-morbid conditions, and clinical events will not be 'clean'. We have used this pilot data to design a larger scale study in which these clinical limitations will be overcome.
A further potential area of exploration is to consider the development of rules based on segments of the overnight respiratory rate. It has been observed by previous researchers that respiratory rate dynamics vary as a function of sleep stage (Rostig et al 2005). For example, there may be a higher rate and variability during REM compared to non-REM stages. Therefore, there may be additional discrimination that can be determined by measuring respiration rates associated with a particular stage of sleep rather than averaging over the entire night. However, this would require robust segmentation of the signal into various sleep stages, and we believe that a system based on summary of the whole night into one measure may be more robust.
To conclude, we have described the operation of a non-contact radio-frequency based biomotion sensor, which can be used to measure respiration rate in the home environment over prolonged periods of time, with minimal patient effort. The algorithm to estimate respiration rate (Adaptive Notch Filter) has been shown to be accurate with respect to human expert scored respiration rate from gold standard signals. When deployed in a pilot clinical study of COPD patients, it can be suggested that increases in nocturnal respiration rate are related to exacerbations of COPD; however a larger scale study will be needed to validate the achievable performance of such an approach, and most likely the nocturnal respiration rate parameters will need to be combined with other clinical information to provide a robust tool for clinical care.