
Abstract
Endothelial dysfunction assessment has received considerable attention due to its potential in early screening of cardiovascular diseases. Since the seminal work by Celermajer in flow-mediated dilation (FMD) based on B-mode ultrasound measurement of the brachial artery dilation following limb ischemia, many attempts have been made toward applying this method to clinical, non-invasive endothelial dysfunction assessment. One major obstacle toward achieving this objective has been the relative high cost of the required setup and skilled manpower. Such limitations have prompted the investigation of other non-invasively accessible signals such as the photoplethysmogram (PPG) in relation to FMD. It is in the above context that this paper proposes to use a modified version of an existing differential model of the human upper vasculature in order to discriminate between healthy and diabetic subjects. PPG from 46 subjects (23 healthy and 23 diabetic) were utilized to identify the model parameters. Once the model parameters were identified, singular value decomposition was applied to reduce the number of features and increase the separability. Finally, a naive Bayes classifier resulted in an overall accuracy of 93.5% (Spec. 87.0% and Sens. 100%). Taking into account subjects' gender further improved the overall accuracy. It is thought that the application of the proposed method to endothelial dysfunction assessment may positively impact the deployment of FMD in clinical settings.
Export citation and abstract BibTeX RIS
1. Introduction
The endothelium is a single layer of cells covering the internal surface of blood vessels and other anatomical structures such as heart valves (Verma and Anderson 2002). By releasing chemical substances such as nitric oxide (NO), the endothelial layer controls blood pressure via changing the vessel diameter and keeps blood coagulation balanced (Sejda et al 2005). Endothelial dysfunction is commonly referred to the disability of this layer to dilate vessels (Anderson et al 1995). It has been established that there is a close relationship between coronary artery disease and endothelial dysfunction even before clinically detectable manifestations of stenosis (Sejda et al 2002). Cardiovascular risk factors such as hypertension, high cholesterol and diabetes cause eventually endothelial dysfunction (Bonetti et al 2003, Iiyama et al 1996, Pellegrino et al 2005), which may in turn be used as a warning sign of early arterial stenosis (Cox et al 1989). Therefore, detecting of the onset of vessel impairments can assist the diagnosis of atherosclerosis at an early stage, making treatment more efficient.
Endothelial function (EF) assessment can be done by using Doppler for blood flow measurement in the coronary artery in response to infusion of vasodilators, which may be pharmacological substances (e.g. nitroglycerin, isosorbate dinitrate, bradykinin or acetylcholine). Since these methods require injection, they are unsuitable for studies involving asymptomatic subjects and multiple measurements for the same individual. It was the introduction of a pioneering technique (Celermajer et al 1992) which offered the advantage of being non-invasive and therefore applicable to EF assessment among asymptomatic subjects. The principle is to expose the endothelium to a physical stimuli (shear stress) using the reactive blood flow to ischemia induced by a pressure cuff (Verma and Anderson 2002). In this method, the brachial artery (BA) flow-mediated dilation (FMD) is evaluated using high-resolution ultrasound imaging during reactive hyperemia, a state of transient increase in organ blood flow that occurs following a brief period of ischemia such as arterial occlusion (Klabunde 2012). FMD is calculated as the percentage of the maximum BA diameter change as compared to the baseline (pre-occlusion) diameter (Corretti et al 2002).
Since the pioneering work of Celermajer, it has been established that cardiovascular events occur more often in patients with impaired FMD of the BA (Neunteufl et al 2000, Gokce et al 2002, 2003), which is positively correlated to coronary artery disease (Takase et al 1998, Zhang et al 2000). Being a systemic disorder (Bonetti et al 2003), impairments in large arteries affect small resistance arteries as well (Iiyama et al 1996, Pellegrino et al 2005, Teragawa et al 2005).
Although non-invasive, the major drawback of the ultrasound-based EF assessment (Celermajer et al 1992) is the requirement for a skilled operator to operate the ultrasonic probe in order to get the appropriate imaging plane and accurately measure the vessel diameter (Corretti et al 2002). Furthermore, ultrasonography can be considered only reliable in assessing the EF in vessels of reasonable size (diameter above 2.5 mm) as smaller vessels are difficult to image (Patel and Celermajer 2006).
Other techniques have been introduced to non-invasively assess the EF by the pulse wave analysis (PWA) of the arterial pressure waveforms (Wilkinson et al 2002), or the digital volume pulse acquired from a photoplethysmograph (Millasseau et al 2000, 2002). In these studies, PWA was combined with the administration of vasodilators such as nitroglycerine. More recently, EF was assessed by comparing the pulse amplitude of the photoplethysmogram (PPG) before occlusion and after cuff release accompanied by ultrasonic FMD (Zahedi et al 2008, Selvaraj et al 2009). Although this method does not require a skilled operator, only a modest correlation (about 55%) was found with ultrasound FMD.
In an attempt to investigate the effect of diabetes on the PPG (Shariati et al 2008), a differential model of vascular system (Zahedi and Alauddin 2004) was utilized. Bilateral PPG signals during rest condition and without any stimuli were recorded, and the results showed a sensitivity of 71.7% and specificity of 70.2%.
More generally, bilateral photoplethysmography has been investigated in multiple studies. Multi-site peripheral PPG (ears, thumbs and big toes) measurement only on healthy subjects showed that the PPG from the right and left sides are highly correlated (more than 98%) at each segmental level (Allen and Murray 2000). Peripheral blood pulsations were also recorded from the fingers and toes of both arms and legs with a multi-channel PPG device in control subjects and patients diagnosed with arterial stenosis in a leg. The results showed a high correlation (Pearson's coefficient r = 0.93) between the bilateral differences in the local blood pressure and in the corresponding pulse wave transit time (PWTT) delay, as well as between the PWTT delay and the ankle-brachial index (r = −0.96) (Erts et al 2005). Finally, PPG signals were recorded bilaterally at the big toe sites for diagnosis and grading of lower limb peripheral vascular occlusive disease using a color relation analysis classifier that resulted in high accuracy and 100% sensitivity (Lin 2011).
In this paper, based on a parametric differential approach (Zahedi and Alauddin 2004), the PPG has been modeled with the objective of discriminating between healthy and diabetic subjects. The model was applied to data recorded from both arms, whereas one arm undergoes cuff occlusion and the other serves as control. The rest of the paper is organized as follows: first, the model, setup and database are described. Then the processing tools are reviewed before results are presented. At the end, the discussion highlights the advantages and limitations of this technique.
2. Methods
2.1. Model
The general structure of this model is shown in figure 1, based on Zahedi and Alauddin (2004). In this linear model, a Gaussian white noise (GWN(n), n as the time index) is the input to the heart, modeled by its transfer function (HHeart). The output of the heart is a pressure waveform at the aorta, PAorta(n). This pressure wave propagates along the vascular tree in upper limbs and is therefore affected by their transfer functions (HRA,FMD and HLA). In this study, lower limbs are not considered.
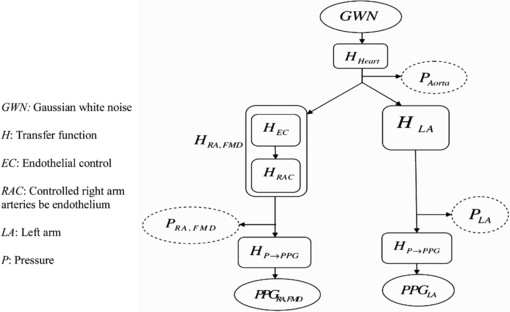
Figure 1. Differential model proposed for evaluation of the endothelial response, after cuff release on the right arm (RA). The dotted lines show pressure signals that are accessible invasively only.
Download figure:
Standard image High-resolution imageThree pressure pulses can be modeled through this model from the same GWN input: PAorta, PLA (LA: left arm) and PRA,FMD (RA: right arm, under shear stress). Briefly, the PPG-FMD procedure consists of 3 min PPG data recording before occlusion, 4 min during occlusion and 5 min after cuff release (in this work, 3 min of post-release PPG was investigated). Cuff occlusion results in ischemia in the blood-deprived arm, which releases metabolites and reduces the overall hydraulic resistance (Corretti et al 2002). Once the cuff is released, the sudden inflow of blood creates a shear stress which stimulates the endothelial layer (Takase et al 1998, Teragawa et al 2005). After cuff release, the total transfer function of the right arm (HRA,FMD) is modeled as a combination of endothelial control (HEC) and controlled transfer function of right-hand arteries (HRAC). The separation of HRA,FMD into two parts allows us to emphasize on how does the reactive hyperemia stimulus force the endothelial layer to respond. It should be noted that in this research, HEC and HRAC are not treated individually; they are shown with the only purpose of a better understanding of how the FMD test affects the vascular function. Their lumped effect is considered as HRA,FMD.
Three pressure points indicated in figure 1 denoted by PAorta(f), PLA(f) and PRA(f) respectively in the frequency domain can be computed by


where HHeart, HLA and HRA,FMD are the transfer functions of the heart, left arm and right arm respectively (HRA,FMD: after cuff release). The PPG arises from blood pressure changes at the fingertip. Therefore, the relationship between the pressure waveform and the PPG can be defined by another transfer function, HP→PPG, and it is assumed that this transformation is the same at both left and right fingers (Reisner et al 2008). Omitting the frequency variable (f) for simplicity and with PPGLA, PPGRA,FMD denoting the Fourier transform of PPGLA(t) and PPGRA,FMD(t),


To eliminate the effect of the heart as the main source, a differential approach is applied (Zahedi and Alauddin 2004). The left-arm PPG is considered as the input and the right-arm PPG as the output:

It should be noted that the resulting transfer function (6) between left and right arms would not be physiological. Finally, figure 2 shows the proposed framework in order to illustrate the transition state from the rest PPG signal to the state where the endothelial layer is stimulated using shear stress.
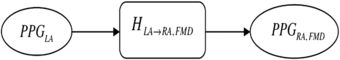
Figure 2. Final model. Input: left-arm PPG. Output: right-arm PPG.
Download figure:
Standard image High-resolution image2.2. Subjects
This study met the principles outlined in the declaration of Helsinki (World Medical Association, Inc., 1997) and received local ethics committee approval and all subjects signed a written informed consent (Zahedi et al 2008). A total of 23 healthy subjects (14 females and 9 males, aged 49.6 ± 9.1 years) and 23 diabetic subjects (11 females and 12 males, aged 59.2 ± 11.9 years) were retained for the experiment. Systolic and diastolic pressures were measured for each subject before the blockage of the BA (cuff occlusion). For practical reasons, the definition adopted in this work for healthy subjects was them to be free from major cardiovascular risk factors (cigarette smoking, hypertension defined by BP > 140/90 mmHg, diabetes defined by a fasting blood sugar > 6.0 mmol L−1 or HbAlc > 6.5 mmol L−1, hypercholesterolemia defined by a total cholesterol > 5.2 mmol L−1 or LDL > 3.0 mmol L−1, and obesity defined by body mass index > 30.0). Healthy subjects were recruited by approaching employees at recording venues, respecting the ethical norms enumerated above. The data were recorded at three locations in Malaysia: the hospital of the National University of Malaysia (Universiti Kebangsaan Malaysia-Cheras campus), the International Medical University (Seremban campus) and at the health clinic of the National University of Malaysia (Bangi campus). The glucose level in the diabetic group was 9.7 ± 3.5 mmol L−1; the median and interquartile range for the duration of diabetes were 2 and 4 years, respectively. A few of the diabetic subjects had other cardiovascular risk factors such as smoking, hypertension and obesity. Subjects were asked not to consume food, alcohol and caffeine for 4 h before the experiment in order to avoid known vasodilatation effects from these substances (Corretti et al 2002).
2.3. System setup
Two independent, custom-made PPG systems based on commercial modules (Dolphin Medical, Inc.) were utilized to acquire data from the right and left index fingers (for simplicity these two systems have been represented by a single box in figure 3). PPG signals were acquired at a sampling rate of 275 Hz and 16-bit resolution. In order to synchronize the two PPG systems, an external module (Zahedi and Alauddin 2004) was used. The infrared channel of the PPG signal was selected due to its higher signal-to-noise (SNR) power. All data were saved in ASCII form on a personal computer for further analysis.
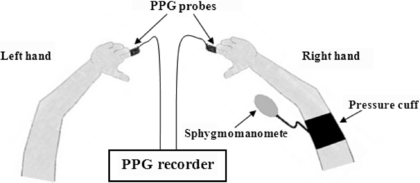
Figure 3. Recording setup: pressure cuff affixed to the right arm and PPG probes to both index fingers. Control arm: left arm.
Download figure:
Standard image High-resolution image2.4. PPG FMD procedure
Subjects were asked to remain in a supine position for about 10 min before the test and remain still during PPG recording. Immediately before the test, the systolic and diastolic blood pressures were measured. Finger PPG probes were fixed to the left and right index fingers, the cuff being placed above the elbow (figure 3). Data acquisition started by recording 3 min of bilateral PPG before cuff inflation to obtain the baseline PPG.
The cuff was then inflated to 30 mmHg higher than the systolic pressure and remained in this state for 4 min. Finally, the cuff was suddenly deflated and 5 min post-release PPG data were recorded.
2.5. Pre-processing
Given that frequencies higher than 15 Hz contain little information in the PPG (Reisner et al 2008, Allen 2007), digitized PPG signals were passed through a digital 20 Hz low-pass filter to remove high frequency noise and to prevent aliasing during down sampling. On the other hand, since our objective was to assess cardiac induced changes during the FMD test, drifts and trends of the PPG that are related to respiratory and sympathetic nervous system were also removed by passing the signals through a digital 0.6 Hz high-pass filter. Finally, all signals were down-sampled from 275 to 110 Hz to prevent 50 Hz noise aliasing of frequencies below the Nyquist rate and reduce data length to make computations easier. All digital processing was done offline using MATLAB.
2.6. System identification
By means of the framework illustrated in figures 1 and 2, system identification techniques (Ljung 1999) were used to extract the model's parameters. The input of the system to be identified consists of the PPG immediately after cuff release from the left index finger (control hand = without endothelial stimuli). The output of this system is the simultaneously PPG recorded from the right index finger (with endothelial stimuli). A fourth-order output-error model structure was found to give satisfactory results, as higher orders resulted in less than 3% improvement on fitness defined by

where ym is the model output and yr is the recorded output. The model input–output relationship is given by

where u(t), y(t) and e(t) are the input, output and Gaussian white noise respectively. B(q) and A(q) are the time shift operators defined by

where ai and bi (i = 1,2,3,4) are the parameters of the system. As the response of the endothelial layer to a cuff occlusion stimuli occurs mostly within the first 3 min after releasing the cuff (Zahedi et al 2008, Selvaraj et al 2009), 3 min of immediate post-release left and right PPG were used to identify the model parameters. A total of eight coefficients [b1, b2, b3, b4, a1, a2, a3, a4] are thus available as the model representation for each subject. A sample of modeled and measured output is shown in figure 4.
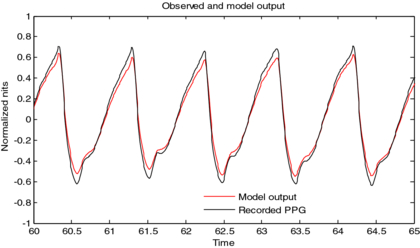
Figure 4. One sample of measured output (right index finger PPG after cuff release) and model output. The fitness for the whole 3 min = 85.8%.
Download figure:
Standard image High-resolution image2.7. Dimension reduction using singular value decomposition
Singular value decomposition (SVD) has been extensively used for dimension reduction in pattern recognition and information retrieval applications (Theodoridis and Koutroumbas 2008). A brief overview of this technique is given below for the benefit of the reader. Given an l × n matrix X of rank r (r ≤ min{l, n}), there exist unitary matrices U and V of dimensions l × l and n × n respectively, such that

where Λ1/2 is the diagonal matrix with λi1/2 elements, and λi are the r nonzero eigenvalues of the associated matrix XHX. By means of these matrices, it is possible to expand an approximate representation of X using less than r terms in reconstruction. The error in the approximation is the sum of the unused singular values (Theodoridis and Koutroumbas 2008). Unlike principal component analysis (PCA), the SVD components may show some degree of correlation. To decompose the features matrix (X), we used all records from healthy and diabetic subjects together. The size of the feature matrix for each group being 8 × 23, by horizontally concatenating these matrices a size of 8 × 46 is obtained for X. The sum of the first three singular values was found to be more than 90.1% (for healthy subjects) and 99.2% (for diabetics) of the total sum for the eight singular values. In order to determine the optimum number of SVD components, this number was varied and it was observed that using four SVD components instead of three did not improve the performance of the classification. Further increasing the number of components to above four resulted in even worse performance. It was concluded that the optimum number of SVD components in this feature space would be three, and the eight primary features from (9) were reduced to three. To reduce the number of features from eight to three, the classical SVD method was employed using the transformation matrix T as follows:
The transformation matrix T was computed once and then used to generate feature vectors with lower dimension. The product of transformation matrix T and the 8 × 46 features matrix X produced the new features matrix with a size of 3 × 46, reducing the number of features to three for each subject. Interestingly enough, a 3D plot of these SVD-generated features (figure 5) revealed that each group's features are contained within a plane.
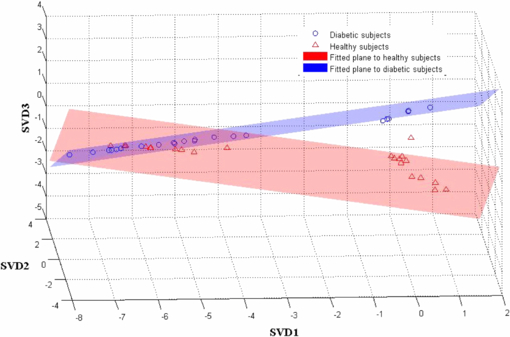
Figure 5. 3D scatter plot of SVD1, SVD2, SVD3 and fitted planes, within each group (healthy/diabetic).
Download figure:
Standard image High-resolution imageUsing the least-squares method, the equation for the plane representing the locus of the SVD-reduced parameters in healthy subjects was obtained as

with a sum of squared errors (SSE) of 0.21, whereas for the diabetic group the fitted plane is

with an SSE of 0.04.
2.8. Statistical analysis
The normality of the SVD-generated features was confirmed by the one-sample Kolmogorov–Smirnov (KS) test; therefore, a t-test was used for statistical analysis. A p-value <0.05 was considered statistically significant. A Levene's test confirmed that the equality of variance can be assumed for SVD3 only (p-value <0.05); thus, this consideration has been taken into account for reported values for the t-test. Statistical tests were performed using the MATLAB (Mathworks, Inc.) statistics toolbox and IBM SPSS Statistics (IBM, Inc.).
2.9. Bayesian classifier for two classes with normal distribution
A Bayesian classifier has been utilized with two classes (ωi, i = 1, 2) as it is optimal with respect to minimizing the classification error probability. Having normally distributed feature vectors for each group (healthy/diabetic), the multivariate generalization of a Gaussian pdf in the three-dimensional space can be used. The likelihood probability density functionsp(x|ωi), i = 1, 2., were determined by the approximated mean value vector and covariance matrix within each group. As there are an equal number of subjects in each group (N = 23), the a priori probabilities P(ω1) and P(ω2) are assumed to be equal to 0.5 (Theodoridis and Koutroumbas 2008). The Bayes classifier was applied on the first three significant components of SVD (SVD1, SVD2 and SVD3) for all subjects. In order to obtain a reliable estimate of the true performance of our technique, any possible bias (choosing particularly easy or difficult instances into training or test data) was removed using the leave-one-out cross-validation (LOOCV) method (Theodoridis and Koutroumbas 2008).
3. Results
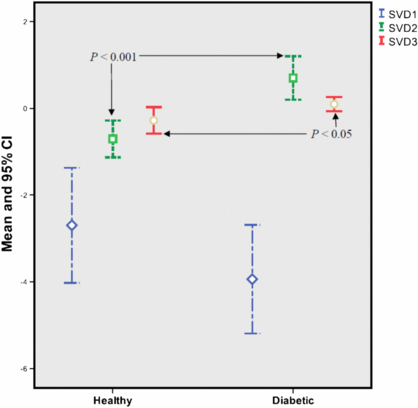
Figure 6 shows the mean of the first three SVD-generated features and their 95% confidence intervals. A p-value <0.05 was obtained for the third SVD component, whereas the second component resulted in p <0.001. Table 1 summarizes the numerical results.
Figure 6. Mean and 95% confidence interval (CI) of the first three SVD components for each group of subjects (healthy/diabetic).
Download figure:
Standard image High-resolution image
Table 1. Mean, standard deviation and p-value of each SVD component for two groups.
| SVD component | |||
|---|---|---|---|
| Group | SVD1 (mean ± std) | SVD2 (mean ± std) | SVD3 (mean ± std) |
| Healthy (N = 23) | −2.7 ± 3.1 | −0.7 ± 1.0 | −0.3 ± 0.7 |
| Diabetic (N = 23) | −3.9 ± 2.9 | 0.7 ± 1.2 | 0.1 ± 0.4 |
| p-value | 0.164 | 0.0001 | 0.031 |
Next the accuracy, sensitivity and specificity were computed according to the following equations:


where true positive (TP) and false positive (FP) are the number of correctly and incorrectly classified patients, respectively. True negative (TN) and false negative (FN) are the number of correctly and incorrectly classified healthy subjects, respectively.
Table 2 shows the results when a naive Bayes classifier was applied on the first three significant components of SVD (SVD1, SVD2 and SVD3) for all subjects. When subjects are separated according to their gender (second and third rows in table 2), a considerable improvement is realized in the classification. It can be noted that the overall accuracy in the male group is higher than that for the female group.
Table 2. Classification results for the naive Bayes classifier.
| Gender | Number of subjects | Accuracy (%) | Specificity (%) | Sensitivity (%) |
|---|---|---|---|---|
| Both | 46 (23 healthy, 23 diabetic) | 93.5 | 87.0 | 100 |
| Male | 21 (9 healthy, 12 diabetic) | 100 | 100 | 100 |
| Female | 25 (14 healthy, 11 diabetic) | 96.0 | 92.9 | 100 |
4. Discussion
The main objective of this research was to investigate changes in the upper limb vascular system following a stimulus to endothelial layer cells by induced shear stress. The shear stress was created by provoking local ischemia, and the effect of the resulting FMD was investigated amongst 23 diabetics (with at least one cardiovascular risk factor) and 23 healthy subjects. This evaluation was performed using a differential modeling of cardiovascular system that uses bilateral PPG. Results point to the fact that when the vascular system is stimulated, by measurement of its response, its state can be efficiently identified with a relatively good accuracy (93.5%). When gender is taken into consideration, results are further improved.
Although ultrasound FMD is a relatively established method to assess EF in research settings, there are still many obstacles rendering its clinical use unacceptable for physicians. A technique that could potentially eliminate the need for a very costly and operator-dependent ultrasound system can be considered a step forward to establish FMD as a clinical test procedure. In spite of many research studies toward this replacement (Zahedi et al 2008, Selvaraj et al 2009), none has yet achieved high correlation (e.g. above 80%) between PPG-FMD and US-FMD. Generally, in these studies, the PPG waveform is morphologically investigated to estimate the BA diameter. One hypothesis regarding the major hindrance to achieve this objective is the auto-regulation process in small arteries at the fingertip (Klabunde 2012) that causes the amplitude of the PPG response to be tens orders of magnitude greater than BA diameter changes (Zahedi et al 2008). In the present work, the PPG-FMD process was modeled from a systemic point, and subsystems contributing to shape blood volume changes at the fingertip were part of the whole model. Results show that the effect of the auto-regulation on the PPG during FMD seems interestingly taken into account by our model, and corresponding classification results confirm the hypothesis that the auto-regulation mechanism is heavily affected by diabetes.
Our work shows some improvement over a previous tentative to investigate the effect of diabetes on PPG (Shariati et al 2008) using a differential vasculature model. This highlights the importance of using a stimulus to elicit a response allowing for a discrimination between the two groups of subjects. Another interesting point is that whereas gender-based classification resulted in better classification in our work, in Shariati et al (2008) gender-based classification results in lower accuracy.
One of the limitations of this work that needs to be overcome in future investigations is to use age-matched groups. Indeed, age has been shown to play a relatively important role in the genesis of vascular dysfunction (Lakatta 1990) and needs to be eliminated as a confounding factor by selecting age-matched subjects. In practice, this means having access to a very large pool of volunteers and choosing those who fit the age criteria.
There are many ways to improve feature discrimination between classes, namely feature selection and generation. While PCA is a feature generation method based on second-order statistics, SVD employs a limited number of observations to construct a transformation matrix. This may explain why using PCA leads to poor results. By means of SVD, over 90% of the total sum of singular values is compacted into just three features and this may explain our high classification results.
Most of the subjects in this study are at early stages of the disease (duration of diabetes is less than 2 years), and our results confirm the hypothesis that the changes in cardiovascular system could be detected by our differential modeling. Although here we concentrate only on diabetic subjects, other cardiovascular risk factors could be considered as well to investigate the detectability of changes on the EF at early stages.
5. Conclusion
The dysfunction of endothelial cells is a sign of cardiovascular disease that precedes other clinical symptoms. Thus, the investigation of this response helps to diagnose these diseases at early stages. Our results confirm the hypothesis that cardiovascular impairments due to diabetes may be detected through a non-invasive and inexpensive PPG-FMD test, using differential modeling of the upper limb cardiovascular system.
The high sensitivity (100%) of our model when gender is taken into account warrants more investigation by especially increasing the sample size. However, this method looks promising in the detection of endothelial dysfunction.
Further work is needed to investigate the accuracy of this method in larger sample sizes. Besides diabetic subjects, a future step would be to investigate this model on subjects with other cardiovascular risk factors. Finally, due to the effect of age, age matching should be ensured to further ascertain the validity of the results.
Acknowledgments
The authors would like to thank the reviewers for sharing their comments, which considerably improved the quality of the paper. They are also grateful to the National University of Malaysia (Universiti Kebangsaan Malaysia), Faculty of Engineering and Built Environment for kindly providing access to the data for this study. This work has been partially funded by the Iranian National Science Foundation (INSF) grant number 87041735.