
Abstract
The aim of the present study was to determine if the patterns of mechanomyographic (MMG) amplitude across force would change with strength training. Twenty-two healthy men completed an 8-week strength training program. During three separate testing visits (pre-test, week 4, and week 8), the MMG signal was detected from the vastus lateralis as the subjects performed isometric step muscle actions of the leg extensors from 10–100% of maximal voluntary contraction (MVC). During pre-testing, the MMG amplitude increased linearly with force to 66% MVC and then plateaued. Conversely, weeks 4 and 8 demonstrated an increase in MMG amplitude up to ∼85% of the subject's original MVC before plateauing. Furthermore, seven of the ten force levels (30–60% and 80–100%) showed a significant decrease in mean MMG amplitude values after training, which consequently led to a decrease in the slope of the MMG amplitude/force relationship. The decreases in MMG amplitude at lower force levels are indicative of hypertrophy, since fewer motor units would be required to produce the same absolute force if the motor units increased in size. However, despite the clear changes in the mean values, analyses of individual subjects revealed that only 55% of the subjects demonstrated a significant decrease in the slope of the MMG amplitude/force relationship.
Export citation and abstract BibTeX RIS
Introduction
When a skeletal muscle contracts, the fibers vibrate, causing pressure waves to be transmitted outward (Herroun and Yeo 1885, Gordon and Holbourn 1948, Barry 1990). Lightweight accelerometers, laser displacement sensors, piezoelectric transducers, or condenser microphones can be used to detect the pressure waves at the surface of the skin (Beck 2010). The measurement of these pressure waves from the surface of the skin is referred to as surface mechanomyography (MMG) and its amplitude is considered to be reasonably reliable during isometric muscle actions (Watakabe et al 2003, Herda et al 2008) but slightly less reliable during dynamic muscle actions (Stock et al 2010a, 2010b, 2010c).
Evidence suggests that as force increases, the MMG amplitude increases with the recruitment of additional motor units (Orizio et al 1989). Once maximal motor unit recruitment has been achieved, the muscle depends on rate coding (i.e. increases in motor unit firing rates) to continue to increase force (Kukulka and Clamann 1981). Consequently, the MMG amplitude typically plateaus once all motor units have been recruited. In many cases, MMG amplitude may even decrease at high force levels due to muscular stiffness limiting the pressure waves (Orizio et al 1989). The relative force level where motor unit recruitment is complete is dependent on the muscle (Kukulka and Clamann 1981). More specifically, small muscles used for fine motor control, such as the first dorsal interosseous or adductor pollicis, only rely on recruitment to increase force up to approximately 30–50% of maximal voluntary contraction (MVC) (Kukulka and Clamann 1981, De Luca et al 1982). They are considered maximally recruited at 30–50% MVC and, therefore, rely on rate coding to produce more force. Conversely, large muscles used for gross movement, such as the deltoid or biceps brachii, will recruit additional motor units up to force levels as high as 80–90% MVC (Kukulka and Clamann 1981, De Luca et al 1982). Since it has been suggested that the two phases (i.e. linear increase and plateau) in MMG amplitude across force reflect motor unit recruitment and then rate coding (Orizio et al 1989), differences between large and small muscles should, accordingly, be demonstrated by MMG. In support of the hypothesis by Orizio et al (1989), studies have shown that the crossover point between the linear phase and the plateau phase occurs at lower force levels in small muscles (Madeleine et al 2001, Akataki et al 2003) and as expected, at higher force levels in large muscles (Orizio et al 1989, Akataki et al 2003).
Despite the significant evidence explaining the underlying mechanisms behind changes in MMG amplitude across force, there have been no studies that have successfully demonstrated the changes that would be expected from a strength training program. One study (Ebersole et al 2002) measured MMG amplitude prior to and after 8 weeks of isometric training, but did not show any changes. The aim of the present study was to see if the patterns of MMG amplitude across force would change with strength training, as would be expected by the above mentioned hypothesis. We hypothesized that, after strength training, fewer motor units would be needed to produce the same absolute force levels, therefore leading to a decrease in the slope of the MMG amplitude versus force relationship.
Methods
Study design
Each subject came to the laboratory and trained 3 days per week for 8 weeks. The training sessions were always 48 h apart. MMG testing was performed prior to training (PRE), during week 4 (W4), and after the eight weeks of training (W8). A second pre-test was performed, but solely for the purpose of calculating the test–retest reliability of the measurements. During the third visit of each testing week, the subjects performed the MMG step-contraction testing procedure described below prior to performing their training.
Subjects
Twenty-two healthy men (mean ± SD age = 21.7 ± 3.7 years) volunteered to participate in this investigation. Each participant completed an informed consent and a pre-exercise health and exercise status questionnaire. The questionnaire had to indicate no current or recent (within the past six months) neuromuscular or musculoskeletal problems to the knees, hips, or lower back for the subject to be considered eligible for the study. In addition, each subject had to be untrained in resistance exercise (i.e. no participation in an organized weight training program for at least the last six months prior to the study). The study was approved by the University Institutional Review Board for Human Subjects prior to testing.
Procedures
Resistance training and testing
During their first visit, the subjects were familiarized with the leg press and bench press exercises. This allowed the inexperienced participants to become accustomed to proper lifting technique and also allowed the investigator to find an approximate estimate of the one-repetition maximums (1-RMs) for each participant. On their next visit, the subjects performed a 1-RM test on the leg and bench presses. Each subject was allowed to warm-up with progressively heavier weights prior to the first attempt. The 1-RM was established to the nearest 5 lbs within —five to six attempts to avoid fatigue and used to assess baseline strength levels for the resistance training program. The training program consisted of the bilateral incline leg press, bilateral leg extension, and bench press exercises performed 3 days per week for 8 weeks. Eighty percent of the subject's 1-RM was used for their starting weight. Each subsequent set throughout the program was adjusted as needed. Each exercise was performed for three sets to failure with the goal of failure occurring between 8–12 repetitions. Therefore, the weight was adjusted set by set if the subject's load proved to be too heavy (<8 repetitions) or too light (> 12 repetitions).
Isometric strength testing
During both pre-testing sessions, as well as during weeks 4 and 8, the subjects performed maximal and submaximal isometric muscle actions of the dominant leg extensors. The strength measurements were performed with the subjects seated in a customized chair, and with the leg attached to a load cell (LC101 Series, Omega Engineering, Inc., Stamford, CT) to measure isometric leg extension force (kg). All isometric muscle actions were performed at a joint angle of 120° between the thigh and the leg (180° = full extension). Following multiple submaximal warm-ups, the subjects performed two maximal muscle actions to determine their MVC. The subjects then completed nine randomly ordered submaximal muscle actions from 10–90% of MVC. Visual feedback was provided along with a target template during each submaximal muscle action to ensure that the force output was within ±5% of the target force level. The isometric force was held steady at the target force level for at least 6 s. Each muscle action was separated by 2 min rest periods. During subsequent testing sessions (W4 and W8), the subjects retested their MVC, but performed the submaximal muscle actions at the same absolute force levels as their pre-testing (so 10–90% of the subject's original MVC, not their new MVC). If the subject's MVC increased, then the force value corresponding to their original MVC was added as an additional submaximal muscle action.
MMG testing
During each muscle action, MMG signals were detected from the vastus lateralis (VL) muscle by securing an accelerometer (PCB Piezotronics, Model 352A24, bandwidth = 1.0 to 8000 Hz, dimensions = 0.19 × 0.48 × 0.28 inches, mass = 0.8 g, sensitivity = 100 mV g−1) to the surface of the skin over the VL. The sensor location on the skin was prepared by shaving and cleansing with rubbing alcohol prior to securing the accelerometer with double-sided sticky tape. The location was defined as 2/3 the distance from the anterior superior iliac spine to the lateral border of the patella. The site was marked with permanent marker on each visit (including training sessions) to ensure consistent sensor placement across time.
Signal processing
The raw MMG signals were sampled at 2000 Hz and bandpass fitered (zero-lag, fourth-order Butterworth) with a pass band of 5–100 Hz. A 1 s epoch was selected from the 6 s steady-force portion of each muscle action. MMG amplitude (m s−2) was calculated as the root mean square for each 1 s epoch. All processing was performed using a custom-written program using LabVIEW programming software (version 8.2, National Instruments, Austin, TX, USA).
Statistical analyses
A two-way repeated measures (force × time) ANOVA was used to examine MMG amplitude changes across force at each time point. Linearity of the MMG amplitude versus force relationship was determined by linear regression for each subject and time point. Since MMG amplitude commonly plateaus at high force levels (see figure 1), only the linear, submaximal (10–60% MVC) portion was used for the linear regression analyses. In addition, a separate linear regression was applied to the high-force plateau region (80–100% MVC), extrapolated out to lower force levels, and overlaid on top of the original, low-force linear regression (see figure 1(B)). The intersection of these two lines quantifies the cross-over point from a linear increase to a plateau. Two separate one-way repeated measures ANOVAs were used to examine the linear slope coefficients and y-intercepts across time. Bonferroni pairwise comparisons were used for post-hoc follow-up analyses. The linear slope coefficients and y-intercepts for the MMG amplitude versus force relationship for each subject were compared between the time points using the procedures described by Pedhazur (1997). This was done in addition to the group mean comparisons because the individual variability in MMG amplitude patterns across force can be high (Ryan et al 2007, Beck et al 2009). This tests the differences among regression coefficients by producing a common regression coefficient between the two conditions being tested. The test then determines if the increment in the regression sum of squares due to the use of separate slopes is significantly different (when compared to the common regression sum of squares). If no statistical difference is found between the two slope coefficients then it can be concluded that a common coefficient could be appropriately applied to both. If the slope comparison from two separate conditions was found to not be significantly different (and therefore parallel) then a follow-up test was run to determine if the y-intercepts were significantly different. As recommended by Pedhazur (1997, p 563), an alpha of p ≤ 0.10 was used for the individual slope and y-intercept comparisons to minimize type II error. An alpha level of p ≤ 0.05 was used for all ANOVA analyses. In addition, data from the two pre-testing sessions allowed test–retest reliability of the MMG measurements to be assessed using paired samples t-tests, two-way fixed-effect intra-class correlations (ICC; model 3,1), the standard error of the measurement, and the minimal difference for a change to be considered real (Weir 2005).
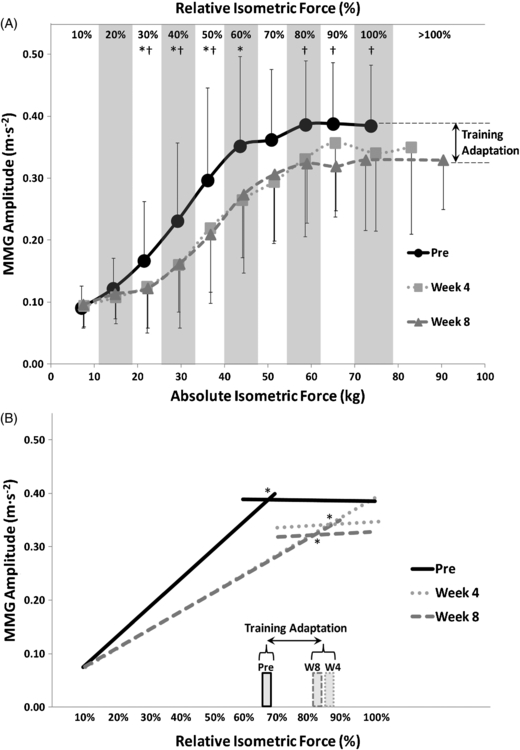
Figure 1. (A) Mean mechanomyographic (MMG) amplitudes across isometric force for three separate time points during an 8-week resistance training program. The error bars represent standard deviation. There is an extra data point (> 100%) during the week 4 and week 8 testing sessions that signifies the new maximal voluntary contraction (MVC). The first ten data points were performed at force levels of 10–100% of the subject's original MVC (from pre-testing). * denotes the force levels in which the pre-testing MMG amplitude was significantly (p < 0.05) greater than at week 4. † denotes the force levels in which the pre-testing MMG amplitude was significantly (p < 0.05) greater than at week 8. At no force level was week 4 MMG amplitude significantly different from week 8. (B) Bi-segmental linear regression was applied to reveal the point at which the positive, linear relationship transformed into a plateau. * denotes that cross-over point for each time point. The vertical bars depict the force level at which that cross-over point occurred.
Download figure:
Standard imageResults
The mean MMG changes with force across the training program are shown in figure 1(A). Included in the figure are the pairwise comparisons. The results showed that the MMG amplitude values during week 4 were significantly less than those from pre-testing at 30–60% MVC. Additionally, the MMG amplitude values during week 8 were significantly less than those from pre-testing at 30–50% and 80–100% MVC. At no force level was week 4 MMG amplitude significantly different from week 8. The linear regression results of the MMG amplitude versus force relationship are shown for each time point in table 1. Figure 1(B) shows the results of the bi-segmental linear regression, intended to demonstrate the cross-over point to the plateau region. One of 22 subjects showed a significant difference in linear slope coefficients between the two pre-testing sessions and was excluded from further analyses. Of the remaining 21 subjects that demonstrated reliable slopes during pre-testing (i.e. no significant difference between pre-tests), 12 demonstrated significant changes in their slopes after training. Therefore, of those 21 subjects that showed reliable pre-tests, 9 did not show a significant change in slope with training. Of those remaining nine subjects that did not show a significant change in slope, four showed a significant change in their y-intercept after training. Results of the test–retest reliability measures are shown in table 2.
Table 1. The mean linear regression coefficients of the mechanomyographic (MMG) amplitude versus force relationship for each time point.
| Pre | Week 4 | Week 8 | |
|---|---|---|---|
| Slope (m s−2 kg−1) | 0.0074 | 0.0049a | 0.0048a |
| y-intercept (m s−2) | 0.0224 | 0.0387 | 0.0409 |
Table 2. Test retest reliability results for mechanomyographic (MMG) amplitude, maximum voluntary contractions (MVC), and the linear regression coefficients for the MMG amplitude versus force relationship from 10–60% MVC. P1 = first pre-testing session; P2 = second pre-testing session; ICC = intraclass correlation coefficient; SEM = standard error of the measurement; MD = minimal difference for a change to be considered real.
| P1 Mean | P2 Mean | ICC3,1 | SEM | MD | p-value | |
|---|---|---|---|---|---|---|
| MMG Amplitude (m s−2) | ||||||
| At 10% MVC | 0.091 | 0.092 | 0.818 | 0.0216 | 0.0423 | 0.739 |
| At 20% MVC | 0.122 | 0.113 | 0.768 | 0.0331 | 0.0647 | 0.245 |
| At 30% MVC | 0.167 | 0.154 | 0.827 | 0.0514 | 0.1004 | 0.268 |
| At 40% MVC | 0.231 | 0.239 | 0.877 | 0.0623 | 0.1220 | 0.547 |
| At 50% MVC | 0.297 | 0.277 | 0.895 | 0.0626 | 0.1223 | 0.150 |
| At 60% MVC | 0.352 | 0.363 | 0.747 | 0.1002 | 0.1962 | 0.599 |
| At 70% MVC | 0.362 | 0.380 | 0.709 | 0.0949 | 0.1855 | 0.395 |
| At 80% MVC | 0.383 | 0.369 | 0.772 | 0.0664 | 0.1298 | 0.339 |
| At 90% MVC | 0.379 | 0.399 | 0.747 | 0.0716 | 0.1396 | 0.248 |
| At 100% MVC | 0.384 | 0.404 | 0.263 | 0.1329 | 0.2593 | 0.488 |
| Slopes (m s−2 kg-1) | 0.0074 | 0.0077 | 0.756 | 0.0025 | 0.0048 | 0.568 |
| y-intercepts (m s−2) | 0.0224 | 0.0120 | 0.615 | 0.0408 | 0.0794 | 0.241 |
| MVC (kg) | 73.7 | 74.7 | 0.951 | 4.3092 | 8.4390 | 0.246 |
Discussion
The results from the present study indicated that resistance training altered both MMG amplitude and its pattern of response across force in previously untrained individuals. Seven of the ten force levels (30–60% and 80–100%) showed a significant decrease in mean MMG amplitude values after training. It has been suggested that the linearly increasing portion of the MMG amplitude/force relationship represents increases in motor unit recruitment, while the plateau or decrease at higher force levels represents rate coding becoming the primary modulator of force output (Orizio et al 1989). Therefore, the decreases in MMG amplitudes shown in the present study at lower force levels (30–60%) likely represented a decrease in motor unit recruitment. Since the same absolute force levels were used throughout the study, this decrease would be indicative of skeletal muscle hypertrophy. Hypothetically, increased contractile protein content would cause each fiber, and therefore each motor unit, to be able to produce more force. So after the occurrence of skeletal muscle hypertrophy, fewer motor units would be required to produce the same amount of force when compared to before training. This hypothesis can be confirmed since muscle cross-sectional area (CSA) was measured with the same subjects in conjunction with the present study, but as a separate experiment (DeFreitas et al 2011). In those findings, both muscle CSA and MVC were significantly greater at week 4 than at pre-testing. As would be expected, the decreases in mean MMG amplitude values at multiple force levels in the present study led to a significant decrease in the slope of the MMG amplitude/force relationship. If the point at which that relationship begins to plateau indeed represents a crossover point from maximal motor unit recruitment to rate coding, then a rightward shift of that point should be expected as a result of strength training (i.e. the point of maximal recruitment should now occur at a higher force level). This was shown in figure 1(B) with the plateau beginning at approximately 66% MVC prior to training and shifting to about 83–87% MVC after training. It should be noted that these results contradict previous findings in which no changes were seen in MMG amplitude for the biceps brachii after 8 weeks of training (Ebersole et al 2002). However, it is possible that the disparity may be accounted for by differences in the training protocol; the subjects in Ebersole et al (2002) performed —three to five sets of isometric training, while the subjects in the present study performed three sets with a dynamic constant external resistance (e.g. leg press) and three sets with a dynamic variable resistance (e.g. leg extension).
Previous findings have suggested the importance of subject-by-subject comparisons when examining MMG amplitude and mean frequency patterns (Ryan et al 2007). This suggestion is due to the high degree of inter-individual variability in the patterns across force. As mentioned previously, tests for differences among regression coefficients were applied to each individual subject's data. This assessment allowed us to determine how many of the subjects showed changes that were similar to those of the group. Twenty-one of the 22 subjects demonstrated a reliable MMG amplitude versus force slope coefficient (i.e. no significant difference between the two pre-testing sessions). Sixteen of those 21 showed a significant change in a regression coefficient with training. However, four of those were changes in the y-intercept, which did not occur for the group mean data (table 1). Overall, 12 of the subjects demonstrated the same training-induced change in the linear slope coefficient that was demonstrated in the group data (table 1). All 22 subjects showed an increase in muscle CSA (DeFreitas et al 2011) and all but one (i.e. 21) improved their MVC. Therefore, the reason for this dichotomy (the 12 that changed in slope versus the 9 that did not) is unknown and cannot be accounted for by lack of changes in muscle size or strength.
Another interesting finding is the decrease in maximal MMG amplitude. As mentioned previously, the 100% MVC value shown in figure 1(A) reflects the same absolute force level at all three trials, based on the pre-testing MVC. Therefore, the decrease in MMG amplitude at later time points is consistent with the increases in strength since that force level would signify a lower percent of MVC after training. However, the values in figure 1(A) depicted as '> 100% MVC' represent the new, stronger MVCs after training, and those maximal MMG amplitude values are also lower than the pre-test MVC value. One possible explanation is that the skeletal muscle hypertrophy was accompanied by an increase in musculotendinous stiffness. An increase in stiffness can lead to both decreases in MMG amplitude (Orizio et al 1989) and increases in force (due to better transmission of force from the fascicles to the tendon). Theoretically, an increase in tissue CSA results in a stiffer material (Butler et al 1978, see figure 10), although it should be noted that this work was performed in tendons and ligaments. Additionally, Klinge et al (1997) showed an increase in musculotendinous stiffness after 13 weeks of isometric strength training. Although this is a convenient and tempting explanation, further research needs to be performed which simultaneously tracks changes in MMG amplitude, muscle size and musculotendinous stiffness with strength training before conclusions can be drawn. It should also be noted that the 100% MVC is the only force trial that did not produce an acceptable reliability coefficient (ICC = 0.26) for MMG amplitude (table 2), which introduces further reservations about drawing any conclusions about the maximal MMG values.
In summary, the mean MMG amplitude values and their pattern across force were altered by the eight weeks of resistance training. There was a decrease in the slope of the linearly increasing portion of the MMG amplitude/force relationship (10–60%), as well as a shift to higher absolute force levels for the plateau in MMG amplitude. Additionally, there was a decrease in maximal MMG amplitude after training. These changes were likely due to skeletal muscle hypertrophy, and possibly even an increase in musculotendinous stiffness. However, for unknown reasons, analyses of individual subjects revealed that only 55% of the subjects demonstrated a significant decrease in the slope of the MMG amplitude/force relationship.