

Abstract
A phase-field model was established to simulate the refinement effect of different morphological factors of second-phase particles such as Al2O3 on the grain growth of AZ31 magnesium alloy during equal channel angular pressing (ECAP) in realistic spatiotemporal evolution. The simulation results agreed well with limited existing experimental data for the ECAP-processed AZ31 magnesium alloy and were consistent with the law of Zener. Simulations were performed to evaluate the influences of the fraction, size, distribution, and shape of incoherent second-phase particles. The simulation results showed that during high-temperature ECAP processes, the addition of 2 wt.% Al2O3 particles resulted in a strong refinement effect, reducing the grain size by 28.7% compared to that of the alloy without the particles. Nevertheless, when the fraction of particles was greater than 4 wt.%, adding more particles had little effect. In AZ31 Mg alloy, it was found that second-phase particles should have a critical size of 0.5–0.8 μm for the grain refinement effect to occur. If the size is smaller than the critical size, large particles will strongly hinder grain growth; in contrast, if the size is larger than the critical size, large particles will exhibit a weaker hindering effect than small particles. Moreover, the results showed that the refinement effect increased with increasing particle fraction located at grain boundaries with respect to the total particle content. However, the refinement effect was less pronounced when the fraction of particles located at boundaries was greater than 70%. Further simulations indicated that spherical second-phase particles hindered grain growth more than ellipsoid particles and much more than rod-shaped particles when the volume fraction of reinforcing particles was 2%. However, when the volume fraction was greater than 8%, rod-shaped particles best hindered grain growth, and spherical particles exhibited the weakest effect.
Export citation and abstract BibTeX RIS
1. Introduction
In recent years, magnesium alloys as the lightest structural materials, have attracted attention because of their excellent castability and machinability. These alloys have broad application prospects in automotive, aerospace, 3C products, and other industries. However, these alloys exhibit relatively low strength and poor plasticity at room temperature because of the presence of limited slip systems stemming from their hexagonal close-packed crystal structure [1–3]. The yield strength, tensile strength, and plasticity of magnesium alloys are adversely affected by increasing grain size [4, 5]. Therefore, controlling the grain size is one of the major goals for magnesium alloy microstructure design.
Equal channel angular pressing (ECAP), which is a severe plastic deformation method for effectively producing ultrafine grains, has been widely used on many metals to produce ultrafine-grained materials [6–8]. Yamashita et al reported that pure Mg and Mg–0.9% Al can only be ECAP deformed at or above 673 K and 473 K, respectively, to avoid cracking [9]. Mueller et al studied the microstructure of AZ31 deformed by equal channel angular extrusion at different temperatures and observed that the average grain size was 2–3 μm, 3–5 μm, and 15–20 μm at temperatures of 473 K, 523 K, and 573 K, respectively [10]. Because of their low plasticity, magnesium alloys must be ECAP deformed at rather elevated temperatures, so grain growth during ECAP becomes a notable problem [9–11].
Second-phase particles such as precipitates and insoluble inclusions strongly affect the mobility of grain boundaries, known as Zener pinning [12], which consequently arrests grain growth. Many investigators have attempted to stabilize Mg alloys at high temperatures by introducing second-phase particles via compound addition or in situ reaction. Guo et al investigated the addition of Si to an AZ31 Mg alloy ingot [13]. They observed that Si reacted with the Mg matrix to form thermally stable in situ Mg2Si particles during melt infiltration; these finer thermal-stable particles decreased the mobility of grain boundary during the cyclic closed-forging process. Radi et al investigated the addition of Al2O3 nanoparticles with an average diameter of 100 nm to AZ31 using a stir-casting method and examined the microstructure of the ECAPed AZ31 and AZ31–1 wt.% Al2O3 [14]. Their results showed that the grain size of AZ31 alloy with Al2O3 nanoparticles was much smaller than that of the AZ31 alloy without particles, and reflected the role of nanoparticles in pinning up grain boundaries.
Limitation of grain growth of AZ31 alloy during ECAP by introducing second-phase particles such as Al2O3 into this alloy seems an interesting research topic but what is the best control of amount and geometric features of the particles remain nearly empty in the literature. However, the experimental method to research effects of the particles on elevated temperature deformation is far more complex and expensive. In contrast, computer simulation is a convenient and flexible approach to explore this problem. The phase field method is a physical and mathematical model that has the capability to predict microstructure evolution phenomena, such as grain growth and solidification [15–18].
To study the effect of second-phase particles on grain growth, Moelans et al modified the free energy term by considering an additional phase field variable to describe immobile and incoherent second-phase particles [19, 20]. Suwa et al improved Moelans' phase field algorithm to simulate the 3D growth of grains containing finely dispersed second-phase particles [21]. Chang et al studied the effect of second-phase particle morphology on inhibiting grain boundary migration using the phase field method [22]. Mallick et al developed a phase field model to simulate grain growth in the presence of mobile second-phase particles and studied their effects on grain growth in a polycrystalline system [23]. However, these previous simulation results were qualitative, where they used iterative steps instead of evolution time and used number of grids instead of real grain metric size, because the parameters, related to the grain boundary range [24, 25] and mobility, were ignored. Therefore, the results do not agree with the experimental results and cannot be applied to a specific alloy system, particularly to study the critical particle size effect.
In this article, we developed a phase field model to simulate the effect of Al2O3 second-phase particles on grain growth in AZ31 alloy during ECAP in industrial scale application of micrometers and minutes based on our previous models [24–26]. A new scheme to determine the free energy of the initial phase and experimental values of the free energy of different equilibrium phases was used in developing the model. The present study aims to use the multiscale phase field model to explore a potential optimal microstructure design of AZ31 alloy with second-phase particles. This study will provide theoretical guidance to best introduce second-phase particles into AZ31 alloy through compound addition or in situ reaction synthesis to enable the refinement of the grain size by ECAP treatment.
2. Model description
2.1. Model fundamentals
Phase field methods are based on thermodynamics and kinetics. The temporal evolution of the microstructure can be determined by solving the time-dependent Allen–Cahn equation [27] and Cahn–Hilliard diffusion equation [28] as follows:


where L and M are structural relaxation and chemical mobility parameters, respectively, ηp(r, t) is the long-range orientation parameter, c(r, t) is the concentration field variable and F is the system's total free energy. The concentration field variable is not independent to the orientation parameter at any position, i.e. the gradient form of the concentration is a function of the gradient form of the orientation parameter. It is equivalent to choose any one of the gradient forms as zero and we choose the concentration one being zero, the same as in [29]. Therefore the expression of an isotropic single-phase system is given by

where f0 is the local free energy density function and K2 is the gradient energy coefficient.
2.2. Figuration of the local free energy density function
ECAP is such a complicated physical process that any attempt to simulate real experimental results gives a huge unrealistic task. However, a phase field model is a flexible tool for investigating the effect of a mechanism on the process by choosing a proper local free energy density function from the experimental data to fix other mechanisms. Therefore, the local free energy density function f0 is the key in the phase field model to simulate a specific real industrial alloy. It requires that f0 should have p degenerate minima located at (η1, η2, ..., ηn) = (1, 0, ..., 0), (0, 1, ...,0), ..., (0, 0, ..., 1). The following equation for f0 is suggested by adding an extra term,  , as proposed by Moelans et al, to describe second-phase particles [19, 20]:
where c(r, t) is the concentration of all elements in the α-Mg matrix. However, the composition of Zn and O is very low compared with Al and its variation contributes are very small to the total free energy, so we selected concentration of Al only to be calculated for simplification. Therefore the c(r, t) is the concentration of Al and cl is the concentration of Al at the lowest point of the free energy curve as a function of temperature, and K1 is the coefficient of coupling between ηp and ηq. Parameter n is the possible number of grain orientations in the system and it was taken as 32, as suggested in the literature [29]. The Φ(r) is a spatially dependent function and independent with time. Inside the particle, the Φ(r) is equal to 1 where the free energy density is a minimum at ηp = 0; whereas, outside the particle the Φ(r) is equal to 0 where the free energy density is a minimum at ηp = 1 [20]. The value of ε is set to characterize the ability of different types of particles to hinder grain growth [20]. Here, Al2O3 particles are treated as immobile and incoherent particles without coarsening or dissolution and have a strong hindering effect, therefore, we define ε = 1.
To keep f0 minimal at (η1, η2, ..., ηp) = (1, 0, ..., 0), (0, 1, ..., 0), (0, 0, ..., 1), the derivative of equation (4) with respect to ηp ( ), must be zero and the relation between B1 and B2 must satisfy

All constants in equation (4) require real physical values to enable the simulation of real industrial alloy AZ31. Therefore, the initial phase could be considered as a solid amorphous state and its free energy may be calculated by the basic crystal free energy plus the volume grain boundary energy. This scheme results in the following equation:
where Egb is the grain boundary energy and R is the grain boundary range [25, 26]. By solving equation (6) together with equation (5), where Egb = 0.55 J · m−2 [30] and R = 0.11 μm, B1 and B2 can be determined. The calculated results are B1 = 106.12 J · mol−1 and B2 = 3414 J · mol−1.
The free energy concentration curve of Al can be obtained using the Mg–Al–Zn ternary system database in THERMOCALC (Thermo-Calc Software AB, Stockholm Technology Park, Stockholm, Sweden) at different temperatures based on the corresponding experimental data, the same as in previous work [25, 26]. According to the curve, cl is obtained to equal 0.17 at 523 K but 0.2 at 573 K and 623 K, respectively. The best values for A, A1, and A2 were obtained by fitting the curve with equation (4) when  and
and  , and the values of the parameters shown in table 1 were used for different temperatures.
Table 1. Values of model parameters at different temperatures.
| Temperature (K) | A (kJ · mol−1) | A1 (kJ · mol−1) | A2 (kJ · mol−1) | B1 (J · mol−1) | B2 (J · mol−1) | K1 × 10−2 (J · mol−1) | K2 × 10−12 (J · m2 · mol−1) | L × 10−7 (m2 · mol · J−1 · s−1) |
|---|---|---|---|---|---|---|---|---|
| 523 | −19.5 | 22.1 | 5.2 | 106.12 | 3414 | 4.0 | 3.0 | 0.61 |
| 573 | −22.1 | 22.5 | 13.0 | 106.12 | 3414 | 4.0 | 3.0 | 1.12 |
| 623 | −25.0 | 22.0 | 18.3 | 106.12 | 3414 | 4.0 | 3.0 | 1.72 |
2.3. Gradient parameters and other model parameters
The grain boundary range of AZ31 alloy has been suggested to be between 0.1 and 1.2 μm according to its physical characteristics and experimental microstructure measurement reported in the literature [25, 26]. The results of the present simulation indicate that the range should take a value of 1.1 μm for consistency with the experimental results; therefore, K2 must take a value of 3.0 × 10⁻¹² J · m2 · mol−1 according our simulations. Both K1 and K2 substantially affect grain boundary energy determined by simulation [24–26]. The random grain boundary energy was measured to be between 0.5 and 0.6 J · m−2 for most previously investigated polycrystalline metal systems [30]; thus, here, 0.55 J · m−2 was set as the target value. By our simulation, we determined that K1 = 4.0 × 10⁻² J · mol−1 if the calculated boundary energy satisfies a target value.
The L in equation (1) is the kinetic constant related to the balance effect of deformation and recrystallization on grain growth during ECAP. We used the same method in our previous works [24–26] to obtain the value of L by matching the simulated results with the experimental data [31] for grain growth without Al2O3 particles during ECAP. Therefore, the values of L represent the effect of all physical mechanisms on grain growth under experimental conditions, with the exception of the Al2O3 particle effect. The values of L were set to 0.61 × 10⁻⁷, 1.12 × 10⁻⁷, and 1.72 × 10⁻⁷ m2 · mol · J−1 · s−1 for temperatures of 523 K, 573 K, and 623 K, respectively. The diffusion mobility parameter M in equation (2) was approximated as 3.87 × 10⁻²⁰ m2 · mol · J−1 · s−1 based on literature [32]. Eventually, the physical values of all necessary parameters for the present model were found and are summarized in table 1.
2.4. Initial condition setup
The nucleation of crystallization was simplified by a phenomenological method, and the well-defined grain microstructure was artificially formed after a short time. The initial nucleation state was given as 4dx × 4dx unit grids that were evenly distributed in the simulated area, and the radius of each unit of a crystal nucleus was a random value between 0 and 2 grid sizes. In the simulation, we did not introduce second-phase particles during grain nucleation and initial grain growth. The particles were then randomly introduced over the entire AZ31 matrix when average matrix grains grew to a small specific grain size of approximately 3 μm. Therefore, our simulation considers only the grain growth character and ignores the effect of grain nucleation. The initial concentration of Al was set according to the local initial η value. If η = 1, the local initial concentration was set as 0.03, and the initial concentration at other positions was set as 0.031 to simulate element boundary segregation. Our simulations were conducted in 1024 × 1024 2D uniform grids. The overall size of the simulation cell was 102.4 μm × 102.4 μm; specifically, the size of each cell was 0.1 × 0.1 μm. Time-step values were selected as 0.2 s in this model to balance between convergence and efficiency. The boundary condition of the phase field was defined as the periodic boundary.
2.5. Comparison of simulation and experimental results
All physical parameters in the present model were determined by physical analysis or experimental as described above so that the microstructure evolution can be simulated in real length and time scales to carry out a comparison with actually measured grain morphology and size.
The shade of gray in the simulated microstructure represents the value of  ; i.e. larger values are represented by lighter shades. Therefore, figure 1 shows our simulation results with experimental optical microscopy images reported in the literature [14] at 503 K. The simulated and experimental morphology results clearly match well over a range of particle contents. Furthermore, figure 1(c) shows that the grain size statistical distribution of the simulation and that of the observation match remarkably with the same curves and peaks; such agreement is rarely reported in similar modeling work. This agreement provides strong evidence of the reliability of our model and represents progress in the phase field simulation technique.
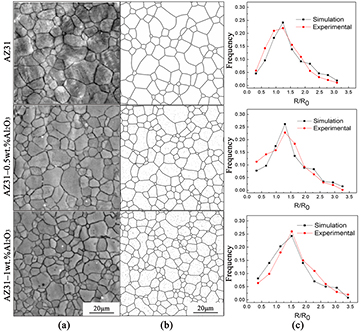
Figure 1. Microstructure and grain size distribution of ECAPed AZ31 Mg alloy containing 0, 0.5, and 1 wt.% Al2O3 particles with an average diameter of 100 nm at 503 K: (a) experimental observation, reproduced with permission from [14], copyright 2010 Elsevier, (b) phase-field simulation, and (c) grain size distribution by both simulation and experimental measurement.
Download figure:
Standard image High-resolution image3. Results and discussion
3.1. Effect of second-phase particle fraction
To quantitatively study grain size variation, we simulated the average grain size versus processing time with different Al2O3 particle fractions; the results are plotted in figure 2, along with limited experimental data [14] for comparison.
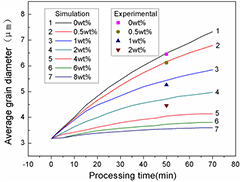
Figure 2. Simulated grain growth of AZ31 magnesium alloy containing different weight fractions of Al2O3 particles with diameter of 100 nm as a function of processing time at 503 K; experimental results from the literature [14] are included.
Download figure:
Standard image High-resolution imageFigure 2 shows the average simulated grain size versus processing time in the presence of Al2O3 particles for several weight fractions. The kinetics of grain growth of the average grain diameter is given by the power growth law as follows:

where t is the processing time, D is the average grain size in diameter, D0 is the initial average grain size, n is grain growth exponent and k is a temperature-dependent rate constant. The grain growth during ECAP in this simulation essentially obeyed the power law at n = 2 in the particle-free case and at n = 3 in containing 2 wt.% Al2O3 particles. Also, it shows relatively better agreement was achieved between the simulations and experiments with low particle contents. However, the simulation results deviate from the experimental data in the case of 2 wt.% particle content; in addition, the average simulated grain diameter is 4.73 μm, but the experimental value is 4.46 μm. The larger grain diameter obtained in the simulation defined by a random, even distribution of the particles implies that Al2O3 particles are not randomly distributed in the real alloy but are preferentially located at grain boundaries, which would result in a stronger pinning effect at the boundaries. Figure 2 also indicates that the addition of 2 wt.% Al2O3 particles strongly affects grain refinement, reducing the grain size by 28.7% compared to that of the alloy without particles. Furthermore, the results indicate that if the fraction of Al2O3 particles is greater than approximately 4 wt.%, any further increase of the particle content will have little effect on grain refinement.
Because of the lack of an accurate expression for grain size variation, a parameter (Δd) has been proposed to describe it: Δd = dmax − dmin [25], where dmax represents the maximum characteristic grain size, which is the average size of the largest 5% of the grains in a system, and dmin is the minimum characteristic grain size, which is the average size of the smallest 5% of the grains. Grain size variation simulated using experimental results versus the processing time is plotted in figure 3 for the four particle fractions. Notably, grain size variation here is not the deviation of the grain size from the corresponding value on the common normal distribution of the grain size. The variation here is used to represent the degree of grain size fluctuation due to abnormal grain growth. Figure 3 shows that grain size fluctuation increases with increasing processing time and decreases with increasing Al2O3 particle fraction. However, grain size fluctuation becomes severe when the particle fraction is below a critical fraction of 1 wt.%, consistent with existing experimental data [14] shown in figure 3 for AZ31 Mg alloy.

Figure 3. Simulated grain size variation (Δd) versus processing time, along with experimental results [14].
Download figure:
Standard image High-resolution image3.2. Effect of particle size
The effect of the second-phase particle size on the grain growth kinetics of AZ31 alloy during ECAP was studied by simulation using two particle volume fractions of 3% and 10%; the selected processing temperature was 623 K. The diameters of the examined particles were categorized into five grades: 100 nm, 300 nm, 500 nm, 800 nm, and 1.3 μm; all particles were randomly introduced in the alloy as an initial condition. The simulated average grain diameter of the alloy is plotted in figure 4 as a function of the processing time for several sizes of particles.
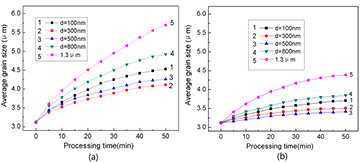
Figure 4. Changes in the average grain size versus the processing time at 623 K, as determined by simulation, showing the effect of the second-phase particle size indicated in the legends: (a) volume fraction of 3% and (b) volume fraction of 10%.
Download figure:
Standard image High-resolution imageIn AZ31 Mg alloy, it was found that second-phase particles should have a critical size of 0.5–0.8 μm for the grain refinement effect to occur appropriately. If the particle size is smaller than the critical size, large particles will strongly hinder grain growth; in contrast, if the size is larger than the critical size, large particles will exhibit a weaker hindering effect than small particles. This suggests that the particles have to be big enough compared to the critical size to have a full effect to pin up the grain boundary, so that the large particle size has a better effect to refine grain size of the alloy even for less particle numbers. However, if the particle size is over the critical, further increase of the size will contribute nothing in the ability to pin up the boundary so that the alloy with large second-phase particles shows much coarser grains after the ECAP process, because an increase in the particle size for a fixed volume fraction means a decrease in the number of particles, which will result in poor hindrance of grain growth. The critical second-phase particle size on grain refinement is a new finding. This can explain a common puzzle that the enormous number of tiny precipitates in light metals can increase strength remarkably but cannot refine the grain size to contribute to plasticity.
Zener first proposed a model to describe the effect of second-phase particles on polycrystalline grain growth [12]. This model established a quantitative relation among the steady grain size, second-phase particle size, and volume fraction as

where R is the steady grain radius, r is the average particle radius, and fv is the volume fraction of particles. We plotted the ratio of the average grain radius to the particle radius (R/r) as a function of the particle fraction ( fv) for several sizes of particles using our simulation, as shown in figure 5. As evident in the figure, simulations for micron-scale particles more closely match the Zener model curve at low particle fractions; whereas simulations for nanoscale particles better match the curve at high fractions. These results suggest that nanoscale particles cannot effectively pin up grain boundaries at volume fractions as high as 10%, because the particle distance will be too small to distinguish number difference at a boundary during it moving. However, the simulation results are consistent with the Zener relation shown in figure 5 to support the theoretical argument.
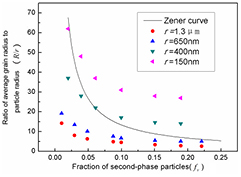
Figure 5. Simulation results for different second-phase particle sizes and fractions, and a comparison with the prediction of the Zener model.
Download figure:
Standard image High-resolution image3.3. Effect of particle distribution
The distribution of in situ synthesized second-phase particles differs in various matrices. Al8CeMn4 rod-shaped particles produced via in situ synthesis in AZ31 were mostly distributed in grain boundaries, Al8Mn5 oval-shaped particles were distributed inside grains, and lamellar or oval Al2Ca particles were distributed inside grains or in grain boundaries [33]. Therefore, an investigation of the effect of different distributions of second-phase particles on the grain growth of AZ31 alloy by simulation is interesting.
The simulations were conducted for two particle volume fractions of 2 and 8% and for spherical particles with diameter of 0.5 μm. The processing temperature was selected as 623 K, and the particles were randomly introduced in AZ31 alloy but with 10%, 30%, 50%, 70%, and 100% of the total particles distributed in the grain boundaries. A simulation result for 150 min of grain growth is presented in figure 6. A comparison of figure 6(a) with figure 6(b) reveals that the presence of more particles distributed in grain boundaries results in finer and more uniform grains of AZ31 alloy after ECAP.
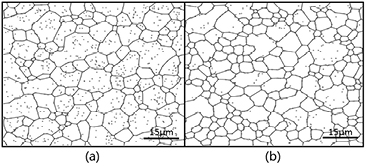
Figure 6. Simulated microstructure of AZ31 Mg alloy with different distributions of particles in 2% volume fraction after ECAP at 623 K for 150 min: (a) 30% of the particles located at grain boundaries and (b) 70% of the particles located at grain boundaries.
Download figure:
Standard image High-resolution imageAdditional simulation results are presented in figure 7. With increasing fraction of particles distributed in grain boundaries, the average grain size of the alloy not only decreases but also arrives at a stable grain size much quicker. This result is obtained because only the particles distributed in grain boundaries exert a pinning effect when the grain boundary moves, resulting in a small average grain size. As shown in figure 7(b), when the total particle volume fraction is as high as 8%, the average grain size remains stable and small, although the increase in the number of particles at the grain boundaries can slightly refine the grains. However, as shown in figure 7(a), in the case of a low total particle volume fraction, the average grain size effectively decreases with increasing amount of particles distributed in the grain boundaries; in contrast, in the case of 70% of the particles distributed in the grain boundaries, any further increase in the amount of these particles negligibly affected grain refinement. The reason for this behavior may be that when the amount of particles at the boundary is small, additional available particles located in boundaries improved the pinning effect and resulted in better grain refinement, whereas, when the amount exceeds 70%, many particles are already distributed in boundaries, as a consequence, grain refinement is insensitive if the amount of particles at grain boundaries is further increased.
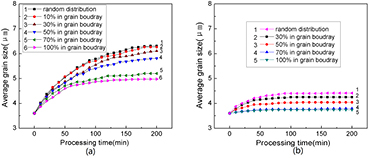
Figure 7. Simulations of the average grain size of AZ31 alloy with second-phase particles distributed in different percentages of total particles at grain boundaries versus the processing time at 623 K: the total particle fractions are two different values of (a) 2 vol.% and (b) 8 vol.%.
Download figure:
Standard image High-resolution image3.4. Effect of particle shape
To make the simulation closer to experimental conditions, we set three particles with different shapes: spherical particles with a diameter of 1.5 μm, oval-shaped particles with major axis of 2 μm and a minor axis of 0.8 μm, and rod-shaped particles with a width of 0.5 μm and a length of 3.5 μm, where each particle having the same volume. Figure 8 shows that different grain growth rates are obtained for the three types of particles present in the microstructure of AZ31 Mg alloy.
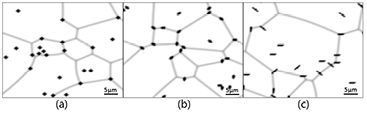
Figure 8. Simulated microstructures of AZ31 Mg alloy particles with different shapes at 623 K for the ECAP processing time of 150 min: (a) spherical particles, (b) ellipsoid particles, and (c) rod-shaped particles.
Download figure:
Standard image High-resolution imageMore simulation results are presented in figure 9 with different particle volume fractions of 2, 4, and 8% for the three particle shapes. The average grain size versus processing time with different shapes and volume fractions of second-phase particles are plotted in figure 9 to reveal the shape effect. When the volume fraction of particles is 8%, rod-shaped particles exert the strongest pinning force, whereas spherical particles exert the weakest pinning force, which is in agreement with another simulation work [22]. However, our simulations showed that spherical particles exert a stronger pinning effect than rod-shaped particles when the volume fraction is low (2%). This result is interesting, but further experiments are needed to confirm it.

Figure 9. Simulated changes in the average grain size of AZ31 alloy versus processing time for different shapes and volume fractions of dispersed second-phase particles at 623 K.
Download figure:
Standard image High-resolution image
The phase-field model has been established to simulate the effect of Al2O3 second-phase particles on grain growth in AZ31 alloy during ECAP. This model is sufficiently flexible to be adapted to simulate other alloy systems during other processes, such as rolling and extrusion, by changing the value of parameters and the expression of f0. Moreover, the results in this study can be considered as general regularity and can be applied in other alloys.
4. Conclusions
- (1)A phase field model has been successfully established to simulate the realistic spatiotemporal grain growth of AZ31 Mg alloy containing finely dispersed second-phase particles during ECAP in the industrial scale application of micrometers and minutes. The simulated results exhibit good agreement with the experimental results, especially for 523 K at a low weight fraction.
- (2)The presence of more second-phase particles strongly hinders grain growth. However, if the fraction is greater than 4 wt.%, further particle increase will have much less efficiency in grain refinement.
- (3)At a constant particle volume fraction such as 2%, there is a critical size of 0.5–0.8 μm of second-phase particles during the grain growth of AZ31 Mg alloy. If the particle size is smaller than the critical size, large particles will strongly hinder grain growth; in contrast, if the size is larger than the critical size, large particles will exhibit a weaker hindering effect than small particles.
- (4)With increasing particle fraction at the grain boundary, the grain size is finer than the particle random distribution. However, if the particle fraction exceeds 70%, there will be a weaker effect on grain refinement.
- (5)If the volume fraction is 2%, spherical second-phase particles exhibit the best ability to hinder grain growth, followed by ellipsoid particles and rod-shaped particles. However, if the volume fraction is over 8%, rod-shaped particles exhibit the best ability to hinder growth, whereas spherical particles exhibit the worst ability.
Acknowledgment
This work was financially supported by the National Science Foundation of China (Grant numbers 51171040, U1302272, 51301035 and 51571055) and the National High Technology Research and Development Program of China (Grant numbers 2013AA031601).