

Abstract
This paper presents an aircraft health and usage monitoring system (HUMS) using fiber Bragg grating (FBG) sensors. This study aims to implement and evaluate the HUMS for in-flight strain monitoring of aircraft structures. An optical-fiber-based HUMS was developed and applied to an ultralight aircraft that has a rectangular wing shape with a strut-braced configuration. FBG sensor arrays were embedded into the wing structure during the manufacturing process for effective sensor implementation. Ground and flight tests were conducted to verify the integrity and availability of the installed FBG sensors and HUMS devices. A total of 74 flight tests were conducted using the HUMS implemented testbed aircraft, considering various maneuvers and abnormal conditions. The flight test results revealed that the FBG-based HUMS was successfully implemented on the testbed aircraft and operated normally under the actual flight test environments as well as providing reliable in-flight strain data from the FBG sensors over a long period of time.
Export citation and abstract BibTeX RIS
1. Introduction
The use of aircraft has expanded and is established as a vital mode of transportation that readily and quickly connects the world today due to its convenience and immediacy. With the rapid increase in demand for air transportation, airlines have come to recognize the importance of aircraft safety management systems and have made an effort to reduce the occurrence of aircraft accidents, which cause mass human casualties and financial losses. Thus, it is critical that the potential risks are identified and prevented in advance. In this regard, airlines aim to establish systematic aviation safety management systems such as air traffic regulation, safety education, and training programs. Furthermore, strict regulations are applied to aircraft maintenance and repairs to further strengthen the overall safety and reliability of air transportation. Among such efforts to prevent aircraft accidents, recent research regarding aircraft health and usage monitoring systems (HUMS) have been actively conducted [1]. HUMS allows for the real-time monitoring of the structural condition using various sensors installed in the major parts of the aircraft along with the diagnosis and assessment of the aircraft structural integrity by analyzing the acquired condition data. Informative data provided by HUMS can be useful for the structural integrity evaluation and fatigue life estimation. Moreover, HUMS implementation can effectively replace much of the conventional maintenance and inspection work. This would result in a substantial reduction in future aircraft maintenance time and cost [1] and also help to increase the availability, reliability, and safety of aircraft operation.
HUMS monitors the aircraft conditions using various sensors installed in critical components. Among the various types of sensors, strain gauges have been widely used for the in-flight strain monitoring of aircraft structures [2]. Strain gauges can directly monitor applied loads on the main components and sensitively respond against abrupt maneuvers, aerodynamic changes, gust loads, and buffet loads. Electrical resistance strain gauges have been the most widely applied for in-flight strain measurement of aircraft structures due to their simple sensing configuration and relatively low-cost measurement system. Many previous studies adopted strain gauges to monitor the in-flight strain data on various components such as the shock fence [3], vertical tail [4, 5], horizontal tail [5, 6], main landing gear [5, 7], fuselage [5], and main wing spar [5, 8, 9]. These studies aimed to monitor the fatigue load on the target structure [4, 5, 8] or estimate various flight loads using a calibration method [5–9]. However, strain gauges have limitations with regard to their applicability for in situ aircraft structures. The use of strain gauges would lead to wiring problems for multiplexed measurement of aircraft structures due to the required number of wires for each strain gauge. Furthermore, there exists the possibility of not only measurement problems caused by electromagnetic interference (EMI) but also sensor corrosion problems for long-term monitoring.
As an alternative method to the strain gauge, various types of optical fiber sensors such as fiber Bragg grating (FBG) sensors, interferometric sensors, and distributed Raman/Brillouin sensors and their measuring systems have been developed [10]. Fürstenau et al [11] installed Michelson interferometric sensors to the main wing spar of a Cessna C270A. The interferometric sensors were successfully implemented and measured the in-flight strain data. Yari et al [12, 13] developed a distributed optical fiber sensor system using Brillouin scattering. The developed system was applied to a civil jet aircraft, MU-300. The in-flight strain data of the mid-fuselage upper panel [12] and the front spar of the vertical [13] were obtained from the flight tests. Read and Foote [14] developed and evaluated a Bragg grating sensor system for structural monitoring of sailing yachts and turbo-prop aircraft. FBG sensors were attached to the external lower surface of the main wing, near the leading edge inboard of the left engine. Eight flight tests and one ground test were conducted using the on-board monitoring system. Chandler et al [15] developed an on-line structural health monitoring and fire detection system using FBG sensors. A total of 17 FBG sensors were installed at critical locations such as the wings, fuselage, and engine. Several flight tests were conducted and the developed system could measure the in-flight strain and temperature. Furthermore, FBG sensors were applied to unmanned air vehicles (UAVs) to monitor the in-flight strain data on the main wings [16, 17] and tail booms [17–19]. In-flight strain data were successfully obtained from the flight tests using the embedded FBG sensors on UAVs.
These previous studies successfully measured the in-flight strain under flight conditions. However, certain difficulties and limitations have been noted in actual practice. Strain gauge sensors used in these studies could suffer wiring, measurement, and corrosion problems. Optical fiber sensors used in these studies require a complex sensing configuration and relatively high-cost measurement system compared with the strain gauge method. The long-term operability of FBG sensors and HUMS on aircraft structures also needs to be established. Additionally, sensor installation locations in several previous studies may not be practical. For example, sensor installations on the outer surface of aircraft could lead to aerodynamic turbulence affecting flight stability. Also, it requires an extra protective method for the sensor area and connecting cables against external damage or harsh environments during flights.
Therefore, as a part of the development and the eventual realization of aircraft HUMS, an optical fiber-based HUMS was developed and implemented on a real aircraft to evaluate the applicability of the developed system. The FBG-based HUMS was applied to a testbed aircraft, and dozens of flight tests were conducted considering various maneuvers and abnormal conditions. The HUMS operated normally under the flight test environments and successfully monitored the in-flight strain data over a long period of time using the installed FBG sensors.
This paper is organized as follows. Section 2 explains the basic concept and configuration of the optical-fiber-based HUMS. Section 3 presents the HUMS implementation process including sensor implementation and ground test. Flight test and in-flight strain measurement results are presented in section 4. The HUMS implementation result is discussed in section 5.
2. Health and usage monitoring system
2.1. FBG sensors
FBG sensors were selected for the in-flight strain measurement of aircraft structures due to their superior performance characteristics in practical applications. FBG sensors hold numerous advantages over the conventionally used strain gauges, including their small size, light weight, embeddability, easy multiplexing, corrosion resistance, and non-EMI. Thanks to such advantageous characteristics of FBG sensors, they are suited for the multiplexed measurement of aircraft structures when operated under extreme environments, over long time periods, and with various on-board electrical equipment.
FBG sensors consist of regular interval gratings on the fiber core, which acts as an optical mirror reflecting a certain wavelength of light. When broadband light enters the optical fiber, a particular wavelength that satisfies certain Bragg conditions undergoes multiple Fresnel reflections due to the variation in the refractive index of the Bragg gratings. The specific wavelength that is reflected is described by

where λB is the Bragg wavelength, ne is the effective refractive index of the grating, and Λ is the grating period produced on the optical fiber. When an external load is applied to the Bragg grating, its effective refractive index and/or grating period change, leading to a shift in the Bragg wavelength of the reflected light. This shift in terms of strain and temperature variation is

where pe is the photoelastic constant, α is the thermal expansion coefficient, and ξ is the thermo-optic coefficient of the optical fiber. FBG sensors can detect strain and temperature variations in the Bragg grating by measuring the center wavelength shift of the reflected light from each FBG sensor.
In this study, a low-speed FBG interrogator (SFI-700, Fiberpro Inc., Republic of Korea) was utilized by taking into consideration the long-term monitoring of aircraft structures. The interrogator is composed of vertical-cavity surface-emitting lasers (VCSEL) in an array as the broadband light source. The cost of VCSEL is relatively low compared to other broadband light sources, making it possible for the interrogator to be relatively low cost. As the interrogator is a commercialized product for general purposes, it was modified to fit for aircraft. To directly receive electric power from the aircraft power supply system, a dc–dc converter was applied. Furthermore, vibration isolating materials were added in advance to the inner side of the device to prevent possible malfunction caused by high levels of vibration from the propeller during flights. The interrogator has a total of two channels, and each channel can measure up to 12 points with a sampling rate of up to 10 Hz. Its measurement range is 1510 ∼ 1550 nm and repeatability is less than 10 pm. The interrogator has a size of 420 (length) × 210 (width) × 85 (height) mm3 and weight of 4.5 kg, which allows for the device to be mounted into small aircraft. The application of the affordable interrogator allows for the simplification of the overall system and results in a more cost-effective HUMS for aircraft.
2.2. System configuration
Figure 1 shows a conceptual diagram of the FBG-based HUMS. The HUMS is divided into two major parts, an airborne system and ground system. The airborne system consists of a sensing module and a data acquisition/processing/storage (DAPS) module. In the airborne system, multiple FBG sensors are installed on aircraft structures and connected to an on-board FBG interrogator to detect their wavelength shift during flight. The detected wavelength data are transferred to the DAPS module. Additionally, various flight parameters such as altitude, roll, pitch, and yaw angles, which are recorded from the altitude and heading reference system, are digitalized and transferred simultaneously to the DAPS module, in which all of the transferred data are stored on a compact flash memory card. After each flight, all of the stored data are transferred to a ground system via the memory card. In the ground system, the validity and relevance of the raw data are checked before they are uploaded to the main database server using a portable ground support equipment (GSE) device. The raw data are also converted into strain data through an internal algorithm of the portable GSE device. Finally, all the data are uploaded to a ground database server. The uploaded data are configured so that authorized users can directly connect to the server and access the flight test data online. This system configuration is convenient for various users.
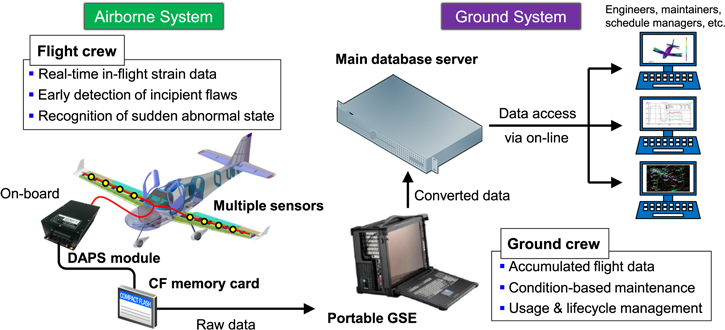
Figure 1. Conceptual diagram of the FBG-based HUMS for in-flight strain measurement.
Download figure:
Standard image High-resolution image3. Flight test preparation
3.1. Testbed aircraft
The JABIRU UL-D aircraft (JABIRU Aircraft Pty. Ltd, Australia; see figure 2) was selected as the testbed aircraft for the HUMS implementation and subsequent flight tests. The aircraft was equipped with two seats, and the maximum take-off weight was limited to 450 kg. According to its specifications, the JABIRU UL-D aircraft is categorized as an ultralight aircraft by the UK Civil Aviation Authority. It has a rectangular wing with a strut-braced wing configuration. The fuselage, wings, and struts were hinged. The aircraft was composed of a pair of main wings, horizontal stabilizers and one vertical stabilizer.
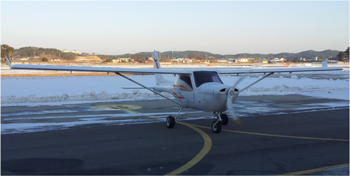
Figure 2. Testbed aircraft JABIRU UL-D for the HUMS implementation and flight tests.
Download figure:
Standard image High-resolution image3.2. Sensor installation
The main wing was considered as the target structure for the HUMS implementation. This is a major part of the aircraft and supports most of the lift force during flight. In this study, FBG sensors were installed on the upper and lower flange of the main spar to measure the strain response mainly caused by the bending moment on the main wing. Sensor installation was conducted during the wing manufacturing process at the JABIRU Pty. manufacturing plant. The main wing of the testbed aircraft was composed of an upper and lower skin and a single main spar made of glass fiber epoxy composite. Additionally, a Styrofoam core was filled between each component. Strain and temperature FBG sensors were prepared in an array because their responses are affected simultaneously by strain and temperature variation. Figure 3 shows the details of the sensor installations for the strain and temperature sensors. All of the sensors were installed on the inner side of the main spar channel section. One strain sensing array consisted of 10 FBG sensors, with five strain sensors attached to the inner surface of the upper flange and the remaining five to the inner surface of the lower flange on each wing using an epoxy adhesive. One temperature sensing array consisted of two FBG sensors, and the temperature sensors were installed in a strain-isolated state along the neutral axis of the spar web to minimize the effect of the bending moment on them. One strain sensing array and one temperature sensing array were directly connected with each other to simultaneously measure the strain and temperature through a single optical fiber line. A total of 12 FBG sensors on a single optical fiber line per wing were connected to each channel of the on-board FBG interrogator for flight tests. In the case of sensor damage that might occur during the wing manufacturing, assembly, transport, and long-term operation after sensor installation, two strain sensing arrays and one temperature sensing array were additionally installed on each wing for redundancy. Thus, a total of five FBG sensor arrays, which consisted of 30 strain sensors and four temperature sensors, were installed on each wing. The strain sensing arrays were laid side-by-side with the same strain sensing locations on the spar flanges. The distance between each strain sensing array in the chord direction was about 5 mm. The temperature sensors were installed in different locations along the spanwise direction. As the optical fiber lines are very thin and brittle, there exists a large risk of damage. To protect the optical fiber lines from possible external damage, preventive methods were considered during sensor installation in the following manner. There is a weak point between the buffer and the non-buffer coating areas, where stress concentrations exist due to abrupt changes in the cross-section diameter. These stress concentrations can lead to damage in the pertinent optical fiber line segments during sensor installation or wing manufacturing and assembly. Therefore, possible damage to these segments was prevented in advance by using epoxy adhesive to completely fix these areas to the neutral axis of the spar web near the wing root. Additionally, all segments of the FBG sensor arrays were fixed to the upper and lower flanges using epoxy adhesive to prevent any breakage of the optical fiber lines. All of the FBG sensor arrays were checked using the low-speed FBG interrogator and showed normal output signals after sensor installation.

Figure 3. Details of the sensor installations for in-flight strain measurement.
Download figure:
Standard image High-resolution image3.3. Ground test
A ground test was conducted to confirm the integrity and availability of the installed sensors before installing the main wings to the testbed aircraft fuselage. Figure 4 shows the experimental setup for the ground test to examine the status of the output signals after the final wing manufacturing process. The output signals from all of the FBG sensor arrays were examined using the low-speed FBG interrogator. From the ground test, all of the sensor arrays installed in both wings functioned, but several problems arose in a few sensors on the strain sensing arrays after the wing manufacturing process. These problems included multiple center wavelength shifts being detected from a single FBG sensor, flickering of the detected wavelength signal, poor repeatability, and the inability to measure the center wavelength shift for certain FBG sensors. Figure 5 shows the wavelength spectrum measured from one of the problematic strain sensing arrays. Some of the FBG sensors showed optical spectrum splitting and/or bandwidth widening of the reflected Bragg wavelength peak. These phenomena were caused by the physical interaction between the FBG sensors, the adhesive, and the inner foam core, whose installation process is shown in figure 6. The inside of the wing structure was filled with the foam core to prevent buckling during flight. In this process, there was direct contact between the FBG sensors and inner foam core as well as non-uniform adhesive bonding during hardening due to the work being performed manually. The problematic sensors could not be corrected physically after completion of the wing manufacturing because all of the FBG sensors were already embedded into the wing structure. Therefore, to obtain reliable output data from the FBG sensors, such problems have to be taken into consideration before the sensor implementation. For example, packaging the FBG sensors in protective films or fabricating very thin extruded/intruded grooves at the sensing areas can prevent the direct contact between FBG sensors and the other components, which would be helpful for implementation on real wing structures consisting of an inner foam core. Among the three strain sensing arrays on each wing, only one of 10 FBG sensors showed normal output signals with a high level of the signal repeatability below 10 pm during the ground test. The other two strain sensing arrays on each wing included a few problematic FBG sensors. As a result, the normal strain sensing array on each wing, which did not include any problematic FBG sensors, was selected for the in-flight strain measurement. After the ground test, the main wings were assembled to the testbed aircraft fuselage. Additionally, the FBG interrogator and the DAPS module were loaded into the cockpit and connected to the selected FBG sensor arrays.
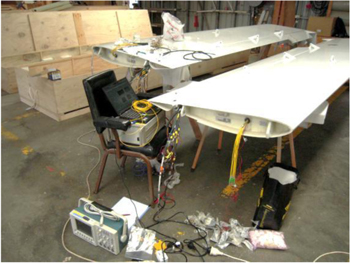
Figure 4. Experimental setup for the ground test.
Download figure:
Standard image High-resolution image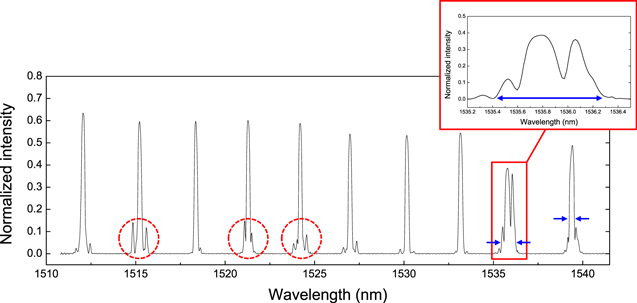
Figure 5. Wavelength spectrum of the problematic FBG sensor array.
Download figure:
Standard image High-resolution image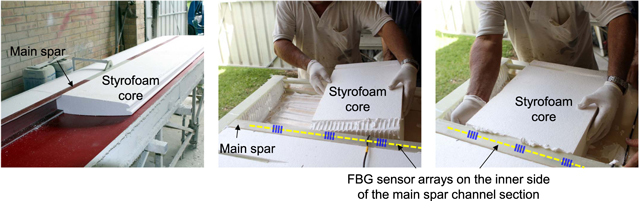
Figure 6. Installation process of the inner foam core in the main wing.
Download figure:
Standard image High-resolution image4. In-flight strain measurement results
Flight tests were conducted using the HUMS-implemented testbed aircraft at the Tae-an airfield located in the Republic of Korea. A total of 74 flight tests were conducted, including various maneuvers. Of these, three sorties that represent sudden maneuvers or abnormal states of the aircraft were selected to show their in-flight strain measurement results. The in-flight strain distribution of the strut-braced wing structure was identified quantitatively. The in-flight strain data, especially from FBG9 as it most clearly reflected the aircraft maneuvers and conditions, were compared with other flight parameters measured simultaneously during each flight to verify their reliability and relevance.
4.1. In-flight strain distribution, sortie #41
For the strut-braced wing structure, it was known that the largest bending moment occurs near the strut-wing joint section, and the smallest bending moment occurs near the wing root and wing tip because there is no reaction force against the bending moment at those regions due to the hinged joint boundary condition [20]. Figure 7 shows the strain responses of 10 FBG sensors on the left wing, upper and lower flanges as well as the strain distribution of the wing structure along the spanwise direction at around 2000 s. In the case of the upper flange, there were large compressive loads on the strut-braced section 'b' and FBG8 showed maximum strain level during the flight. In the case of the lower flange, there were low strain levels on the strut-braced section 'b', close to zero, and FBG4 showed maximum strain level during the flight. Such strain distribution characteristics were caused by its wing configuration and boundary conditions. The simple beam section 'a' experienced only the bending moment due to the distributed lift force; however, the strut-braced section 'b' experienced the complex loading conditions of not only the bending moment but also the longitudinal compressive load due to the lift force on the section 'a', as shown in figure 8. Therefore, the upper flanges of section 'b' bear much more load than the lower flanges for the strut-braced wing structure due to the longitudinal compressive load. The strain measurement results revealed that the latter had a significant impact on the strain distribution of the strut-braced wing configuration, which was quantitatively verified. The critical section of the strut-braced wing structure was confirmed to be where the high levels of flight load occurred.
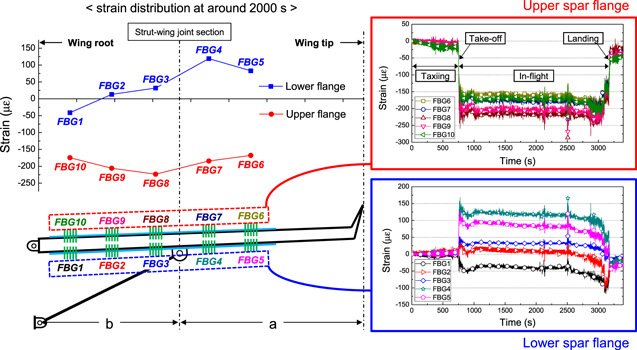
Figure 7. In-flight strain responses of 10 FBG sensors on the left wing, upper and lower flanges during the entire flight of sortie #41.
Download figure:
Standard image High-resolution image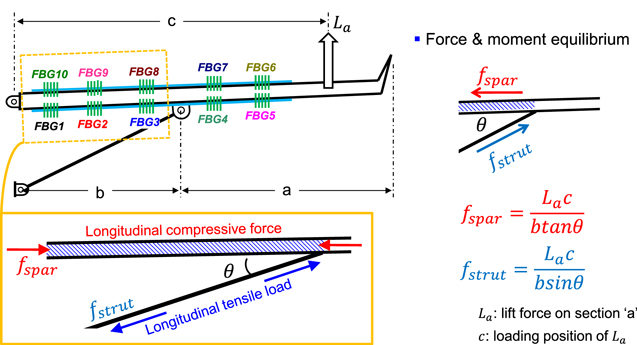
Figure 8. Loading condition of the strut-braced section 'b' under the lift force on section 'a'.
Download figure:
Standard image High-resolution image4.2. Aircraft maneuvers, sortie #41
Pilots control the aircraft attitude by adjusting the flight control surfaces of the aileron, rudder, and elevator, which influence the loading conditions of the main wings by altering the static equilibrium state of the aircraft. Therefore, the effect of the adjusted control surfaces on the loading conditions of the main spars was investigated through the in-flight strain measurement results.
Figure 9 shows the strain response of FBG9 from both wings and corresponding roll angle during the turning maneuvers. The steep turning maneuvers of the aircraft caused the strain variations, as shown in the figure. The strain variations in both wings showed opposite trends during turning. Such contrasting trends in the strain are caused by the different lift conditions of each wing because the ailerons are adjusted in opposite directions to turn the aircraft in a desired direction. For example, for a left turn, the aileron of the left wing is adjusted to the up position, decreasing the lift force due to a shorter camber length and a smaller angle of attack (AOA). On the other hand, the aileron of the right wing is adjusted to the down position, increasing the lift force due to a longer camber length and a larger AOA, as shown in figure 9.

Figure 9. In-flight strain responses of FBG9 from both wings and corresponding roll angle during turning maneuvers for the flight of sortie #41, and adjustment of the ailerons for a left banked turn.
Download figure:
Standard image High-resolution imageFigure 10 shows the strain responses of FBG9 and corresponding pitch angle during the climbs and descents. The strain variation showed high correlations with the pitch angle of the aircraft. The elevators of both horizontal stabilizers were adjusted upward or downward to make the aircraft pitch-up or pitch-down, respectively. For example, to make the pitch-up motion of the aircraft, the elevators are adjusted upward, which decreases the lift force generated on the horizontal stabilizers due to a shorter camber length and a smaller AOA, as shown in the figure. The decrease in the lift force on the horizontal stabilizers alters the moment equilibrium state of the aircraft about its center of gravity, thus causing the pitch-up motion. This increases the lift force generated on both main wings due to a larger AOA resulting in an increased strain response. Conversely, the pitch-down motion decreases the lift force on the main wings and decreases the strain response.

Figure 10. In-flight strain responses of FBG9 located on the left wing spar upper flange and corresponding pitch angle during climbs and descents for the flight of sortie #41, and adjustment of the elevators for nose up/down motions.
Download figure:
Standard image High-resolution imageThe in-flight strain data showed that steep maneuvers of the aircraft caused drastic changes in the loading conditions of the main wings, and resulted in significant strain variations. From the comparison results between the in-flight strain response and corresponding flight parameters, the in-flight strain data obtained from the HUMS qualitatively corresponded with the loading conditions of the main wings according to the aircraft maneuvers.
4.3. Take-off and landing procedure, sortie #48
Aircrafts use flaps during take-off and landing for more efficient flight. Using flaps significantly increases the lift coefficient by changing the camber length and the AOA of the wing airfoil so that sufficient lift force for flight is obtained at a relatively low aircraft speed. This use of flaps changes the lift characteristics of the wing airfoil and influences the loading conditions of the main spars. The testbed aircraft had simple-hinged fixed slotted flaps on the rear portion of the main wings and controlled the flaps over two stages from 15.5° to 40° for take-off and landing. Therefore, the effect of the flaps on the loading conditions of the main spars was investigated through the in-flight strain measurement results.
Figure 11(a) shows the strain response of FBG9 located on the right wing spar upper flange and corresponding pitch angle during the take-off procedure. The testbed aircraft entered the runway with the first stage deflected flaps for take-off at a lower speed with a higher lift coefficient. As the aircraft speed increased on the runway, the strain response progressively increased due to the generation of the lift force on the main wings at interval (a) in the figure. When the aircraft reached its take-off speed, the aircraft was taking off and the strain response stepwise increased due to the increasing AOA at interval (b). After the aircraft reached a certain altitude with adequate speed for stable flight, the first stage deflected flaps were raised to the up position for more efficient flight by reducing the drag force on the wing airfoil. Raising the flaps to the up position resulted in a stepwise increase in the strain response, as shown in the figure at interval (c).

Figure 11. In-flight strain responses of FBG9 located on the right wing spar upper flange and corresponding pitch angle during (a) the take-off and (b) landing procedure.
Download figure:
Standard image High-resolution imageFigure 11(b) shows the strain response of FBG9 located in the right wing spar upper flange and corresponding pitch angle during the landing procedure. The testbed aircraft used the flaps in two stages to obtain lower stall speed and a lower approach speed of the aircraft as well as a higher lift coefficient for a safe landing. The aircraft approached the runway with the flaps in the up position. During descent, there existed a stepwise decrease in the strain response at intervals (a) and (b) in the figure. These sudden decreases in the strain response were caused by adjustment of the flaps from the up position to the first and second stages, respectively. This decreasing trend in the strain response was found to be more significant as the flap deflection angle increased. After the flaps were adjusted to the second stages, the aircraft began the final approach to the runway. When the aircraft touched the ground, there was a stepwise decrease in the strain response due to the decreasing AOA at interval (c). After the aircraft landed, the strain response progressively decreased due to the loss of the lift force on the main wings at interval (d).
The in-flight strain measurement results revealed that the use of flaps caused stepwise decreases in the strain response of the spar flanges. This was caused by the change in the aerodynamic characteristics of the wing airfoil. Wenzinger and Delano [21] investigated the pressure distribution of the wing airfoil through wind tunnel tests by employing slotted flaps. From these tests, it was found that there was a significant increase in the pressure on the flap surface near the trailing edge when the flap was deflected at certain angles and the center of pressure (CP) location gradually moved to the rear. Additionally, it is expected that the direction of the resultant lift force applied to the CP will move to the rear as the flap angle increases. Thus, the use of such high lift devices does not necessarily lead to an increase in the bending moment directly applied to the main spars causing the decrease in the strain response. From the comparison results between the in-flight strain response and corresponding pitch angle, the in-flight strain data from the HUMS showed reasonable responses for the corresponding maneuvers of the testbed aircraft during the take-off and landing procedures.
4.4. Stall recovery test, sortie #18
Stall recovery tests were conducted to simulate an abnormal state of the aircraft. Stall is defined as a sudden reduction in the lift force on the main wings that results in the loss of aircraft control. The effect of aircraft stall on the loading conditions of the main wings was investigated. A power-on stall test was conducted to simulate a stall that can occur during the take-off procedure caused by a large AOA which exceeds the critical value. The testbed aircraft was equipped with a stall warning system that consisted of a stall warning funnel, tubes, and a horn. The stall tests were conducted until the stall warning horn was activated, and then recovery maneuvers were taken immediately afterwards.
Figure 12 shows the strain response of FBG9 located in the right wing spar upper flange, corresponding altitude, and pitch angle during the power-on stall test. During climbing, the engine power was set to be 2500 rpm to gradually reduce the aircraft speed. When the aircraft speed became less than 1 kt, the pilot simultaneously pulled back the yoke and increased engine power to simulate the departure stalls. During the early stages of the stall at interval (a) in the figure, there was a temporary rise in strain due to the increasing AOA. Subsequently, the aircraft nose was continuously raised, and once the nose reached over a critical AOA, the back pressure and airflow separation on the upper airfoil became more severe, which caused the aircraft to enter a stall and gradually lose lift force. This significantly decreased the bending moments on the main wings and consequently led to a rapid reduction in the strain response and pitch-down motion of the aircraft, as shown in the figure at interval (b). After the occurrence of the stalls, the recovery maneuvers were made immediately. As a result, the lift forces on the main wings were fully recovered, and the reduced strain levels immediately increased to regular levels, as shown in the figure at interval (c).

Figure 12. In-flight strain responses of FBG9 located on the right wing spar upper flange, corresponding altitude, and pitch angle during the power-on stall test.
Download figure:
Standard image High-resolution image
From the results, the aircraft stalls affected the loading condition of the wing structure causing the significant decrease in the strain response due to the loss of the lift force on the main wings. The in-flight strain monitoring of the spar flanges was able to sensitively respond to the stalling of the main wings and showed reasonable responses for the corresponding maneuvers of the testbed aircraft during the stall recovery test.
5. Conclusion
This study presents the implementation of an optical-fiber-based HUMS on aircraft structures for in-flight strain measurement. An ultralight aircraft, which has a strut-braced wing structure, was employed as the testbed aircraft for the system implementation and verification. FBG sensors were embedded into the main wings during the manufacturing process to improve the effectiveness of the sensor implementation and aircraft operation. A total of 74 flight tests were conducted to evaluate the applicability and performance of the FBG sensors and HUMS devices under flight conditions. The HUMS operated normally under flight test environments and successfully monitored the in-flight strain data over a long period of time using the installed FBG sensors. The in-flight strain data were compared with other flight parameters, and showed reasonable responses for the corresponding loading conditions of the main wings at various maneuvers. The developed HUMS was able to monitor the strain variations of the main wings under various loading conditions for different maneuvers, which is important information for fatigue life estimation and usage monitoring. From the flight tests, it was shown that the FBG-based HUMS was successfully implemented on the testbed aircraft and under the actual flight test environment and provided reliable in-flight strain data from the FBG sensors over a long period of time. The FBG-based HUMS presented in this study can be applicable not only to different types of aircraft but also other vehicles and infrastructures where such systems are needed.
Several issues need to be considered for further improvement of the aircraft HUMS. To prevent measurement problems that may occur after sensor implementation, it is necessary to develop and verify practical sensor installation methods considering the real applications of FBG sensors for real structures. Additionally, the utilization of in-flight strain data should be taken into account in every aspect of aircraft operation, and various data processing methods should be introduced to utilize the in-flight strain data efficiently for the estimation of flight load, fatigue life, and damage. Through rigorous and intensive analysis and verification of the in-flight strain data, it is expected that the aircraft HUMS can provide useful information such as overloads and abnormal conditions caused by abrupt maneuvers, gust loads, buffet loads, stalls, and structural damage.
Acknowledgments
This research was supported by the Leading Foreign Research Institute Recruitment Program through the National Research Foundation of Korea funded by the Ministry of Education, Science and Technology (2011-0030065).