
Abstract
NiFe alloy arrays with various geometry sizes and shapes were designed, fabricated and investigated. Electrodeposition was introduced as a highly effective integrated method to fabricate the alloy film. The influence of dimensional size and geometry shape of the array unit was discussed. With decreasing size, the soft magnetic properties of the samples are improved with a 78.6% decrease of coercivity and an 65.0% decrease of squareness ratio. Compared with square and rectangular arrays, circular arrays exhibit smaller coercivity, higher permeability and smaller squareness ratio. Additionally, different compositional arrays were also tested for their crystal structures. It is found that the alloy with a content of Ni80Fe20 can achieve a face-centered cubic structure and realize the best soft magnetic properties. A coercivity of 0.383 Oe, a squareness ratio of 4.21 × 10⁻⁴ and a saturation magnetization of 4.2 T have been successfully achieved in circular arrays within an area of 2000 × 2000 µm2.
Export citation and abstract BibTeX RIS
1. Introduction
Magnetic materials have attracted much attention for their contributions in making micro-electro-mechanical systems (MEMS) more versatile and flexible. Specifically, soft magnetic materials have unique properties such as high permeability, low coercivity and low hysteresis loss. Therefore, fabrication of high-performance soft magnetic materials becomes an important area in MEMS research. For instance, the soft magnetic properties of a Fe–Co–V film sandwiched by a thin softer magnetic film are fabricated and discussed in [1]. In [2], the multiple-layer Co–Fe alloy film separated by native oxide is obtained and its soft magnetic properties are studied. Among these soft magnetic materials, permalloy, especially consisting of Ni and Fe, has exhibited the best soft magnetic properties. First, permalloy has a relatively high permeability which can guarantee a higher sensitivity in sensing and reacting magnetic signals. Moreover, it exhibits low coercivity and squareness ratio; thus the hysteresis loop is relatively thin and high, which can decrease the loss in ac magnetic field. In [3], the coercivity and saturation magnetization of electroplated CoNi alloy are 13.5 Oe and 1.2 T respectively, and in [1], the coercivity of the 2714A/FeCoV/2714A multilayer decreases to 6–8 Oe compared with single 2714A layer. Compared with these previous works, our electroplated NiFe samples have a smaller coercivity of 0.383 Oe and greater saturation magnetization of 4.2 T. Through optimizing the geometry size of the samples, the magnetic properties can also be improved to a higher level [4]. Therefore, permalloy has become a promising choice when using soft magnetic materials in MEMS actuators and sensors. In [5], it is used as the core material of an inductor to obtain better performance. In [6–8], soft magnetic materials, especially NiFe alloy, are extensively used to fabricate electromagnetically actuated micro valves. Besides that, a fully integrated micromachined cell separator was achieved with soft magnetic NiFe micro-pillar arrays in [9].
However, the integrated fabrication method of magnetic materials is always a bottleneck for their applications in the MEMS field. Various fabrication methods, including sputtering, manual assembly and electrodeposition, have been used to integrate micro soft magnets with MEMS devices. In [2], a thin layer of CoFe alloy is sputtered onto a silicon layer to be used as a soft magnetic material. But the thickness of the thin film is limited by the fabrication method and it is hard to match it with the required thickness. Many previous works also employ manual operation to assemble magnetic materials for the MEMS fabrication process. In [10], a permanent magnet is manually assembled in a MEMS vibration-to-electrical energy harvester. Thus, it is necessary to develop a method that can be applied to MEMS fabrication easily and effectively. Compared with other techniques, electrodeposition is a promising method to fabricate soft magnetic alloys due to its good compatibility with IC fabrication technologies, easy parameter control and simple setup.
Therefore, in this paper, electrodeposition is introduced as a highly effective soft magnetic material fabrication method which can be fully integrated with MEMS fabrication process. NiFe alloy arrays with different sizes and shapes were fabricated, compared and optimized. Meanwhile, in order to get good soft magnetic properties, compositional effects on the crystal structures and magnetic properties were studied. Furthermore, a promising application of these soft magnets in the MEMS inductor is demonstrated.
2. Design of magnet arrays
The NiFe magnet arrays were designed according to the following rules in order to analyze the influence of the dimensional factors. A good soft magnetic material should have these characteristics: low coercivity, low squareness ratio, high saturation magnetization and high magnetic permeability. Accordingly, these criteria were taken into consideration in the design of the magnet arrays.
First, the difference between the mono-block and array magnets should be considered. Compared with the mono-block magnet, the magnet arrays can achieve electrical insulation and magnetic coupling between units so that the magnet arrays can achieve lower coercivity and smaller residual magnetization. Besides, due to the decreased demagnetization influence of the array, higher saturation magnetization will be realized. Finally, owing to the low residual stress of the magnet arrays, thick alloy could be easily electroplated.
Meanwhile, different array shapes will also influence the magnetic properties significantly due to their different magnetic field lines. In this paper three different shapes, including circle, square and rectangle, are designed and fabricated. For circular arrays, radialized magnetic field lines can be generated; thus the magnetic field around the circular magnets is spherical and stable, which can provide higher saturation magnetization. However, as for the square unit, four strong magnetic field lines will be provided in its four corners. So the magnetic field is not uniform and the magnetic properties are not stable. Thus, the influence of nonuniform magnetic field on the magnetic properties for the rectangular unit will be analyzed in this paper.
Finally, previous research focused on the fabrication process and composition of the alloy but ignored the geometry factor. Thus, in order to investigate the optimal choice between a series of sizes, as listed in table 1, different geometric sizes, including circular units with radius ranging from 26 to 2000 µm and space containing 50 µm, 100 µm and 200 µm, were designed in a fixed area of 2000 × 2000 µm2.
Table 1. The geometry size and shapes of fabricated NiFe array samples.
| Shape | Dimension (µm) | Number of units | Space | Thickness (µm) |
|---|---|---|---|---|
| Circle | 2257 (diameter) | 1 × 1 | – | 10 |
| Circle | 602 (diameter) | 3 × 3 | 100 | 10 |
| Circle | 26 (diameter) | 17 × 17 | 100 | 10 |
| Square | 2000 (length) | 1 × 1 | – | 10 |
| Square | 533 (length) | 3 × 3 | 100 | 10 |
| Square | 23 (length) | 17 × 17 | 100 | 10 |
| Rectangle | 1000 × 2000 | 1 × 2 | 100 | 10 |
| Rectangle | 950 × 336 | 2 × 4 | 100 | 10 |
| Rectangle | 22 × 44 | 14 × 16 | 100 | 10 |
3. Fabrication and experiments
3.1. Fabrication process
Based on electrodeposition, a series of micro NiFe soft magnet arrays were designed and fabricated, which could be compatible with other MEMS fabrication processes. The electrodeposition also allowed us to control the composition and geometric factors of the arrays easily. The specific fabrication process is described in figure 1.
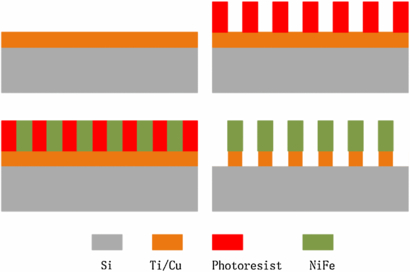
Figure 1. Schematic of fabrication process flow. (a) Sputtered Ti(150 Å)/Cu(15 000 Å) as a seed layer; (b) 10 µm photoresist was spin coated on the seed layer; (c) NiFe arrays were electrodeposited on the seed layer; and (d) the remaining photoresist and seed layer were stripped.
Download figure:
Standard image High-resolution image- (a)Clean and (1 0 0) silicon wafer is chosen as the substrate;the Ti(150 Å)/Cu(1500 Å) layer was sputtered on the substrate to form a seed layer for electroplating.
- (b)Thick photoresist was spin coated on the seed layer to build the patterned mold for magnet arrays.
- (c)The NiFe arrays were electroplated on the wafer.
- (d)The remaining photoresist was stripped by acetone and the seed layer was removed by hydrogen peroxide mixed with acetic acid.
Finally, the arrays were cut into small samples to be tested. The whole fabrication process is IC compatible, simple and low cost compared with other methods such as sputtering and micro-assembly.
3.2. Electroplating technique
Obviously, the electroplating process is the key step to determine the composition, geometric factors and magnetic properties of the arrays. So every step of the electrodeposition was carefully designed, analyzed and optimized. Figure 2 shows the basic setup of the electroplating system, which contains an electrolyte container, an ac/dc power supply device, a water bath, a nickel anode and an air agitator. The air agitator keeps the electrolyte uniform and thus the electroplating process can be very stable.
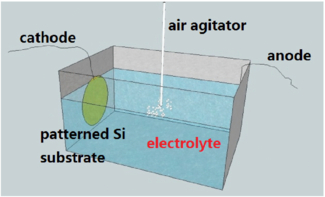
Figure 2. Setup for the electrodeposition process.
Download figure:
Standard image High-resolution imageUltrasonic cleaning of the nickel anode is selected as the pretreatment. The nickel anode is used to keep the nickel cation composition constant in the electrolyte. Meanwhile, the electroplating speed, as an important experimental factor, is influenced significantly by the electroplating system. Equation (2.1) defines the electroplating rate as the ratio of thickness over time, following the modification of Faraday's law of electrolysis [11]:
where d is the depositing thickness, t is the depositing time, ϑ is the current efficiency, M is the depositing molecular weight, z is the number of electrons, F is the Faraday constant, ρ is the metal density and j is the current density.
It could be observed that parameters of the applied power can control the electroplating rate. So it is possible to increase the applied current density to achieve higher electroplating rate. However, there is a trade-off. The greater the current density, the bigger the residual stress and this will lead to a rough morphology. In this study, three different current densities, 2 ASD, 4 ASD and 8 ASD, were designed and measured to find a proper and relatively fast parameter. Besides that, the ac current used in this experiment can also achieve better surface morphology than dc current, which can be justified by the analysis in [12]. So 500 Hz pulse current with duty cycle of 50% is applied. Finally, the electroplating rate could be affected by the distance between the anode and the cathode since the distance can greatly influence the current efficiency ϑ. Through this experiment, the distance is set to be 10 cm and smaller distance may result in higher current efficiency but at the same time may cause waste of the electrolyte and rough surface morphology.
The electrolyte is another key parameter in the plating process because the electrolyte can determine the composition of magnetic alloy. In this study, five series of samples with different composition ratios were designed, fabricated and measured which contains different atom percentages of Ni, including 100%, 93%, 80%, 50% and 30%. The example composition of electrolyte for Ni80Fe20 is listed in table 2.
Table 2. The composition of electrolyte with an atom ratio of 20:80 (Fe:Ni).
| Composition | Concentration (g/l) |
|---|---|
| NiSO4•6H2O | 187 |
| NiCl2•6H2O | 50 |
| FeSO4•7H2O | 64 |
| H3BO3 | 40 |
| NaCl | 20 |
| NaC12H25SO4 | 0.2 |
| H3PO4 | 5 |
| Saccharin | 3.5 |
4. Characteristics and discussion
4.1. Electroplating rate
From equation (2.1), it could be observed that the electroplating rate increases proportionally with the current density under a constant current efficiency. In this experiment, 500 Hz pulse current with a duty ratio of 50% was applied to keep the current efficiency constant. The electroplating rate as a function of current density is shown in figure 3.
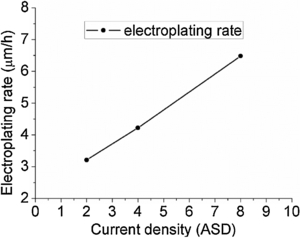
Figure 3. The electroplating rate as a function of current density.
Download figure:
Standard image High-resolution imageFrom figure 3, it can be found that the electroplating rate changes linearly with current density in accordance with equation (2.1). With the current density increasing from 2 ASD to 8 ASD, the electroplating rate is increased by 101.9% from 3.21 to 6.48 µm h−1, and the tendency of the curve shows that the two parameters are positive relative.
4.2. Surface morphology
Figure 4 shows SEM photos of the electroplated samples. It can be seen that both circular and rectangular arrays are well arranged and the surface is quite smooth. The cross-sectional view of the sample verifies that the electroplated samples are uniform and almost crack free. According to our previous research [13], it is much easier to achieve a smooth surface for electroplated alloy arrays, while a whole block of metal is likely to contain cracks and be uneven.
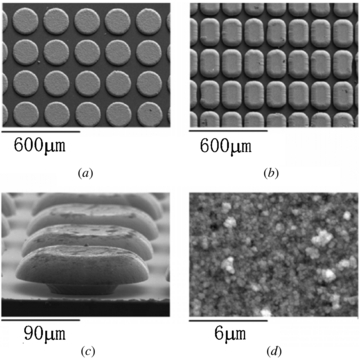
Figure 4. SEM photos of NiFe arrays. (a) Circular arrays; (b) rectangular arrays; (c) cross-sectional view; and (d) surface morphology.
Download figure:
Standard image High-resolution imageWhen the current density was further enhanced, the electroplating rate also increased, which will cause more significant residual stress in the array. This extra stress will lead to a rough surface and some cracks (as shown in figure 5) when a high current density of 8ASD is applied. At the same time, the change of thickness of the thin film can also change the state from island to continuous [14].

Figure 5. Cross-sectional view of the array fabricated under 8ASD current density.
Download figure:
Standard image High-resolution image4.3. Material composition
The material composition of the sample is analyzed by energy dispersive x-ray spectroscopy (EDS) as illustrated in figure 6. The composition of the sample is 92.7% Ni and 7.3% Fe (atomic percentage).
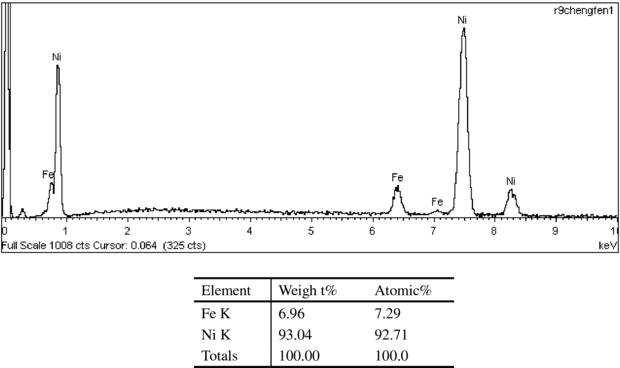
Figure 6. Energy dispersive spectrum (EDS) result of the NiFe alloy by electrolyte with Ni atom percentage of 93%.
Download figure:
Standard image High-resolution imageEffects of different electrolytes on fabricated alloy composition were also investigated. Figure 7 shows the relationship between the atom percentage of Ni in the alloy and in the electrolyte. The alloy composition is positively related to the electrolyte composition and thus it can be controlled easily through design of the electrolyte. It could be seen that there is still a slight difference between the Ni atom percentage in electrolyte and in the alloy, which may be caused by discontinuous current and other factors, including different crystal structures with different contents.
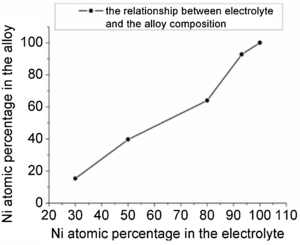
Figure 7. The Ni atom percentage in the fabricated sample versus the Ni atomic percentage in the electrolyte.
Download figure:
Standard image High-resolution image4.4. Crystal structure analysis
The crystal structure of the samples was analyzed by XRD and the result is shown in figure 8. For figure 8(a), it has two peak values at 2θ = 44.590 and 51.934 which shows that the Ni has a face-centered cubic (fcc) structure. For figure 8(b), it has a maximum point at 2θ = 43.963 and a second highest peak at 2θ = 51.558 which shows that it is a NiFe solid solution and has a face-centered cubic structure. In figure 8(c), the crystal structure of the alloy changes toward the fcc Ni (1 1 1) with preferential direction along with body-centered cubic (bcc) Fe (1 1 0) and/or bcc NiFe (1 1 1). Since Fe (1 1 0), Ni (1 1 1) and NiFe (1 1 1) show almost the same position on the diffracting angle, it is difficult to say exactly which of these structures are formed. Figure 8(d) shows that the maximal peak of the XRD occurs at 2θ = 44.90 as well as a second highest peak point at 2θ = 65.103, which proves that the alloy is bcc with preferred (1 1 0) orientation along the y-axis.
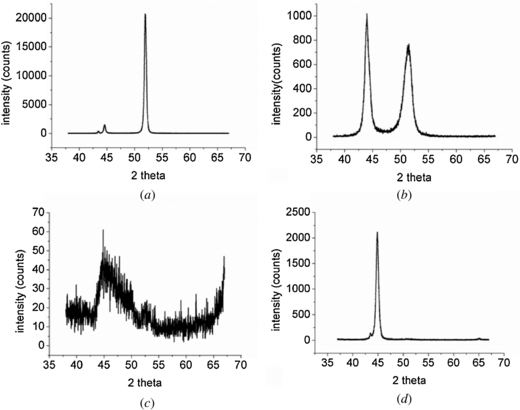
Figure 8. XRD results of four samples with different compositions: (a) Ni, (b) Fe20Ni80, (c) Fe50Ni50 and (d) Fe70Ni30.
Download figure:
Standard image High-resolution image4.5. Magnetic properties analysis
4.5.1. Typical soft magnetic properties of NiFe alloy
For soft magnetic materials applied in MEMS a, they share several special properties such as low coercivity, high magnetic flux density and high permeability. The typical magnetic properties of NiFe alloy arrays, with thin and tall magnetic hysteresis loop, are shown in figure 9. The small area of the shifting field can decrease the loss of energy during magnetization.
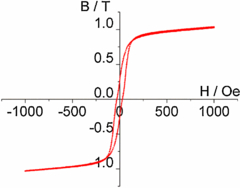
Figure 9. Typical hysteresis loop of NiFe alloy.
Download figure:
Standard image High-resolution imageFurthermore, the low coercivity and squareness ratio can also contribute to decreasing energy loss. The maximum magnetic flux density imposes restrictions on the magnetic signals the material can send and receive, thus a high magnetic flux density can help the material carry and transfer more magnetic energy. The permeability of magnetic material reflects its sensitivity to magnetic signals. With the increase of the permeability of the material, it responds to the magnetic change more quickly. So when the material is applied in magnetic signal process devices, it should have a relatively high permeability. Besides the magnetic requirements, the soft magnetic materials should also exhibit good mechanical properties, such as smooth morphology and low inner residual stress.
4.5.2. Soft magnetic properties
(A) The influence of array shapes. Table 3 shows the coercivity and squareness ratio of NiFe arrays (Ni:Fe = 80:20). It could be observed that compared with rectangular and square arrays, circular arrays exhibit the best magnetic properties. The coercivity and squareness ratio of circular arrays are the smallest among the three shapes.
Table 3. Magnetic properties comparison of three different shape arrays with approximately same area (≈2.56 mm2).
| Sample shape | Dimension (µm) | Number of units | Coercivity (Oe) | Squareness ratio |
|---|---|---|---|---|
| Circle | 602 (diameter) | 3 × 3 | 1.137 | 5.59 × 10⁻⁴ |
| Square | 533 (length) | 3 × 3 | 3.534 | 5.09 × 10⁻³ |
| Rectangle | 950 × 336 | 2 × 4 | 1.897 | 3.93 × 10⁻³ |
(B) The influence of array size. Figures 10 and 11 illustrate the coercivity and squareness ratio as a function of geometry size for circular arrays and square arrays respectively. For circular arrays, with diameter decreasing from 2257 µm to 26 µm, the coercivity achieves a 78.6% drop from 1.79 Oe to 0.383 Oe and the squareness ratio has an 65.0% drop from 1.2 × 10⁻³ to 4.2 × 10⁻⁴. Meanwhile, in figure 11, for square arrays, as the length decreases, the coercivity and squareness ratio decreased by 74.7% and 84.7% respectively.
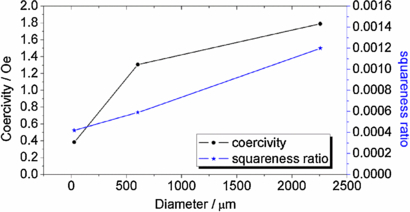
Figure 10. The coercivity and squareness ratio as a function of circular array diameter.
Download figure:
Standard image High-resolution image
Figure 11. The coercivity and squareness ratio as a function of deposited square array length.
Download figure:
Standard image High-resolution image(C) Composition influence. The main composition of five samples with the same dimensions is shown in table 4. The influence of composition on magnetic properties, including the hysteresis loop, squareness ratio and coercivity, were specifically analyzed and discussed.
Table 4. Main compositions of four samples with the same dimensions.
| Composition of the electrolyte | ||||
|---|---|---|---|---|
| NiSO4•6H2O (g/L) | NiCl2•6H2O (g/L) | FeSO4•7H2O (g/L) | Atom ratio (Fe:Ni) | |
| #1 | 187 | 50 | 0 | 0:100 |
| #2 | 187 | 50 | 64 | 20:80 |
| #3 | 130.9 | 35 | 179.2 | 50:50 |
| #4 | 56.1 | 15 | 179.2 | 70:30 |
- i.Composition influence on the shape of the hysteresis loop.As shown in figure 12, it could be seen that NiFe alloy arrays with same dimension but different compositions exhibit different hysteresis loops. From their hysteresis loops (figure 12(a)), Ni has the largest hysteresis loss and the space between the two hysteresis lines is relatively big. This indicates that the Ni sample exhibits worst soft magnetic properties because it will result in larger magnetic hysteresis loss. (b), (c) and (d) exhibit small magnetic hysteresis loss, but when comparing them from the viewpoint of perfect soft magnetic properties described in section 3.5.1, it can be concluded that (b), namely with the composition of Fe:Ni = 20:80, is the most perfect choice for its high and constant permeability and small coercivity.
- ii.Composition influence on the squareness ratio. Figure 13 shows the squareness ratio as a function of composition. When Fe content increases, the squareness ratio changes accordingly but not proportionally. The #2 samples with Fe atom percentage of 20% have the smallest squareness ratio and the smallest squareness ratio of 0.0004 is achieved by circular array C11 with Fe atom percentage of 20%.
- iii.Composition influence on coercivity. The coercivity as a function of Fe content in the alloy is shown in figure 14. It could be observed that compared with a pure Ni array (namely #1 sample with Fe atom percentage of 0), the samples of NiFe alloy arrays have a much smaller coercivity. Besides that, with increasing Fe content, the coercivity changes accordingly but not proportionally. The tendency of the change with different shapes is the same. The #2 samples with 20% Fe have the smallest coercivity and more or less Fe content means larger coercivity. The smallest coercivity of 1.016 is achieved in the circular array C11 with diameter of 102.6 µm.
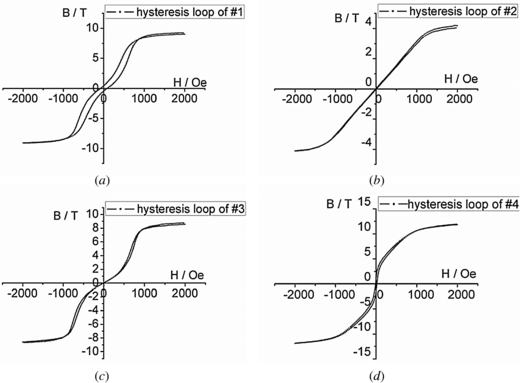
Figure 12. Four different hysteresis loops for different compositions, (a) Ni, (b) Fe20Ni80, (c) Fe50Ni50 and (d) Fe70Ni30.
Download figure:
Standard image High-resolution image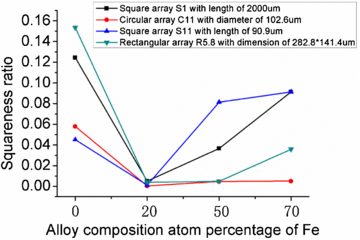
Figure 13. Squareness ratio as a function of atom percentage of Fe.
Download figure:
Standard image High-resolution image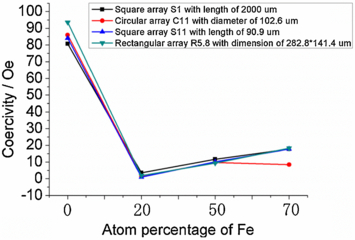
Figure 14. Coercivity as a function of atom percentage of Fe.
Download figure:
Standard image High-resolution image4.6. New application of the NiFe alloy arrays
For further research, based on the NiFe array electrodeposition technique, a high Q (quality factor) MEMS inductor integrated with soft magnetic core was designed and fabricated as a demonstration of applications as shown in figure 15. In this device, the NiFe alloy array is utilized as the magnetic core surrounded by copper coils. A comparison between inductors with magnetic core and air core was done. As shown in figure 16, by adding a soft magnetic core, the inductance of the MEMS inductor could be improved by 125% from 45 nH to 100 nH at 140 MHz as well as the quality factor could be enhanced by 18% from 4.62 to 5.45. Moreover, the electrodeposition technique also allows all of the fabrication processes to be integrated, simple and low cost, which can be used as a common method in many other MEMS areas.
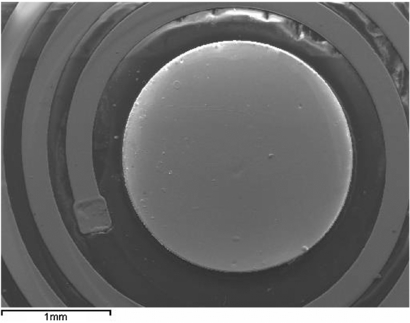
Figure 15. Micro inductor with core material of Ni80Fe20.
Download figure:
Standard image High-resolution image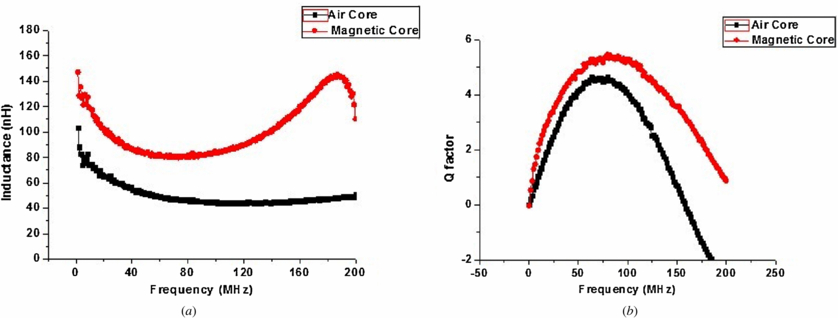
Figure 16. Comparison of inductors with Ni80Fe20 magnetic core and air core, (a) for inductance and (b) for Q factor.
Download figure:
Standard image High-resolution image
5. Conclusion
In this paper, a small coercivity of 0.383 Oe, a small squareness ratio of 4.21 × 10⁻⁴ and a high saturation magnetization of 4.2 T have been successfully achieved in circular NiFe soft magnetic arrays within 2000 × 2000 µm2 area. Considering the soft magnetic properties of these samples, with decreasing array unit size, the coercivity and squareness ratio both decrease. Among arrays with three different shapes, the circular arrays usually exhibit the best soft magnetic properties. Moreover, the composition is also a key factor affecting the soft magnetic properties of the alloy array. Generally, it is concluded that the alloy array with Fe atom percentage of 20% has the best soft magnetic properties, such as lowest coercivity, lowest squareness ratio and most perfect hysteresis loop which stands for lowest magnetic hysteresis loss. The application of this micro fabricated soft magnetic array is also researched and demonstrated which can be used in many MEMS fields including energy harvesting, sensors and actuators.
Acknowledgments
This work was supported by Fund of National Natural Science Foundation of China (no 61176103, and no 91023045), 863 project (no 2013AA041102) and National PhD Foundation Project (20110001110103).