

Abstract
We present a detailed study of the superconducting properties of the weakly pinned, quasi-two-dimensional superconductor 2H-NbSe2, and its intercalated variant NbSe2{CoCp2}0.26. The intercalation of 2H-NbSe2 with the organometallic donor molecule cobaltocene (CoCp2) hardly affects the superconducting properties within the layers. However, the properties perpendicular to the layers change significantly due to the large expansion of the layer spacings of the host lattice in the c-direction by a factor of about two. In particular, the superconducting anisotropy factor Γ increases from 3.3 in the parent compound 2H-NbSe2 up to 4.4 in the intercalated species. Therefore, NbSe2{CoCp2}0.26 is an excellent candidate to analyze how the anisotropy effects the superconducting mechanism in layered dichalcogenides, and to evaluate the various models proposed in the literature to account for the anisotropy in 2H-NbSe2. While a two-gap model and an anisotropic single-gap model are competing concepts to describe the almost linear T2-dependence of ΔC/T in low-dimensional dichalcogenides, our comparative study suggests that a single-gap model with an anisotropic Fermi-surface is sufficient to capture the ΔC/T(T) behavior in our samples qualitatively.
Export citation and abstract BibTeX RIS
1. Introduction
Among the numerous studies dealing with the incidence and nature of superconductivity, low-dimensional materials play an increasingly important role as benchmark and model systems [1]. The reason for this is closely connected with the discovery of novel quasi-one or two-dimensional superconductors, such as the rare-earth transition metal carbide Sc3CoC4 [2, 3], or the boride MgB2 and the intercalated, iron-based selenides LixFe2Se2(NH3)y [4, 5], respectively. Here we report on superconductivity in the new highly anisotropic layered dichalcogenide NbSe2{CoCp2}0.26, where cobaltocene (CoCp2 = (C5H5)2Co) represents an intercalated electronic donor molecule.
Quasi-two-dimensional (2D) intercalation compounds of transition metal dichalcogenide superconductors are typically characterized by highly pronounced anisotropic electronic properties [1]. Despite extensive studies, the superconducting mechanism of this class of compounds is still poorly understood. Among these compounds, 2H-NbSe2 represents perhaps the most prominent low-dimensional material studied during the past fifty years [6]. After the discovery of the high temperature superconductor MgB2 [4], a benchmark system for multi-band superconductivity [7], 2H-NbSe2 experienced a renaissance of research activities [8]. In particular, it represents a well-suited candidate for probing the multi-band model in a 2D superconductor, due to the negligible extent of vortex pinning. Furthermore, the critical temperature of Tc = 7.2 K is the highest temperature reported hitherto for dichalcogenid systems [9]. Besides this, 2H-NbSe2 shows a re-entrant peak effect, as evidenced by resistivity and AC-susceptibility measurements [10]. An additional feature is the presence of a charge density wave (CDW) transition at the Peierls-temperature TCDW = 33 K [11]. The reason for the origin and emergence of such a CDW in NbSe2 remains up to now an unresolved question [12].
In order to enhance the anisotropic character we designed the geometrical and electronic structure of 2H-NbSe2 via the intercalation of high quality 2H-NbSe2 single crystals with the organometallic donor molecule cobaltocene (CoCp2), which also acts as a spacer molecule causing almost a doubling of the layer spacings in the c-direction upon intercalation. While the intercalation by electronically inert organic guest molecules is reported to reduce the superconducting transition temperature Tc from 7.2 K in 2H-NbSe2 to temperatures below Tc < 3 K [9], an opposite behavior is observed in NbSe2{CoCp2}0.26 upon intercalation with the electronic donor molecule cobaltocene. Tc is slightly raised with respect to the original host lattice to
 . Furthermore, susceptibility, specific heat, and resistivity studies (parallel and perpendicular to the 2H-NbSe2-layers) of NbSe2{CoCp2}0.26 reveal unusual pinning properties as well as a non-BCS-like linear T2-dependence of ΔC/T sequences. A re-entrant peak effect, known from the host species 2H-NbSe2 [10], is also observed. Therefore, NbSe2{CoCp2}0.26 may be a good candidate for a comparative study to distinguish between different anisotropic superconducting models, like the two-gap model [8] or the anisotropic single-gap model [13].
2. Sample preparation and characterisation
2H-NbSe2 single crystals have been synthesized via chemical transport in sealed quartz-ampoules (length: 150 mm; inner diameter: 10 mm) with iodine as a transport agent in a tube-furnace. The transport reaction was carried out using a temperature gradient: source (T1 = 840 °C) and sink (T2 = 600 °C). Plate-like NbSe2 single crystals were isolated and intercalated with cobaltocene (CoCp2) in acetonitrile (CH3CN) at a temperature of 65 °C under inert gas conditions (Ar) for four weeks and characterized by ESEM micrographs, ICP-OES (Ionic Coupled Plasma-Optical Emission Spectroscopy), x-ray powder diffraction, and physical property measurements. The sample stoichiometry of one part of the same batch was determined via ICP-OES as NbSe2{CoCp2}0.26 [14].
Figures 1(a) and (b) show an ESEM-micrograph of the crystalline host material 2H-NbSe2 and of the intercalated NbSe2{CoCp2}0.26 sample at the same magnification, respectively. Both images show the hexagonal shape of native and intercalated 2H-NbSe2 crystals. The partial exfoliation of the NbSe2 lattice as a direct consequence of the intercalation process is clearly visible and documents the successful filling of the van der Waals gaps inbetween the individual (NbSe2)-layers. A subsequent x-ray powder analysis reveals a stage-one-type intercalation variant since all the interlayer gaps in 2H-NbSe2 are at least partially filled.
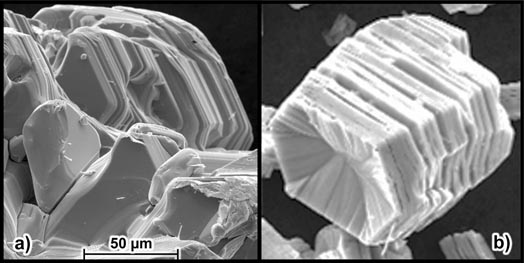
Figure 1. ESEM-micrograph of (a) 2H-NbSe2 and (b) NbSe2{CoCp2}0.26 crystals reflecting the layered structure of these materials.
Download figure:
Standard image High-resolution imageIn figure 2 the powder diffraction pattern of 2H-NbSe2 is plotted. A strong preferred orientation of the powder samples was observed due to the pronounced two-dimensional shape of the 2H-NbSe2 crystals. In order to determine precise lattice parameters for the host as well as the intercalated lattice, a Le Bail profile fitting as implemented in the Jana2006 program [15] has been used. The lattice constants of 2H-NbSe2, which crystallizes in the hexagonal space group P63/mmc, have been determined to a = 0.344 570(7) nm and c = 1.255 00(4) nm. The sharp Bragg-peaks and the absence of additional reflections are in line with the high crystal-quality and purity of the sample. Upon intercalation, the 00ℓ-series of the host lattice (the blue curve in figure 2) shifts to lower diffraction angles (the green curve in figure 2) in agreement with the expected expansion of the inter-layer spacing, yielding a new c-axis parameter of 2.3697(1) nm, whereas the a-axis expands only slightly to a = 0.346 460(7) nm. Since each unit cell contains two NbSe2-layers (with the Nb-atoms located at z = 0.25 and z = 0.75, where z is the fractional atomic coordinate along the c-axis), the layer expansion corresponds to Δc/2 = 0.5574 nm. This is in good agreement with the value published by Dines et al for the layer expansion upon CoCp2 intercalation (Δc = 0.556 nm [16]). We note that the Bragg-intensities from the host lattice vanished completely. This suggests that the intercalation process was complete (the green curve in figure 2) in line with an intercalation degree of 0.26, which is close to the theoretical limit of x = 0.336 in related dichalcogenides such as SnSe2 [17].

Figure 2. Comparative powder x-ray diffraction studies of the 2H-NbSe2 (blue, bottom) and the intercalated species 2H-NbSe2{CoCp2}0.26 (green, top). The vertical lines below the patterns indicate the refined peak positions according to the space group P63/mmc of 2H-NbSe2 and its intercalated species.
Download figure:
Standard image High-resolution imageA further indicator for the high quality of the samples is the residual resistivity ratio (RRR). In the case of 2H-NbSe2 the RRR is determined to be 37 between 7.5 K and 300 K. This value is higher than most of the values discussed in the literature [18–21]. For the intercalated sample the RRR = 33 is slightly reduced indicating—if at all—a marginal loss of the crystallinity.
3. Experimental details
The diffraction patterns depicted in figure 2 were measured in transmission mode on a HUBER Guinier diffractometer equipped with a Mo-Kα1-source (2H-NbSe2), or alternatively with a Cu-Kα1-source (NbSe2{CoCp2}0.26) and a HUBER G670 Guinier camera. The background intensity was removed using the DIFFRACplus EVA software (Bruker AXS, Germany). For better comparison in figure 2, the 2θMo axis for the pattern of 2H-NbSe2 has been rescaled to Cu-Kα1 radiation.
The DC magnetic susceptibility measurements were performed between 2 K and 300 K in an applied magnetic field of up to 5 T using a commercial SQUID magnetometer (MPMS-7) from Quantum Design. To align the single crystals parallel and perpendicular to the magnetic fields, small single crystalline plates (⩽4 mm × 2.5 mm edge lengths) were embedded in NaCl powder (5 N; Alfa Aesar) and confined by two quartz glass rods inside a straw to prevent sample reorientation during the measurement. The accuracy of the individual crystal orientation with respect to the field is estimated to be better than ±5°. For the AC susceptibility we used a SQUID Magnetometer (MPMS-5) with an AC-option, and for magnetic fields up to 14 T a state of the art SQUID-VSM system from Quantum Design was utilized. The specific heat experiments were performed with a commercial physical property measurement system (PPMS) equipment between 2 K and 300 K in magnetic fields up to 5 T. For the electrical transport measurements we performed a four probe method using the PPMS. To avoid Lorentz currents, the external magnetic field and the current flow were applied in the same direction parallel to the layers. The dimensions of the single crystal employed for the resistivity measurements were 3.4 mm × 0.6 mm (thickness d ≈ 150 µm), and the distance between the current and voltage contacts (size ≈0.6 mm × 0.4 mm) was ≈2.4 mm and 0.7 mm, respectively.
4. Experimental results and discussion
4.1. Susceptibility
The temperature dependent magnetic dc-susceptibility (χV(T)) of NbSe2{CoCp2}0.26 is depicted in figure 3 for zero field cooled (ZFC) and field cooled (FC) cycles in a low magnetic field applied perpendicular and parallel to the ab-planes. For the ZFC sequence the sample was first cooled down to 2 K in a zero field, where the earth magnetic field was compensated within an error bar of 1 µT by the so-called TinyBee setup described in detail in [22]. In the subsequent heating run a small magnetic field of μ0H = 0.5 mT was applied to record the susceptibility data up to 8 K. For the susceptibility measurements with H perpendicular to the ab-plane (H⊥ab) a demagnetization factor of N = 0.8 was taken into account. This factor is estimated experimentally by measuring a lead plate with a shape nearly identical to the investigated sample (≈4 mm × 2.5 mm; slight trapezoid). For the volume susceptibility χV we calculated the density of NbSe2{CoCp2}0.26 from the lattice parameters and the stoichiometry of the sample known from the ICP-OES and elementary analysis, resulting in a value of ρ = 4.052 g cm−3.
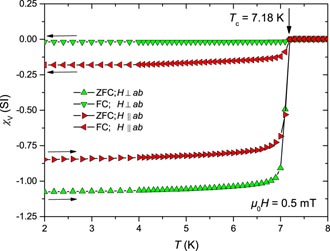
Figure 3. ZFC and FC volume susceptibility (χV) of NbSe2{CoCp2}0.26 with μ0H perpendicular and parallel to the ab-planes. For the measurement with H ⊥ ab a demagnetization factor of N = 0.8 was considered.
Download figure:
Standard image High-resolution imageIn figure 3 all χV(T) curves exhibit a sharp superconducting transition at Tc = 7.18 K for the ZFC and FC procedures. This critical temperature is virtually identical to the one of the host substance and is slightly smaller than
estimated from our resistivity studies (section 4.3, figure 7(a)). This result is remarkable due to the fact that previous intercalations of 2H-NbSe2 with electronically innocent guest molecules yielded a significant reduction of Tc and values between 0.6 K and 6.88 K [9, 19, 21, 23, 24].
Furthermore, the χV(T)-data of NbSe2{CoCp2}0.26 show some deviation from an ideal bulk superconducting behavior. In the ideal case, the ZFC procedure in low magnetic fields results in a complete shielding state of the sample with χV = −1 at low temperatures. The FC measurement provides information about the strength of the flux expulsion due to the Meissner effect. In the case of hard type-II superconductors, such as the high temperature superconductor YBaCuO [25], a superconducting volume susceptibility in the range of −1 ⩽ χV ⩽ −0.5 is usually expected, in contrast to our findings for NbSe2{CoCp2}0.26 with χV ≈ −0.05 (H ⊥ ab).
For NbSe2{CoCp2}0.26 we observed in the case of H || ab that the ZFC procedure results in a partial screening (χV > −1), mainly due to the presence of a normal state region in the van der Waals gap between the (NbSe2)2 layers. On the other hand for H ⊥ ab a full screening is expected. The deviation of 7% from the ideal value may be due to the error in the determination of the demagnetization factor or the sample density. For the FC measurement with H || ab the sample is exposed to a maximal field of μ0H = 0.5 mT due to the vanishing demagnetization factor. This leads to a flux expulsion in the superconducting planes but not in the inter-layer space. Therefore, the resulting intermediate phase gives rise to a small but not negligible Meissner-phase. On the contrary, for H ⊥ ab the demagnetization factor is close to one, due to the plate-like shape of the sample. This may lead to local magnetic fields higher than μ0Hc1⊥, resulting in flux-penetration with vortex field strengths higher than μ0Hc1⊥. As a result, the Meissner effect may be superimposed by this flux pinning process and therefore only a negligible Meissner effect is observed.
This deviation from an ideal superconducting behavior strongly points to a pronounced anisotropic superconductor with a layered structure of superconducting planes which are weakly coupled by van der Waals forces.
4.2. Critical magnetic fields and Ginzburg–Landau parameters
In order to calculate the microscopic superconducting parameters like the London penetration depth (λ), the GL coherence length (ξ), and the GL parameter (κ), the lower and upper critical fields perpendicular and parallel to the ab-planes are determined from magnetization curves and from temperature dependent specific heat and resistivity measurements in various magnetic fields.
The lower critical fields of 2H-NbSe2 and NbSe2 {CoCp2}0.26 are estimated from magnetization measurements μ(μ0H) at very low magnetic fields, using the high resolution of μ0 ΔH = 1 µT increments accomplished by the TinyBee setup [22]. In figure 4(a) the magnetic moment versus magnetic field for 2H-NbSe2 in the case of H perpendicular to the ab-planes at 2 K is plotted in the range between 0 and 4 mT using minute increments of μ0 ΔH = 0.025 mT. The linear fit (employing μ(H) data below 0.5 mT) shows the first deviation from the magnetization curve at approximately 1 mT. According to a common procedure in the literature (see, e.g. [26]) the latter value can therefore be employed to specify μ0Hc1 at 2 K. This is in accordance with the kink in the derivative
 , as shown in figure 4(b). This kink in the derivative
is, however, a more stringent criterion for the determination of μ0Hc1, because its location is less dependent on the choice and size of the fitting range and was therefore used to extract the Hc1 values. This assessment is a sensitive indicator to identify the magnetic field μ0Hc1, which is defined as the field where the first flux in the form of a quantized vortex penetrates the sample and starts to increase continuously with an increasing magnetic field [1]. It should be mentioned that for NbSe2,
(μ0H) shows a slight increase for small fields in both field orientations, which may be due to a small flux penetration caused by sample inhomogeneities, thereupon the magnetic flux penetrates the sample in the form of quantized vortexes visible by a pronounced increase in the derivative
, as shown in figures 4(b) and (c).
, as shown in figure 4(b). This kink in the derivative
is, however, a more stringent criterion for the determination of μ0Hc1, because its location is less dependent on the choice and size of the fitting range and was therefore used to extract the Hc1 values. This assessment is a sensitive indicator to identify the magnetic field μ0Hc1, which is defined as the field where the first flux in the form of a quantized vortex penetrates the sample and starts to increase continuously with an increasing magnetic field [1]. It should be mentioned that for NbSe2,
(μ0H) shows a slight increase for small fields in both field orientations, which may be due to a small flux penetration caused by sample inhomogeneities, thereupon the magnetic flux penetrates the sample in the form of quantized vortexes visible by a pronounced increase in the derivative
, as shown in figures 4(b) and (c).
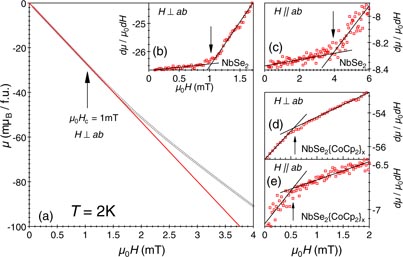
Figure 4. (a) The initial magnetization curve μ(μ0H) up to 4 mT of NbSe2 with H perpendicular to the ab-planes at T = 2 K. The red line is a linear fit to the magnetization data below 0.5 mT. In the insert (b) the first derivative of the magnetic moment μ with respect to the magnetic field μ0H is plotted versus μ0H in the range between 0 and 1.7 mT. The solid lines are linear fits to the data. The point of intersection defines μ0Hc. Such a plot is also shown in (c) for NbSe2 with H parallel to the ab-planes and in (d) and (e) for NbSe2{CoCp2}x(x = 0.26) with H perpendicular and parallel to the ab-planes, respectively.
Download figure:
Standard image High-resolution imageIn contrast to this, figures 4(d) and (e) show for the intercalated sample NbSe2{CoCp2}0.26 a strong initial flux penetration. At a distinct magnetic field the slope of the derivative
changes to smaller values indicating a reduced rate of flux penetration. This unusual behavior hints at unquantized flux penetration in the intercalated 2H-NbSe2 already below Hc1. This observation is likely explained by the large spacial separation of the superconducting layers. In the case of magnetic fields above Hc1, the screening currents become sufficiently large to channel the flux into quantized vortices. Since the spacial extent of a vortex, given by the penetration depth λ, is far larger than the layer distance in 2H-NbSe2, the vortex penetration rate above Hc1 remains essentially unaffected by the subtle and additional increase in the inter-layer distance due to the intercalation of the cobaltocene molecules.
The lower critical field μ0Hc1 at zero temperature is determined by extrapolating the magnetic field data at 2 K and Tc, using the empiric parabolic relation [27]

by taking into account a demagnetization factor of N = 0.8 for the applied field H perpendicular to the ab-planes. The resulting lower critical field values with H parallel and perpendicular to the ab-planes are depicted in figures 4(b)–(e) and are summarized in table 1 for NbSe2 and NbSe2{CoCp2}0.26, respectively.
Table 1. Overview of the superconducting parameters of 2H-NbSe2 and the intercalated species NbSe2{CoCp2}0.26 from this work, in comparison with selected studies from the literature [8, 40–42].
| 2H-NbSe2 | 2H-NbSe2 | 2H-NbSe2 | 2H-NbSe2 | 2H-NbSe2 | NbSe2{CoCp2}0.26 | |
|---|---|---|---|---|---|---|
| [40] | [41] | [42] | [8] | this work | this work | |
| Tc | 7.38 K | 7.07 K | 7.15 K | 7.15 K | 7.15 K | 7.35 K |
| μ0Hc2|| | 12.5 T | 17.3 T | 12.3 T | 14.1 T | 18.5 T | |
| μ0Hc2⊥ | 4.3 T⋆ | 3.65 T | 5.3 T | 4.1 T | 4.3 T | 4.2 T |
| μ0Hc1|| | 3.9 mT | 4.24 mT | 0.58 mT | |||
| μ0Hc1⊥ | 9 mT | 5.49 mT | 3.13 mT | |||
| λ|| | 69 nm | 265 nm | 330 nm | 455 nm | ||
| λ⊥ | 230 nm | 797 nm | 524 nm | 3561 nm | ||
| ξ|| | 7.7 nm | 9.5 nm | 7.88 nm | 9 nm | 8.75 nm | 8.86 nm |
| ξ⊥ | 2.3 nm | 2.8 nm | 2.42 nm | 3 nm | 2.67 nm | 2.02 nm |
| κ|| | 30 | 72 | 29 | 86 | 86 | 300 |
| κ⊥ | 9 | 21 | 11 | 30 | 38 | 51 |
| δC/γTc | 1.97 [13] | 1.96 | 2.14 | 2.12 [29] | 2.05 | 1.43 |
Note: The symbols || and ⊥ refer to directions parallel and perpendicular to the ab plane, respectively. The ⋆ marks the upper critical fields Bc2⊥, which is estimated from figure 2 in [40].
The upper critical fields Hc2 perpendicular and parallel to the ab-planes are extracted from specific heat and resistivity measurements, respectively (for details see below). For NbSe2{CoCp2}0.26, the electronic contribution to the specific heat divided by temperature ΔC/T is plotted for H perpendicular to the ab-planes versus T2 in various magnetic fields up to 5 T in figure 5(a). The critical temperature is suppressed gradually by the magnetic field from Tc = 7.12 K to a temperature below 2 K for μ0H > 5 T. The specific heat discontinuity at Tc(0) of δC/T ≃ 31.6 mJ mol−1 K2 divided by the Sommerfeld coefficient in the normal state γ ≃ 22.1 mJ mol−1 K2 yields the thermodynamic ratio δC/γTc = 1.43, which surprisingly matches the expected value of 1.43 for a weakly coupled BCS superconductor [28]. In contrast to this, a somewhat higher δC/γTc ratio is observed in the parent compound 2H-NbSe2 with varying values between 1.96 and 2.12, which may be connected to a more pronounced electron-phonon coupling (see table 1 and [29, 30]). Such enhanced values are generally known for layered superconductors, e.g. FeSe (δC/γTc = 1.65) [31].

Figure 5. (a) Temperature-dependent electronic contribution of the specific heat plotted as ΔC/T versus T2 of NbSe2{CoCp2}0.26 for various magnetic fields (as labeled) perpendicular to the ab-planes. (b) Temperature-dependent electrical resistivity for various magnetic fields (as labeled) parallel to the ab-planes.
Download figure:
Standard image High-resolution imageFurthermore, it should be mentioned that the nearly linear trend in the ΔC/T versus T2 plot below Tc of NbSe2{CoCp2}0.26 (figure 5(a)) is also observed in the parent species [13, 29, 30]. This linearity is unusual for single band s-wave superconductors. A similar superconducting behavior is also found in the intermetallic compound MgB2, which is discussed with respect to a second superconducting band at the Fermi level [32]. In particular, for the host sample 2H-NbSe2, Huang et al proposed that a two-gap scenario is more favorable than an anisotropic s-wave model [29]. We will outline in the following that the latter proposal is not supported by our own study. We give a more detailed discussion and comparison to the model calculations in section 5.
For NbSe2{CoCp2}0.26 the temperature dependency of the in-plane resistivity in various magnetic fields is shown in figure 5(b) in the temperature range between 1.8 K and 8 K. Towards lower temperatures, after the initial steep drop of the resistivity due to the onset of superconductivity, the sample shows a finite resistivity, which again vanishes on further cooling. This observed reentrant behavior is also known from the host sample 2H-NbSe2 [33]. The out-of-plane resistivity behavior could, however, not be determined, although a special set-up was used as described in [34].
In figure 6 the phase diagrams of the upper (a) and lower (b) critical magnetic fields parallel and perpendicular to the ab-planes are presented. For μ0Hc2∥ the critical temperatures are obtained from the 50% values of the normal state resistivity (figure 5(b)) slightly below the onset of superconductivity. For Hc2⊥ the Tc data are determined at that temperature, where the specific heat discontinuity of the superconducting anomaly reaches half of the values δC/T (figure 5(a)). For both branches (H || ab and H ⊥ ab in figure 6(a)) we extrapolate the μ0Hc2 values in the linear region between 2 and 6 K down to zero temperature taking into account the WHH-theory [35]. It should be mentioned that a positive curvature of μ0Hc2∥(T) is observed just below Tc, which is not in line with the WHH-theory. However, this feature appears to be a characteristic Hc2∥(T) signature observed in many layered superconductors (see chapter 6 in [1]), and in particular also in the host substance 2H-NbSe2 [8]. This positive, upward curvature may be due to the onset of a dimensional cross-over [36], or caused by an anisotropic Fermi-surface [20]. The phase boundaries of the lower critical fields down to zero temperatures are generated from the values of the lower critical fields at 2 K (see figures 4(d) and (e), 5 K and from the Tc values at H = 0, using the empiric relation for μ0Hc1(T) (see equation (1)). The resulting lower and upper critical field values at T = 0 K are tabulated in table 1, in comparison with selected results of the host sample 2H-NbSe2.
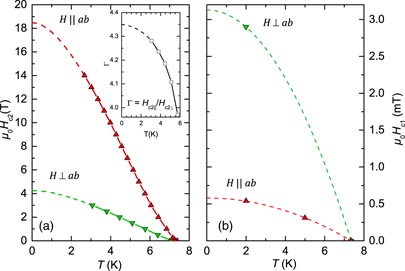
Figure 6. (a) Temperature dependence of the upper critical magnetic field, μ0Hc2, and (b) of the lower critical field, μ0Hc1, perpendicular and parallel to the NbSe2 planes of NbSe2{CoCp2}0.26. The insert displays the temperature dependent anisotropy factor Γ. The solid lines are guides for the eyes. The dashed lines are fits to the data according to the WHH-theory [35] for μ0Hc2(T) and to the empiric relation (see equation (1)) for μ0Hc1(T), respectively.
Download figure:
Standard image High-resolution imageThe upper critical field ratio Hc2||/Hc2⊥ of NbSe2 {CoCp2}0.26 defines the anisotropy factor Γ, which is about 4.4 at T = 0. This value is 34% larger than that of 2H-NbSe2 and is similar to those values found in different single crystalline MgB2 samples (for an overview see [37]). For both species, NbSe2 and MgB2, a multi-band scenario is discussed in the literature, which goes along with a temperature dependent anisotropy factor Γ(T) [8, 37]. Such behavior is also observed in NbSe2{CoCp2}0.26 (insert of figure 6(a)), but the change of the anisotropy per Kelvin
 of approximately 0.075 K(−1) is two times smaller than in MgB2—the benchmark system for multi-band superconduction. This may be due to different determination methods of Γ(T) [8, 37, 38]. Even though the change of Γ(T) is smaller in comparison to MgB2, this criterion does not disqualify NbSe2{CoCp2}0.26 as suitable candidate for a multi-band scenario at this stage of our analysis.
For a detailed comparison between 2H-NbSe2 and NbSe2{CoCp2}0.26 we also calculated the microscopic superconducting parameters ξ, λ, and κ directly from the critical magnetic fields according to the anisotropic GL theory [1]. Here the GL coherence length ξGL is extracted from the upper critical field using the following equations:

with the flux quantum Φ0 = h/2e. The London penetration depth λ is extracted from the lower critical field:

with the GL-parameters

which are extracted from microscopic superconducting parameters.
All the quantities are presented in table 1 together with those of selected studies in order to compare our results of the host species 2H-NbSe2 with former findings in the literature (see, [8, 40–42]). First of all it should be mentioned that within the variation of different calculations and measurement procedures, the superconducting quantities like ξ, λ, and κ of the parent compound 2H-NbSe2 are in good agreement with previous results. The direct comparison between the host species and NbSe2{CoCp2}0.26 surprisingly reveals that the microscopic superconducting GL quantities, ξ|| and λ||, remain almost unchanged within the layers upon CoCp2 intercalation. On the contrary, the coherence length perpendicular to the layers ξ⊥ diminishes by 25% after CoCp2 intercalation, and is of the order of the inter-layer distance of the intercalated species. In addition, the penetration depth parallel to the layers λ|| is approximately of the same order of magnitude for both species, whereas for λ⊥ a drastic increase by a factor of 4.5 is observed between the host and the intercalated sample, respectively.
This analysis emphasizes the outstanding character of the intercalated samples, as the superconducting properties within the layers remain almost unchanged but change significantly perpendicular to the layer along the c lattice parameter. This is a surprising result since cobaltocene (CoCp2) is an electronic donor molecule, which is capable of transferring its unpaired electron into the conduction band of suitable host materials which might act as electron acceptors. Indeed, the electron transfer is indicated by an enhancement of the Sommerfeld coefficient γ in the intercalated sample (NbSe2: γ = 18 mJ mol−1·K−2; NbSe2{CoCp2}0.26: γ = 22 mJ mol−1 · K−2) and a vanishing local magnetic moment at the intercalated cobaltocene molecules in the normal state. However, the superconducting properties of the parent lattice do not change significantly within the layers upon the intercalation.
Within the framework of the anisotropic GL theory, it is expected for a single gap anisotropic superconductor that the ratio of the upper critical field Hc2||/Hc2⊥ equals the ratio of ξ|| / ξ⊥, λ⊥ / λ|| and κ|| / κ⊥ [1]. The anisotropy factor Γ ≈ 3.3 of 2H-NbSe2 can be extracted from its Hc2- and ξ-ratio. In 2H-NbSe2, the ξ-ratio is slightly larger than the corresponding λ- (1.6) and κ-ratio (2.2). For the intercalated sample NbSe2{CoCp2}0.26 we observe a higher anisotropy factor of about 4.4, which is equal to the ξ ratio, but is significantly smaller than the λ- (7.8) and κ-ratio (5.9). These results therefore suggest that the anisotropic superconducting behavior in NbSe2{CoCp2}0.26 cannot be described and modeled within the framework of the anisotropic GL theory involving an anisotropy in the effective masses [1]. This is especially true for a pronounced anisotropic system where the layer distance is of the same order of magnitude as the coherence length [10]. An alternative approach for the description of a layered superconductor based on Josephson-coupled 2D layers leads to a somewhat different expression for Hc1|| [39]. However, the numerical values for the λ- and κ-ratio for NbSe2{CoCp2}0.26 are almost identical to those obtained above.
4.3. Peak effect
As mentioned in section 4.2 the temperature-dependent in-plane resistivity in various magnetic fields shows a reentrant superconducting behavior (see figure 5(b)). This behavior is directly associated with a peak effect which is frequently found in layered type-II superconductors, including the host sample 2H-NbSe2 (see, for example, [43]). The observed peaks in the resistivity data ρ(T) in figure 5(b) might be a consequence of two competing mechanisms: superconductivity and flux motion controlled resistivity. Therefore, an analysis of the temperature-dependent resistivity could provide a measure of the average vortex velocity. For conventional low temperature superconductors this effect is primarily observed in the regime of the upper critical field μ0Hc2 and indicates the presence of different superconducting phases arising from a change of flux motion [44]. For example, a highly dense vortex liquid phase is expected below μ0Hc2, when the layer separation, d, is of the same order of magnitude as the coherence length ξ [10]. For NbSe2{CoCp2}0.26 this criterion is nearly fulfilled when the magnetic field is applied perpendicular to the layers. In that case d becomes compatible in magnitude with ξ⊥/2 (see table 1).
In order to deal more precisely with the temperature dependent resistivity in the superconducting phase of NbSe2{CoCp2}0.26 we present in figures 7(a) and (b) enlarged plots of ρ(T) near Tc in two selected magnetic fields, 0 T and 10 T, respectively. In a zero magnetic field, NbSe2{CoCp2}0.26 exhibits the highest superconducting critical temperature,
, observed so far in the intercalated or substituted 2H-NbSe2 samples (see section 4.1). Towards lower temperatures and after the initial superconducting drop, the resistivity shows a pronounced shoulder around 7.4 K, followed again by a steep drop until ρ(T) vanishes on further cooling. This observation hints at two competing mechanisms which control the ρ(T) behavior of the intercalated NbSe2 phases. In order to identify this additional contribution a single superconducting transition has been modeled by a Boltzmann-type sigmoidal function to fit the experimental data (disregarding the temperature region between 7.2 K and 7.4 K). In figure 7(a) the dashed red line depicts the superconducting transition according to the Boltzmann-type sigmoidal function:

with ρhigh being the normal state resistivity at T = 8 K and ΔT the slope factor. Here, Tc = 7.39 K is calculated from the ρfit-data (the dashed red line in figure 7(a)) and taken as the temperature, where the resistivity drops by 50% with respect to the value of the normal state resistivity at 8 K. Subtracting the received superconducting contribution from the experimental data results in a peak-like feature (the solid green line in figure 7(a)). From this differential curve two characteristic temperatures are obtained. Tp1(T) is defined by the intersection of the Boltzmann curve with the difference curve, and Tp2(T) marks the position of the maximum of the extracted peak. With increasing magnetic fields the shoulder shifts to lower temperatures, until it renders into a separate peak, whose height increases with increasing fields (figure 7(b)). In this case, Tp1 and Tp2 are marked as the local minimum and maximum of ρ(T), respectively. The results of this investigations are summarized in the H-T-phase diagram for H|| in figure 9(a). It should be mentioned that the H-T-phase diagrams of the intercalated sample and the host substance in the highly dense vortex liquid phase are very similar, with exception of the upper critical field area [14].

Figure 7. An enlarged presentation of the temperature dependent electrical resistivity in an applied magnetic field of (a) 0 T and b) 10 T perpendicular to the layers. In (a) the red dashed line represents the Boltzmann sigmoidal function adapted to the data, and the green line is the differential plot between the measured data and the adapted curve. For the definitions of the temperatures
 , Tc, Tp1 and Tp2 see text.
Download figure:
Standard image High-resolution imageThe presence of a peak effect is also supported by AC-susceptibility measurements. In figures 8(a) and (b) the imaginary and real part of the AC-susceptibility,
 and
and
 , are plotted for NbSe2{CoCp2}0.26 in an applied magnetic DC-field of 2 T and 3T perpendicular to the layers. Similar to the resistivity measurements, a pronounced peak effect is determined from the AC-susceptibility data. For
a distinct peak develops, again characterized by the two temperatures Tp1 and Tp2, which mark the local minimum and the local maximum, respectively. However, in the cases of
the situation is reversed (see figures 8(a) and (b)). The resulting temperature-dependent characteristic magnetic fields, μ0Hp1⊥(T) and μ0Hp2⊥(T), are summarized in the H-T-phase diagram for H⊥ in figure 9(b). In the case of H||(T) (figure 9(a))
and
could only be analyzed up to 0.6 T. Nevertheless, for this low field region the H||(T) values of the characteristic temperatures, determined from the susceptibility data, nicely agree with the values from the resistivity measurements [14].
, are plotted for NbSe2{CoCp2}0.26 in an applied magnetic DC-field of 2 T and 3T perpendicular to the layers. Similar to the resistivity measurements, a pronounced peak effect is determined from the AC-susceptibility data. For
a distinct peak develops, again characterized by the two temperatures Tp1 and Tp2, which mark the local minimum and the local maximum, respectively. However, in the cases of
the situation is reversed (see figures 8(a) and (b)). The resulting temperature-dependent characteristic magnetic fields, μ0Hp1⊥(T) and μ0Hp2⊥(T), are summarized in the H-T-phase diagram for H⊥ in figure 9(b). In the case of H||(T) (figure 9(a))
and
could only be analyzed up to 0.6 T. Nevertheless, for this low field region the H||(T) values of the characteristic temperatures, determined from the susceptibility data, nicely agree with the values from the resistivity measurements [14].
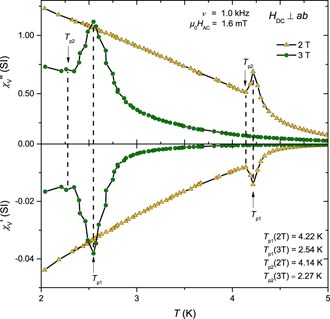
Figure 8. The temperature dependent AC-susceptibility (ν = 1 kHz; μ0HAC = 1.6 mT) (a)
 and (b)
 of NbSe2{CoCp2}0.26 in an applied DC-magnetic field of 2 T and 3 T perpendicular to the layers.
Download figure:
Standard image High-resolution image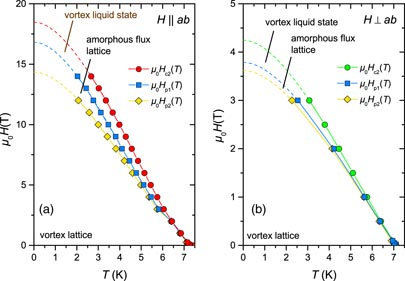
Figure 9. H-T-phase diagram of NbSe2{CoCp2}0.26 in an applied magnetic field (a) parallel and (b) perpendicular to the layers. The phase boundaries for the vortex-liquid phase and the amorphous vortex lattice phase are determined in the case of H|| ab from the resistivity measurements and for H⊥ ab from the AC-susceptibility data.
Download figure:
Standard image High-resolution imageThe phase diagrams in both directions (figures 9(a) and (b)) exhibit three different phases in the mixed state which broaden with increasing magnetic fields. Such behavior is also found in 2H-NbSe2 for H perpendicular to the layers [33, 45]. For the dilute vortex state in low magnetic fields, no phase separation up to 2 T for H|| and 0.5 T for H⊥ is observed. For the host sample a clear separation occurs in this region, which broadens with decreasing fields [46]. This different behavior in the dilute vortex region may be due to an unusual quantized flux penetration, as discussed in section 4.2.
In weakly pinned type-II superconductors, the vortex assemblage acts more or less as an elastic medium in a random pinning environment which can be activated thermally or driven by disorder. In both cases the shear forces between the single vortices get stronger than the pinning force. Intrinsic pinning centers are most likely in the large gaps between the superconducting layers; a scenario which is also discussed for HTC superconductors [47]. In the latter case, the mixed phase is not homogeneous but consists of different complex vortex phases [43]. In the simplest case the vortex lattice changes from a solid state, where the vortex array is fixed in an ordered Abrikosov- or in a slightly disordered Bragg phase, to an amorphous state (glass phase) and, finally, into a vortex liquid state, where the vortex flux motion is reversible. In comparison to the phase diagram of 2H-NbSe2, the region between the μ0Hc2 and μ0Hp1 borderlines is related to the liquid state, followed by an amorphous state between the μ0Hp1 and μ0Hp2 lines. Due to the complex nature of vortex phases, a vast number of detailed studies have been performed in the case of high Tc as well as low Tc superconductors, see, e.g. [10, 33, 48, 49]. To analyze the complicated vortex phase structure in NbSe2{CoCp2}0.26, further investigations are warranted which also consider the subtle pinning behavior of this type-II superconductor in greater detail, as well as the presence of large van der Waals gaps and intercalated guest molecules which might act as pinning centers.
5. Anisotropy and the specific heat
The unusual temperature dependence of the electronic specific heat ΔC, which is shown in figure 5(a) for the intercalated material NbSe2{CoCp2}0.26, is also evidenced by the parent compound 2H-NbSe2 and thus not controlled by the presence/absence of charge donation by the guest molecules. This feature has, however, raised an intense discussion on the role of the anisotropy of the material on ΔC(T) sequences. Kobayashi et al showed already in 1977 that the almost linear dependence of ΔC/T on T2 can be explained by the anisotropy of the layered 2H-NbSe2 [13]. They assumed an enhancement of the effective electron mass
 in the out-of-plane direction, as compared to the effective mass
 in the planes, as well as a reduction in the superconducting energy gap perpendicular to the plane as an origin of the peculiar ΔC(T) behavior. The discovery of a similar, almost linear T2-dependence of ΔC/T in the two-gap superconductor MgB2 [7], however, led to the supposition that in 2H-NbSe2 the presence of two energy gaps with unequal magnitudes might also be the essential prerequisite for this ΔC(T) feature. Huang et al tested this hypothesis by fitting the specific heat obtained through various anisotropic gap models to their experimental data and compared these results with fits relying on a two-gap model [29, 50]. These authors focused, however, mainly on the comparison of a two-gap model versus a superconducting (single) energy gap model with a six-fold symmetric in-plane anisotropy, which is supposed to reflect the symmetry of the crystal lattice. Their conclusion was that the two energy gap model performs better at describing the experimental data in the case of the selected benchmark systems.
Since our benchmark system allows a direct control of the sample's anisotropy factor via intercalation, we repeated the comparison of the performance of these different models to fit the C(T) data in low dimensional superconductors. Our approach follows the ansatz of Kobayashi et al [13] and assumes an enhanced effective mass
reflecting the system's anisotropy, whereas the gap function Δ is kept constant. The electronic specific heat of the superconducting state is given within the BCS theory [28] as:

where fk = 1/(1 + eEk/kBT) is the Fermi distribution function and
 is the quasi-particle energy. The temperature dependence of Δ(T) is derived from the self-consistency condition 1/V = ∫d2 k (1 − 2fk)/2Ek, where V is the pairing interaction strength. The value of V is chosen to give the measured critical temperature Tc. The lattice anisotropy enters through the kinetic energy
 , where k∥ is the in-plane momentum and k⊥ the out-of-plane momentum.
In order to find a model which reproduces the ΔC/T data best, it is important to notice that the ratio Δ(T = 0)/Tc has a fixed value within the BCS theory, which is ≈1.76 for an isotropic gap function Δ. Nevertheless, this ratio deviates somewhat from the BCS value in most superconductors, in particular, it is slightly enhanced in 2H-NbSe2. A consequence of this enhancement is an increased specific heat jump δC/γTc, for which the reported values vary somewhat (see table 1). The shape of the calculated curve ΔC/T depends strongly on the chosen value for the ratio Δ(T = 0)/Tc (see, e.g. [50]), wherefore this ratio is taken as a fitting parameter in [13, 29, 50]. In our measurements on NbSe2{CoCp2}0.26, we find that the ratio δC/γTc ≈ 1.43 is in perfect agreement with the BCS result (figure 10(a)). The non-intercalated 2H-NbSe2 (figure 10(b)), however, deviates from the BCS result with a ratio δC/γTc≈2.05.

Figure 10. Fits (the solid lines) to the experimental data (the circles and squares) for ΔC/T as a function of T2 for (a) the intercalated NbSe2{CoCp2} (data also shown in figures 5(a) and (b)) the parent compound 2H-NbSe2, respectively. In (a) the ratio Δ(T = 0)/Tc = 1.76 is fixed to the BCS value and an anistropy
 is used. In (b), the ratio Δ(T = 0)/Tc = 2.09 is adapted to reproduce the correct value for δC/γTc and an anisotropy ν = 0.6 is used (the solid green line). The dashed line shows ΔC/T for an isotropic system (ν = 1), where Δ(T = 0)/Tc = 1.99 is adapted to reproduce ΔC/T best below Tc.
Download figure:
Standard image High-resolution image
Because of the good agreement of NbSe2{CoCp2}0.26 with the BCS result, we chose as a model ansatz for ΔC the pure BCS model with one isotropic gap and only the one fitting parameter
 . Varying ν does not alter the ratio δC/γTc, but changes the curvature of ΔC/T, which makes this model especially suitable for reproducing our measured data. Figure 10(a) presents our data for NbSe2{CoCp2}0.26(a)) for μ0H = 10 mT (which is almost identical to μ0H = 0), and the calculated results (the solid red line) for ν = 0.08. While the low- and middle-temperature regime is remarkably well reproduced by our model, the measured ΔC/T is somewhat reduced close to Tc. This reduction, which is also reported in [51], is not captured in the BCS description but is likely caused by a regime of enhanced superconducting fluctuations around Tc, as can be expected in dimensionally reduced systems.
Figure 10(b) presents our measured results for the parent compound 2H-NbSe2 in a zero magnetic field. Because of the enhanced ratio ΔC/γTc, this result is only reproducible if δC/γTc is used as a fitting parameter as well. The solid green line shows the calculated result with anisotropy ν = 0.6 and Δ(T = 0)/Tc = 2.09. Within this model, the data shown in [13, 29, 30] are also well reproducible. Remarkably, ΔC/T is also ideally reproduced below Tc for an isotropic model (ν = 1) if Δ(T = 0)/Tc is adapted only for T < Tc, ignoring the height of the discontinuity in ΔC/T. This is illustrated by the dashed line in figure 10(b). This means that if one allows for the presence of an additional mechanism (which is not captured in equation (6)) influencing δC/γTc, then an isotropic single-gap model with an isotropic Fermi surface is sufficient to explain the ΔC/T data.
These observations allow the conclusion that both the intercalated and the non-intercalated material exhibit an
 /
anisotropy, but while the non-intercalated material harbors an essentially three-dimensional electronic state (ν = 0.6), the single NbSe2 layers are almost decoupled in the intercalated material (ν = 0.08). Nevertheless, both materials exhibit a three-dimensional superconducting state, although the anisotropy is increased through intercalation (see table 1). A possibly anisotropic gap, as well as the presence of a second gap, may still add to the characteristic, almost linear ΔC/T(T2) behavior of NbSe2. In view of the generally good agreement of our measurements with the predictions from the BCS theory and their reproducibility by a model ansatz using a single anisotropic Fermi surface, we believe, however, that the main effect on ΔC/T originates from the anisotropy in the effective masses
and
.
/
anisotropy, but while the non-intercalated material harbors an essentially three-dimensional electronic state (ν = 0.6), the single NbSe2 layers are almost decoupled in the intercalated material (ν = 0.08). Nevertheless, both materials exhibit a three-dimensional superconducting state, although the anisotropy is increased through intercalation (see table 1). A possibly anisotropic gap, as well as the presence of a second gap, may still add to the characteristic, almost linear ΔC/T(T2) behavior of NbSe2. In view of the generally good agreement of our measurements with the predictions from the BCS theory and their reproducibility by a model ansatz using a single anisotropic Fermi surface, we believe, however, that the main effect on ΔC/T originates from the anisotropy in the effective masses
and
.
6. Conclusion
The layered superconductor 2H-NbSe2 has been intercalated with the organometallic donor molecule cobaltocene to yield single-phase and crystalline NbSe2{CoCp2}0.26 samples. A small increase in the superconducting transition temperature
is observed upon intercalation, which represents the highest value of the intercalated or substituted 2H-NbSe2 species reported so far. Structural characterization confirms that the lattice spacing perpendicular to the superconducting layers increases significantly upon intercalation and is twice as large as for the host lattice. This expansion alters the superconducting properties within the layers only marginally, but has a strong influence on the nature of the superconductivity perpendicular to the NbSe2 layers. The virtually decoupled arrangement of the NbSe2 layers in the intercalate increases the anisotropy factor of Γ = Hc2||/Hc2⊥ = 4.4 by 34% relative to native 2H-NbSe2. This observation is paralleled by an increase in the upper critical field μ0Hc2|| = 18.5 T versus the parent compound 2H-NbSe2 (14.1 T). The fact that Γ calculated from the ξ ratio differs strongly from the corresponding values derived from the λ- and κ-ratio provides another hint that the anisotropic GL theory fails to describe the incidence of superconductivity in NbSe2{CoCp2}0.26. In addition, NbSe2{CoCp2}0.26, as well as 2H-SnSe2, exhibits a reentrant peak effect in the magnetic fields parallel and perpendicular to the layers. This observation suggests the presence of complex vortex phases in the mixed state as a second contribution to the superconducting scenario.
Although the intercalated dichalcogenide NbSe2 {CoCp2}0.26 exhibits a strongly enhanced anisotropy, surprisingly we found that the ratio δC/γTc = 1.43 is in good agreement with the prediction from the BCS theory. Based on the ΔC/T data fits, the superconducting scenario in both dichalcogenides, NbSe2{CoCp2}0.26 and the parent compound 2H-NbSe2, can be described by a one-gap BCS model with an anisotropic Fermi surface in contrast to earlier findings in the literature, which favored a two-gap scenario.
Acknowledgments
This work was supported by the Deutsche Forschungsgemeinschaft (project number SCHE487/12-1 and TRR 80).