
Abstract
Attosecond science offers formidable tools for the investigation of electronic processes at the heart of important physical processes in atomic, molecular and solid-state physics. In the last 15 years impressive advances have been obtained from both the experimental and theoretical points of view. Attosecond pulses, in the form of isolated pulses or of trains of pulses, are now routinely available in various laboratories. In this review recent advances in attosecond science are reported and important applications are discussed. After a brief presentation of various techniques that can be employed for the generation and diagnosis of sub-femtosecond pulses, various applications are reported in atomic, molecular and condensed-matter physics.
Export citation and abstract BibTeX RIS

Original content from this work may be used under the terms of the Creative Commons Attribution 3.0 licence. Any further distribution of this work must maintain attribution to the author(s) and the title of the work, journal citation and DOI.
1. Introduction
In the past decade attosecond science allowed us to approach various physical processes by using novel experimental and theoretical schemes [1–3]. It has revitalized the field of atomic physics: in this context, particularly interesting is the investigation of electron correlation effects and the observation of characteristic temporal delays in the photoemission from different atomic orbitals [4]. In the field of molecular physics the role of purely electronic effects in molecules, first addressed theoretically [5, 6], is currently a very active research field, where attosecond science can play a crucial role [7]. Solid-state physics offers a broad class of processes, which unfold on an ultrafast time scale, ranging from a few femtoseconds down to a few tens of attoseconds.
In this review we will investigate the role of attosecond technology in atomic, molecular and condensed-matter physics. This will be done by presenting a number of important and recent applications of attosecond pulses. In many cases the experimental results have triggered an intense theoretical activity. Indeed, to mention only a few examples, the measurement of the delay in photoemission from different atomic orbitals [8] or from different states in a solid [9] has led to important advances in the theoretical understanding of the various physical mechanisms at the basis of a crucial step of light–matter interaction: the emission of an electron after the absorption of light [10]. The investigation of ultrafast electronic motion in complex molecules is another example, where the attosecond experimental results have triggered the development of new theoretical strategies, able to investigate extremely complicated electronic dynamics [11]. The direct experimental observation of electronic processes in molecules in the few-femtosecond or sub-femtosecond temporal domain can be considered as a crucial benchmark for the proposed theoretical models.
A very challenging aspect of a large number of attosecond investigations is the presence of many degrees of freedom, with complex and generally unknown interconnections. For example, electronic and nuclear degrees of freedom in molecules are strongly coupled. Many-electron effects are crucial for a correct description of temporal dynamics in atoms, molecules and solids. A complete investigation of electron correlation, which is due to the interaction among electrons in a multi-electron system, is of crucial importance in various non-equilibrium processes [12]. Many-electron effects are at the heart of core-hole screening in solids, particle–hole and collective excitation [10]. As will be pointed out in this review, various attosecond methodologies have been developed in the last 15 years to investigate multi-electron systems characterized by various degrees of freedom. Both isolated attosecond pulses and trains of attosecond pulses have been employed, using different experimental approaches, which will be outlined in this work.
This review paper is organized as follows: section 2 discusses recent advances and prospects in attosecond technology. Schemes for the generation of attosecond pulses will be reported. In particular, various developments of high-order harmonic sources will be discussed, including multi-color high-order harmonic generation (HHG), spatial gating schemes and the generation of extreme-ultraviolet (XUV) radiation with circular polarization. Techniques for the characterization of attosecond pulses will be briefly described in section 3, starting from the first experimental method employed for attosecond metrology, the reconstruction of attosecond beating by interference of two-photon transitions (RABBITT), since this method has been also used in recent years for many important applications, which will be discussed in this review. After a brief discussion of the well known and used attosecond streaking technique, recently introduced in situ measurements will be reported. Section 4 offers an overview of applications of attosecond pulses in different research areas: delay in photoemission, correlated electrons, ultrafast molecular dynamics, charge migration in biologically relevant molecules and solid-state physics. Attosecond measurements without the use of attosecond pulses will be presented in section 5.
2. Recent advances in attosecond technology
The generation of attosecond pulses relies on the HHG process. High-order harmonics are generated when an intense laser pulse is focused on a gas medium: due to the strong non-linear interaction, very high odd harmonics of the driving pulse optical frequency can be generated [13]. This strong non-linear interaction leads to the production of a train of light bursts in the XUV spectral region with attosecond duration [14]. Since the first experiments, a very strong effort has been devoted to the development of reliable sources of attosecond pulses for time-resolved experiments. In the attosecond pulse train generated by HHG the pulses are separated by half of the period of the driving electric field. For many applications, such as pump–probe experiments, it is important to isolate a single pulse of the train, which can then be synchronized with another optical pulse. This corresponds to isolating a single emission event for each driving pulse in the HHG process. A few different schemes have been demonstrated for gating the HHG process in order to achieve the generation of isolated attosecond pulses. Figure 1 shows a sketch of the operating principles of such gating schemes. The selection of a single emission event can be achieved by amplitude gating (figure 1(a)) or by temporal gating (figure 1(b)). In the amplitude gating approach the harmonic emission is spectrally filtered. The attosecond pulse generated by the most intense half cycle of the driving pulse, which corresponds to the cutoff portion of the spectrum, is selected in this way [15]. In the case of temporal gating the HHG is confined to a single emission event by changing some property of the driving electric field in time, in principle without limitation in the bandwidth of the XUV pulse. In the following we will consider the different schemes for temporal gating that have been demonstrated up to now. It is worth noting that HHG gating schemes require a reproducible shape of the driving electric field, thus stabilization of the carrier-envelope phase (CEP) is required.

Figure 1. Sketch of the operating principle of gating schemes for the generation of isolated attosecond pulses. The upper panel of the figure represents the electric field of the driving pulse. The lower panel shows the corresponding ionization times for each cycle of the driving pulse. The isolation of a single emission event can be performed either by spectrally filtering the highest energies of the harmonic spectrum (a) or by temporally gating the recombination process (b).
Download figure:
Standard image High-resolution image2.1. Temporal gating schemes
The most common temporal gating techniques, which have been experimentally demonstrated for the generation of isolated attosecond pulses are the polarization gating, the double optical gating and the ionization gating techniques.
In the polarization gating (PG) approach, the polarization of the driving pulse is manipulated in order to confine the harmonic emission to a single event, as originally proposed by Corkum et al in 1994 [16]. Harmonic emission strongly depends on the polarization of the driving pulse: in the classical recollision picture, the electron is brought back to the parent ion and gives rise to the recombination step only if the polarization of the driving field is linear. As the ellipticity of the driving pulse is increased, the XUV emission is increasingly suppressed; for instance, the efficiency of HHG recombination can be reduced by a factor of 2 if the ellipticity of the driving pulse is 13%. In this framework, an isolated attosecond pulse can be generated if the polarization of the driving pulse is manipulated in such a way that the leading and trailing edges of the pulse are elliptically polarized, while the central portion of the pulse is linearly polarized. Figure 2(a) shows a simple optical scheme required for the implementation of PG, as proposed by Tcherbakoff et al [17]. This approach was demonstrated experimentally for the first time in 2006: isolated attosecond pulses as short as 130 as in the spectral range 25–50 eV and with an energy of 70 pJ have been generated and characterized [18, 19].

Figure 2. Sketch of the optical setup for polarization gating (a) and for double optical gating (b), adapted from [20].
Download figure:
Standard image High-resolution imageIn the PG approach, the gate window in which the polarization of the driving pulse is linear should be shorter than the separation between two consecutive XUV emission events. Thus, in order to efficiently generate isolated attosecond pulses by PG, the driving pulse should be very short: if T0 is the period of the driving field, the pulse duration should be shorter than 2.5 T0. This value corresponds to less than 7 fs for 800 nm driving pulses. To relax this requirement on the pulse duration, the symmetry of the driving field can be modified by adding a second color. In the double-optical-gating (DOG) approach, the second harmonic of the driving field is added to the fundamental driving pulse with an appropriate phase and energy, thus changing the periodicity of HHG from T0/2 to T0 [21]. Another advantage of this technique is the increase in the generation efficiency related to the lower depletion of the target medium on the leading edge of the driving pulse. Since for the same driving pulse duration the amplitude of the gate can be increased by a factor of two and the ionization probability has a strong non-linear dependence on the driving field intensity, the DOG technique allows the use of higher laser intensities with respect to PG. The optical scheme for the DOG method is depicted in figure 2(b). In 2009 Mashiko and co-workers reported the measurement of XUV supercontinua generated by 8 fs, 800 nm driving pulses by means of the DOG technique [22]. In that experiment, XUV bursts with a bandwidth of 200 eV FWHM were generated with the intensity of the driving pulse in the gate corresponding to 1.4 × 10¹⁶ W cm−2.
To allow the use of even longer driving pulses and to minimize the effects of ground state depletion, other temporal gating schemes have been introduced. In the generalized DOG (GDOG), the ellipticity of the leading and trailing edges of the driving pulse  is decreased with respect to standard DOG. Since the gate width is proportional to , the use of elliptical polarization ( ≃ 0.5) instead of almost circular polarization ( ≃ 1) allowed the generation of isolated XUV pulses with 148 as duration with 28 fs driving pulses at 800 nm [23]. A comparison between the field components in DOG and GDOG is reported in figure 3.
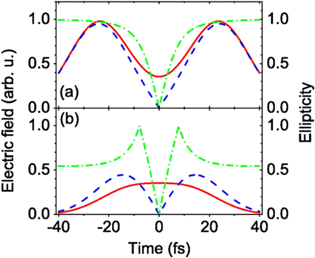
Figure 3. Comparison of the laser field components in DOG (a) and GDOG (b). The driving field is plotted as a solid line, the gating field is plotted as a dashed line and the ellipticity is plotted as a dash–dotted line. Reproduced with permission from [23].
Download figure:
Standard image High-resolution imageIn the interferometric PG, a combination of four electric field components with elliptical polarization and suitable amplitude, relative phase and delay has been used for the generation of XUV supercontinua supporting 260 as pulses and driven by a 55 fs 800 nm pulse with a peak power of 2 TW in loose focusing geometry [24]. This approach is very interesting because of the high XUV photon flux it can provide: 20 nJ in the 30–70 eV spectral region and 10 nJ in the cutoff region have been reported [25].
Another possible approach for the temporal confinement of harmonic emission exploits driving pulses with above saturation intensity. In the ionization gating (IG) approach, complete depletion of the generating neutral medium is achieved within the leading edge of the driving pulse. This gating method is based on the transient phase matching induced by the strong field: the leading edge of the driving pulse ionizes the generating medium and creates a dense plasma; the phase mismatch between the generating pulse and the XUV pulse suppresses the harmonic generation process before the complete depletion of the generating medium [26]. Experimental evidence of the temporal confinement of HHG due to transient phase matching is reported in [27–29]. This mechanism is capable of confining the XUV emission on the leading edge of the driving pulse, but the gating is not narrow enough for the selection of a single emission event, thus it should be complemented with additional bandpass filtering.
More recently, another gating mechanism based on the single-atom sub-cycle ionization response has been demonstrated: the sub-cycle ionization gating (SIG). In this approach linearly polarized few-cycle pulses with peak intensity above the ionization saturation intensity of the generating medium drive the HHG process, and the temporal confinement is due to the fast ionization dynamics occurring at the single-atom level [30]. With this technique, isolated attosecond pulses with a pulse duration of 155 as and a pulse energy on target of 2.1 nJ were generated in xenon, corresponding to an overall conversion efficiency of approximately 5 × 10⁻⁶ [31].
2.2. Generation of attosecond pulses by using mid-infrared driving pulses
Up to now, most of the experiments for the generation and exploitation of isolated attosecond pulses have been performed with Ti:sapphire lasers, thus with a driving wavelength of 800 nm. The recent developments in the realization of intense and tunable ultrafast sources operating in the mid-infrared spectral region with CEP stability [32] added a further dimension to strong-field experiments, with considerable benefits for the understanding of several phenomena and for the development of high-photon-energy coherent sources [33].
Indeed, the cutoff energy of the harmonic spectra scales as  , where Ip is the ionization potential of the generating medium, Up ∝ Iλ2 is the ponderomotive energy of the freed electron in the driving field, I is the laser peak intensity and λ is the central wavelength of the driving laser pulse. In this framework, mid-IR driving sources represent a very promising route for the generation of broadband attosecond pulses with high photon energy, since for the same peak intensity I they allow a considerable extension of the HHG spectrum towards the soft X-rays with respect to standard 800 nm laser sources [34]. Since the pioneering work by Shan and Chang more than ten years ago, many groups have developed mid-IR sources for HHG and strong-field experiments. High-energy optical parametric amplifiers (OPAs) have been successfully exploited to drive HHG and generate broadband XUV spectra [35–38]. Fiber-based IR ultrafast lasers with repetition rates of the order of megahertz have been successfully exploited for HHG [39], and also ultrafast sources based on a coherent combination of pulses at 800 nm and 2 μm, by optical parametric chirped pulse amplification (OPCPA), have been realized with the aim of controlling HHG and strong-field phenomena with attosecond precision [40]. Unfortunately, the favorable spectral extension in HHG driven by mid-IR laser sources is balanced by the unfavorable scaling of the HHG yield with the driving wavelength. The spatial spreading of the electron wave packet increases with longer driving wavelength since the flight time of the electron in the continuum is larger, thus leading to a smaller recombination probability and lower XUV emission. A careful experimental investigation demonstrated that HHG yield at constant laser intensity scales as λ−6.3±1.1 in xenon and λ−6.5±1.1 in krypton over the wavelength range of 800–1850 nm [41]. Another feature of HHG that depends on the driving wavelength and is important for the generation of attosecond pulses is the attochirp. The attochirp is the dispersion of XUV photon energies with time along the temporal duration of a single XUV burst. The different flight times of the electron trajectories correspond to different kinetic energies. The attochirp is predicted to scale as λ−1 with the driving wavelength, thus decreasing with increased driving wavelength [36]. This behavior, that has been confirmed experimentally between 0.8 and 2 μm [42], means that shorter attosecond pulses can be generated by mid-IR sources with respect to standard Ti:sapphire lasers.
A considerable step forward to overcome the unfavorable scaling law of harmonic yield with driving wavelength has been reported recently [43]. Popmintchev and co-workers generated bright XUV supercontinua, as shown in figure 4, with photon energies ranging from the extreme ultraviolet up to 1.6 keV, in principle allowing the generation of XUV pulses as short as 2.5 as. This result was obtained by focusing 3.9 μm wavelength pulses into a hollow-core fiber filled with He gas at very high pressure. The capability of this driving source to generate isolated attosecond pulses in the kiloelectronvolt spectral region has been discussed in [44].

Figure 4. HHG spectra measured as a function of driving-laser wavelength. In the inset, the Fourier-transform-limited pulse duration of 2.5 as is shown. Adapted with permission from [43].
Download figure:
Standard image High-resolution imageThe temporal gating techniques previously described for the generation of isolated attosecond pulses can be implemented with mid-IR driving pulses, thus extending the above mentioned approaches to the kiloelectronvolt spectral range. Recently, isolated attosecond pulses at the carbon K-shell edge (248 eV) have been reported with a pulse duration of 400 as and a spectral bandwidth supporting 30 as [45] by a spatio-temporal gating technique.
2.3. Two-color gating
Another method for the generation of isolated attosecond pulses consists in the manipulation of electron trajectories, based on the superposition of electric fields with multiple color components. As originally proposed by Merdji and co-workers [46], the combination of a laser pulse with its spectrally detuned second harmonic restricts the HHG to a single half cycle of the driving pulse. Following this approach the generation of XUV continua with photon energies exceeding 150 eV has been achieved [38]. In that experiment two synchronized laser pulses at 1500 nm and 800 nm respectively were combined with parallel polarization. The 1500 nm component produced by a tunable passively CEP stabilized OPA was the HHG driving pulse while the 800 nm component was acting as a weak perturbation. The limit of this approach is the low conversion efficiency associated with the mid-IR OPA. In order to overcome this limitation, another two-color approach has been investigated [47, 48], in which an intense few-cycle 800 nm pulse was combined with a mid-IR component: with this configuration, intense XUV continua extending beyond 200 eV have been obtained [49].
In figure 5 are shown the harmonic spectra generated in neon by a two-color field (solid curve) and by a 800 nm pulse alone (dashed curve). This comparison clearly shows how the two-color driving pulse enhances the harmonic yield and at the same time increases the cutoff energy. The same approach has been exploited for the generation of intense continuous XUV spectra driven by a multi-cycle two-color laser field (800 nm 30 fs pulse mixed with 1300 nm 40 fs pulse) [50].
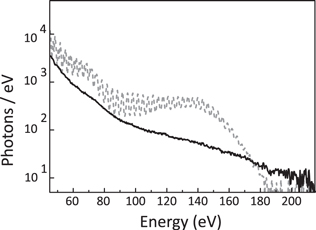
Figure 5. HHG in neon by 800 nm driving pulses (dashed curve) and by two-color field (solid curve). Adapted from [49].
Download figure:
Standard image High-resolution imageAnother two-color approach for the generation of isolated attosecond pulses has been theoretically investigated in [51] and experimentally demonstrated in [52]. In this experiment, two mid-IR laser pulses with incommensurate wavelengths (1350 nm 35 fs and 1750 nm 32 fs) were combined in two different polarization configurations—parallel and perpendicular—for tailoring of the electron trajectories in HHG. The major advantage of this configuration is the capability to gate the harmonic emission driven by longer pulses with respect to other schemes, owing to the larger temporal separation between the gating windows [51]. When the two driving field components were mixed with parallel polarization, XUV continua were generated in different target gases as a function of the delay τ between the two driving field components. In particular for τ = 0 a noticeable extension of the harmonic spectrum up to 160 eV and a considerable enhancement of harmonic yield together with the appearance of a continuous spectrum was observed. The second configuration reported in [52] (two color components with perpendicular polarization) is a variation of the PG since the confinement of harmonic emission is achieved through the manipulation of the ellipticity of the driving field. Also in this case for a delay τ = 0 between the two color components a half-cycle gate window is achieved where the polarization of the total driving field is linear. This second configuration corresponds however to a lower harmonic conversion efficiency, due to the lower instantaneous intensity of the driving field with respect to the parallel polarization configuration.
More recently, Takahashi et al demonstrated the possibility to engineer the configuration for HHG driven by a two-color field and they were able to generate isolated attosecond pulses with 500 as pulse duration and 1.3 μJ energy at approximately 30 eV, corresponding to a conversion efficiency of 1 × 10⁻⁴ [53]. In this experiment harmonics were generated in xenon, with a 12 cm long medium and careful optimization of phase-matching conditions. The characterization of the attosecond pulse has been performed by second-order autocorrelation in nitrogen.
2.4. Multi-color HHG
As already pointed out, the maximum photon energy in the HHG process is related to the maximum kinetic energy of the recolliding electron [13]. As discussed in section 2.3, the use of two-color driving pulses offers a way to extend the harmonic emission to high photon energies while still maintaining a good conversion efficiency. An effective method which can be employed to overcome the cutoff law is based on the use of cycle-shaped driving waveforms, as suggested in the theoretical work on the perfect wave for HHG [54]. As discussed in this work, the perfect wave form leading to the generation of recolliding electrons with the maximum kinetic energy for any oscillation period, T, of the driving field consists of a linear ramp with a dc offset [55]

where F is the period fluence of the driving field. The ionization instant is tI = 0 and the recollision instant is tR = T. In this case the maximum kinetic energy of the recolliding electron is about three times larger than in the case of a perfectly sinusoidal electric field. This can be understood considering the dynamics of the freed electron during its motion in the continuum after ionization. The main physical processes during this time interval are the following: (i) acceleration of the electron; (ii) deceleration and inversion of the direction of motion when the electron velocity vanishes; (iii) acceleration of the electron back to the parent ion. The kinetic energy of the recolliding electron is acquired during the last step. Therefore, the best use of the energy of the driving electric field is achieved when the amount of driving energy used during the first two steps of the electronic motion is minimized, in order to maximize the energy transferred to the electron during its return towards the parent ion. The waveform given by equation (1) perfectly matches these requirements.
The main differences between the behavior of the perfect wave with respect to a sinusoidal waveform can be understood from figure 6, which shows the electric fields of the two waves with the corresponding excursion distance from the parent ion. In the case of a sinusoidal field (figure 6(b)) in the temporal window between the instant when the electron changes its propagation direction and the recollision instant, the driving electric field decreases from its maximum value to almost zero amplitude. In contrast, in the case of the perfect wave the field energy is concentrated close to the recollision instant, thus maximizing the energy transferred to the electron.

Figure 6. Red solid lines represent the driving electric field of (a) the perfect wave and (b) a sinusoidal wave with a period of 1.54 T, so that the duration of the highest energy trajectory is T. The green dashed lines represent the highest-energy electron trajectories. Adapted from [54].
Download figure:
Standard image High-resolution imageFrom the experimental point of view it is important to understand how it is possible to generate a waveform similar to the perfect wave. The experimental strategy is the use of a multi-color driving field in order to achieve a sub-cycle waveform control. The simplest case is the use of a two-color driving field, as already discussed in section 2.3. Of course, in this case the possibility to shape in the proper way the driving electric field is rather limited. The use of three-color drive fields is the subsequent step and offers more flexibility, despite the increased complexity of the experimental apparatus. Wei et al [56] reported on selective enhancement of a single harmonic by using a driving laser field with sub-cycle waveform control, synthesized with the fundamental 800 nm laser and two controlling pulses at the second and third harmonics with perpendicular polarizations. More recently, Haessler and co-workers [57] reported on the use of driving pulses with shaped optical cycles, synthesized from three discrete bands covering 1.6 octaves. In this work three color components with the same polarization were coherently combined: λ1 = 1030 nm from a 1 kHz Yb-based femtosecond laser amplifier with stable CEP, its second harmonic at λ2 = 515 nm and the signal wave at λ3 = 1545 nm from an OPA pumped by the 1030 nm laser. Upon using the general guidelines at the basis of the perfect wave approach for HHG [54], it was possible to generate a driving field able to enhance by at least two orders of magnitude the generated XUV photon flux and to increase the harmonic spectral extension. The use of advanced sub-cycle shaping techniques promises to offer a powerful control for various applications in attosecond technology and, more generally, for several important laser-field-driven processes.
2.5. Synthesized light transients
The coherent combination, or synthesis, of various pulses is a very powerful approach for the generation of ultrashort pulses. In this section we will concentrate on a single application of this technique, namely the generation of light transients with duration down to a few hundred attoseconds obtained by using a sophisticated light-field synthesizer. A comprehensive review of recent advances in the field can be found in [58]. Recently, isolated attosecond pulses have been obtained by using a very sophisticated light-field synthesizer [59, 60]. A coherent supercontinuum has been first generated by propagating 25 fs pulses at a wavelength of 780 nm in a 1.1m long hollow-core fiber filled with neon gas at a pressure of about 3–4 bar. As a result of the propagation inside the hollow fiber the pulse spectrum is broadened from about 260 nm to about 1100 nm. Optical shaping of individual spectral components of the generated supercontinuum requires first their spatial separation and their subsequent recombination. The beam at the output of the hollow fiber was divided into three beams by dichroic beam-splitters, characterized by broad spectral bandwidths in three different spectral regions: 350–500 nm, 500–700 nm and 700–1100 nm. The pulses in the three arms of the interferometer were subsequently compressed individually by multiple bounces on pairs of chirped mirrors, designed for the respective wavelength range, so that the pulses in the individual channels are compressed close to their bandwidth-limited durations. Since each set of chirped mirrors has to be used over a relatively narrow bandwidth (less than half an octave), their design is quite relaxed. Moreover, a pair of thin fused-silica wedges is inserted in each channel to finely tune the dispersion and the CEP of the pulses in the different channels. The three pulses are then spatially and temporally superimposed in order to generate a single ultrabroadband pulse. The synthesis of light fields obtained by coherent superposition of various pulses requires a precise temporal and spatial overlap among the different pulses. Wavefront matching is required at any point along the propagation axis. Moreover, the optical path length in each arm of the field synthesizer must be perfectly stable. For this reason the experimental setup has been stabilized both passively and actively. The multi-arm interferometer has been realized as a quasi-monolithic setup; thermal stabilization was obtained by water flow through the volume of the baseplate. Moreover, an active stabilization scheme was additionally implemented.
Upon adding a fourth arm in the pulse synthesizer for the spectral portion between 260 and 350 nm, pulses as short as 415 as have been measured by using the attosecond streaking technique [61].
2.6. Attosecond lighthouse
Another promising technique for the generation of isolated attosecond pulses is the attosecond lighthouse method. This technique, introduced in 2012 by Vincenti and Quéré [62], is based on the use of the spatio-temporal coupling occurring in ultrashort pulses, i.e. the dependence of the spatial properties of a pulse on its temporal profile and vice versa. These effects are usually considered detrimental because they limit the maximum intensity that can be achieved at the focus; in particular pulse-front tilt is a spatio-temporal effect that can affect ultrashort pulses delivered by amplified laser systems as the result of a small misalignment of the dispersive element in a grating or prism compressor. However, pulse-front tilt can be used to produced isolated attosecond pulses. Ultrashort pulses with negligible pulse-front tilt are usually employed for HHG, in order to maximize the intensity in the interaction point. In this condition a train of attosecond pulses propagating in the same direction is generated. The interference in the far field of these pulses determines the harmonic structure observed in the spectral domain. On the other hand, for ultrashort pulses presenting a non-negligible pulse-front tilt, each attosecond pulse in the train is emitted in a slightly different direction corresponding to the instantaneous direction of propagation of the driving field at the instant of generation (perpendicular to the instantaneous wavefront of the driving laser). Therefore in the far field it is possible to separate consecutive attosecond pulses if the wavefront rotation within one half cycle of the driving laser field is larger than the divergence of the individual attosecond pulses. This condition limits the maximum pulse duration and the minimum wavefront rotation that can be used for generation of isolated attosecond pulses. As isolated attosecond pulses are emitted in different directions, the effect is called the attosecond lighthouse.
The first experimental demonstration of this generation scheme has been obtained in XUV harmonics generated from a plasma mirror [63]. In the experiment, 7 fs pulses at 800 nm central wavelength and with stable CEP were focused onto a moving fused-silica optical glass target at peak intensities just below 1 × 10¹⁸ W cm−2. The group-delay dispersion of the driving pulses was adjusted by using a pair of glass prisms placed in the beam path before a focusing parabola. Wavefront rotation at the focal point was controlled by rotating one of these prisms. The driving pulse ionizes the surface atoms, thus generating a plasma mirror, which reflects the fundamental beam. EUV radiation, in the form of an attosecond pulse train, is generated in the direction of the reflected laser beam through the process of coherent wake emission [64]. It was observed that, upon increasing the pulse-front tilt, the XUV beam splits into well separated beams, characteristic of the lighthouse effect, and the spectrum at the center of the XUV beam evolves from a strongly modulated harmonic-like spectrum to an almost continuous spectrum, as shown in figure 7. In the temporal domain, this corresponds to the generation of a group of isolated attosecond pulses spatially distributed into individual sub-beams produced by the attosecond lighthouse process. Moreover, when the CEP of the driving pulse is changed, the position of the individual XUV beamlets on the detector shift linearly, with a periodicity of 2π for the CEP.
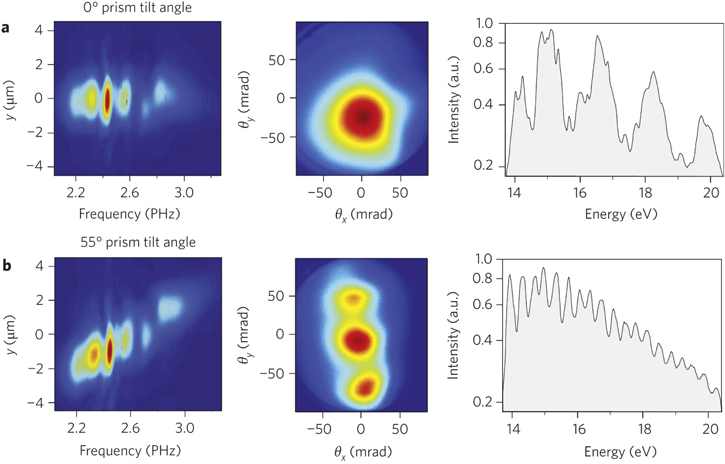
Figure 7. First column: XUV spectra resolved spatially measured for two values of the wavefront rotation of the driving radiation, obtained by rotating a glass prism. Second column: measured spatial profile of the XUV beam for a particular value of the CEP of the fundamental pulse. Third column: spectra of the XUV radiation measured at the center of the beam profile. Adapted from [63].
Download figure:
Standard image High-resolution imageThe lighthouse effect has also been demonstrated experimentally in harmonics generated in gases [65]. As in the previous case, the wavefront tilt was obtained by rotating a wedge used to optimize the compression of the driving pulses. XUV radiation was generated in neon. Upon rotating the wedge from θ = 0° to 20°, the generated XUV beam splits into various spatially separated beamlets, as in the case of a plasma mirror. In the experiment four beamlets are obtained, separated by about 2.2 mrad (which is roughly equal to the divergence of the single XUV beam generated with θ = 0°), each with a weak spectral modulation. Numerical simulations showed that each beamlet consists of an isolated attosecond pulse.
2.7. Generation of circularly polarized XUV pulses
The generation of XUV pulses with circular or elliptical polarization by using table-top sources is currently a hot research topic, due to the important applications of these pulses. Circularly polarized XUV radiation is extensively used for the analysis of the structural, electronic and magnetic properties of matter employing various experimental techniques: e.g. photoelectron circular dichroism for the investigation of chiral molecules [66], angle-resolved photoemission spectroscopy (ARPES) with circularly polarized XUV pulses [67] and X-ray magnetic circular dichroism (XMCD) spectroscopy for the study of magnetic materials [68], to cite only a few applications. Synchrotron radiation is typically used for these applications. Table-top sources of pulses in the XUV with circular polarization and ultrashort duration (from tens of femtoseconds to hundreds of attoseconds) would produce an enormous boost for the investigation of ultrafast processes involved in chirality-sensitive light–matter interactions.
Various techniques have been proposed and implemented for the generation of high-order harmonics with circular polarization. The direct use of driving pulses with circular polarization is not allowed, since the harmonic conversion efficiency exponentially decreases upon increasing the ellipticity of the fundamental pulse [69]. We recall that the ellipticity is defined as the ratio of the two axes of the polarization ellipse, so = 0 corresponds to linear polarization and = 1 corresponds to circular polarization. Elliptically polarized harmonics, with relatively small ellipticity ( < 0.37), have been generated by using elliptically polarized driving pulses [70]. The drawback was the strong decrease of harmonic conversion efficiency with increasing ellipticity of the driving radiation. A different experimental approach is based on harmonic generation in aligned molecules driven by linearly polarized pulses [71]. It was demonstrated that harmonics generated in N2 molecules aligned at 60° with respect to the polarization direction of the driving field present an ellipticity up to about 0.35 around the 21st harmonic. The disadvantage of the method is that it requires the use of aligned molecules and does not allow the generation of XUV pulses with high ellipticity. Circularly polarized harmonics have been generated by using linearly polarized driving pulses by implementing a circular polarizer in reflection, based on four mirrors coated with 35 nm of molybdenum and a 5 nm layer of B4C to prevent oxidation [72]. Harmonics with almost perfect circular polarization were obtained in the spectral range between 18.1 and 26.3 nm, with an efficiency between 2.6 and 4.4%. The main disadvantages of this method are the high losses and the limitation in spectral bandwidth imposed by the available multilayer mirror materials.
A very interesting method for the generation of circularly polarized harmonics was proposed in 1995 [73] and experimentally tested the same year [74]. In this case harmonics were generated by two circularly polarized, counter-rotating fields at the fundamental and second-harmonic wavelengths. In the pioneering experiment of Eichmann and co-workers the polarization state of the harmonics was not measured but the correct selection rules for the generation of circularly polarized harmonics were observed. The same technique was employed, with impressive results, in 2014 by Fleischer et al [75], who reported on a full control over the polarization of the harmonics, from circular through elliptical to linear polarization, without deterioration of the harmonic conversion efficiency. By employing phase matching in a gas-filled waveguide, bright circularly polarized harmonics were generated with this technique by Kfir and co-workers [76]. Let us consider two circularly polarized counter-rotating fields at ω and 2ω; the generated harmonic frequencies are given by the following expression (energy conservation):

where n1 and n2 are integer numbers giving the number of photons at ω and 2ω involved in the harmonic generation process. For parity conservation n1 + n2 is odd. On the basis of the experiments we can assume that [75]

where  is the spin angular momentum (SAM) expectation values (in units of ℏ) of the emitted high-order harmonic photon and σ1 and σ2 are the SAM expectation values of the fundamental and second-harmonic photons. Equation (3) corresponds to SAM conservation. σ can vary between −1 (right circular polarization) and 1 (left circular polarization); therefore, assuming σ1 = 1 and σ2 = −1, from equation (2) it is evident that n1 and n2 must differ by 1: n1 = n2 ± 1. The generated harmonic frequencies are thus given by

Therefore the harmonic orders 3m cannot be generated. The suppression of the 3m harmonics is very clear experimental evidence that the harmonic polarization is perfectly circular. In the pioneering work of Eichmann et al, the intensity of the 3m harmonics was low but not zero, thus indicating a deviation from pure circular polarization of the harmonic emission. The harmonic spectra reported in [75, 76] show an almost complete suppression of the 3m harmonics (see figure 8), thus indicating an almost perfect circular polarization. The total driving electric field given by the combination of the counter-rotating bichromatic field is characterized by a threefold rosette shape, as shown in figure 9. The driving field thus presents a rotation dynamical symmetry, with a polarization rotation of 120° every T/3, where T is the optical cycle of the fundamental radiation. The emitted harmonic field presents the same dynamical symmetry, giving rise to circularly polarized harmonics, where the harmonic orders q = 3m − 1 rotate right and q = 3m + 1 rotate left. It was observed that phase matching of circularly polarized harmonics is helicity selective: harmonics with left-circular polarization are characterized by a longer coherence length than the harmonics with right-circular polarization [76]. The very important advantage of this method is that, under proper phase-matching conditions, the photon flux of the circularly polarized harmonics is comparable to that of linearly polarized high-harmonic sources [76]. We note that this technique leads to the generation of trains of linearly polarized attosecond pulses with alternating polarization direction [77]. Recently bright circularly polarized harmonics with photon energies exceeding 160 eV have been used in X-ray magnetic circular dichroism measurements [78].

Figure 8. High-order harmonic spectrum generated in neon at a gas pressure of 650 torr by two circularly polarized, counter-rotating fields at the fundamental and second-harmonic wavelengths. Adapted from [76].
Download figure:
Standard image High-resolution image
Figure 9. Total electric field (violet curve on the right) with a threefold rosette shape, given by the combination of a left-circularly polarized fundamental field (red curve on the left) and a right-circularly polarized second-harmonic field (blue curve in the center).
Download figure:
Standard image High-resolution imageAnother method for the generation of circularly polarized XUV pulses has been recently demonstrated by Ferré et al [77]. In this case the scheme is based on resonant harmonic generation with elliptical laser fields. Numerical simulations demonstrate the crucial role of resonances both below the ionization threshold Ip and in the continuum. Indeed, by taking advantage of resonances below Ip the harmonic q = 5 of 404 nm driving pulses with ellipticity = 0.4, generated in argon, was characterized by an ellipticity = 0.75, significantly larger than that of the driving field. This harmonic is centered at 15.3 eV, which is just below the ionization threshold of argon (15.76 eV). The harmonics above Ip present an ellipticity slightly smaller than that of the driving pulse. Upon using SF6 for harmonic generation, a strong increase of the ellipticity of the harmonics above Ip (15.7 eV) was observed, related to the presence of resonances in the continuum, in particular a shape resonance in the A ionization channel, associated with the first excited state of the cation [79]. In this case 800 nm pulses were used to generate harmonics in SF6: ellipticities between 0.6 and 0.8 were obtained for a fundamental ellipticity = 0.2, in the spectral range between the 13th and the 17th harmonics (20–27 eV). A secondary maximum around 45 eV, with ∼ 0.4, was measured and associated with resonances in the A/B channel at 35 eV and 49 eV [79].
3. Techniques for the characterization of attosecond pulses
The application of attosecond pulses to the investigation of ultrafast processes in matter requires the development of attosecond metrology. The RABBITT technique was the first method proposed and implemented for the temporal characterization of trains of attosecond pulses [80]. Immediately after the first demonstration of the generation and characterization of trains of attosecond pulses, isolated attosecond pulses were obtained and measured by employing the attosecond streaking technique [81, 82]. The streak-camera approach, in combination with the frequency resolved optical gating for complete reconstruction of attosecond bursts (FROG CRAB) procedure [83], is now routinely used to obtain a complete temporal characterization of the streaking IR field and to measure the temporal intensity envelope and spectral phase of the attosecond pulse. Another technique implemented for the measurement of ultrabroadband attosecond pulses is the so-called phase retrieval by omega oscillation filtering (PROOF) method [84], which has been used to characterize the shortest attosecond pulse generated so far. All these techniques are based on the measurement of the spectrum of the photoelectrons generated by the attosecond pulses in a gas medium, in the presence of an IR pulse, as a function of the temporal delay between the XUV and IR pulses.
A different scheme for attosecond metrology is based on the implementation of all-optical methods, which are based on the measurement of the spectrum of the XUV radiation. These optical schemes are based on in situ measurements, where the production and the measurement of attosecond XUV pulses are entangled and offer various advantages with respect to the techniques based on the measurement of photoelectrons, namely a very high detection efficiency and a high signal-to-noise ratio. Recently an in situ technique for the measurement of the full space-time structure of the attosecond pulses in the generation medium has been demonstrated [85].
Complete characterization of the electric field of an attosecond pulse also requires the measurement of the corresponding carrier-envelope phase (CEP), and it has not yet been demonstrated. A few theoretical works [86, 87] indicate new directions for the observation of CEP-dependent effects produced by attosecond pulses, which can be used for complete reconstruction of electric fields in the XUV spectral range. In the following sections, various measurement techniques will be reviewed, namely the RABBITT approach, the streak-camera approach and an all-optical method for the measurement of the space-time structure of the attosecond pulses.
3.1. The RABBITT technique
This method is based on the measurement of the spectra of the photoelectrons emitted by a gas excited by a train of attosecond pulses in the presence of a weak infrared field, as a function of the temporal delay between the XUV and IR pulses. The photoelectron spectra present discrete peaks, which correspond to transitions induced by single-photon absorption of XUV harmonics, separated by 2ℏω, where ω is the frequency of the driving IR pulse. When the XUV and IR pulses are temporally overlapped, one or more IR photons can be absorbed or emitted, thus giving rise to additional peaks in the photoelectron spectra at  with respect to the peaks generated by the XUV harmonics. In the case of weak IR intensities, only one IR photon can be absorbed or emitted, so each harmonic has only a single sideband on each side. In this case, only two consecutive harmonics contribute to each sideband, whose amplitude is periodically modulated as

where τ is the temporal delay between the XUV and IR pulses, Δϕq is the phase difference between consecutive harmonics, Δϕq = ϕq+1 − ϕq−1, and Δϕatom is the intrinsic phase of the matrix elements for above-threshold, two-photon ionization involved in the generation of the sideband. From equation (5) it is clear that, upon changing the delay between the two pulses, the sideband amplitude oscillates at twice the frequency of the IR field. Since Δϕatom can be calculated, the phase difference between consecutive harmonics can be measured.
The RABBITT technique was first demonstrated in 2001 by Paul et al, with the measurement of the relative phases of five consecutive harmonics generated in argon, corresponding to the production of a train of 250 as pulses, spaced by 1.35 fs [80]. Immediately after this first experiment, the RABBITT method was employed for the measurement of the harmonic intrinsic chirp (the so-called attochirp) on a broad spectral range [88]. RABBITT has been also used for the measurement of the relative photoemission time delays between valence electrons in various noble gas atoms (Ar, Ne and He), as will be discussed in section 4.1. More recently, the RABBITT technique has been extended to the investigation of energy-dependent photoemission delays from metal surfaces [89], and it promises to offer important advantages, in particular for the investigation of sub-femtosecond electronic processes in condensed-matter systems due to the very low intensity of the IR field, which allows a notable reduction of the perturbation of the sample under investigation.
3.2. Streaking measurements
As in the case of RABBITT, the attosecond streaking approach is based on the combined use of an attosecond pulse with a delayed near-infrared (NIR) pulse. The first implementation of the streak-camera method led to the first measurement of isolated attosecond pulses by Hentschel et al in 2001 [81]. The XUV pulse generates a replica in the form of an electron pulse by single-photon absorption in a gas. The electric field of the streaking pulse acts as an ultrafast phase modulator and modulates the kinetic energy spectra of the photoelectrons as a function of the temporal delay between the XUV and IR pulses. As first suggested by Mairesse and Quéré [83], the spectrogram, F(v, τ), measured upon scanning the XUV–IR delay, τ, can be interpreted as a FROG trace, containing all the information about the intensity envelope and spectral phase of the attosecond pulses. Indeed, the measured photoelectron spectrum can be written as

where EX is the the electric field of the attosecond pulse; d(v) is the dipole transition matrix element from the ground state to the continuum state; AL(t) is the vector potential of the driving laser field, v2/2 is the final kinetic energy of the photoelectron (in atomic units); Ip is the atom ionization potential and ΦG(v, t) is the quantum phase acquired by the electron due to its interaction with the laser field. It is evident that the main effect of the streaking field is to induce a temporal phase modulation, ΦG(v, t), on the electron wave packet generated in the continuum by the XUV field,  . In this sense, the streaking electric field can be seen as an ultrafast phase modulator. F(v, τ) is the FROG CRAB trace that can be measured experimentally and is formally equivalent to a FROG spectrogram

where G(t) is the gate function (amplitude or phase gate). In equation (6), by assuming the central momentum approximation, we can replace ΦG(v, t) with ΦG(v0, t), where v0 = ωX − Ip is the central momentum of the photoelectron. In order to retrieve the temporal phase and intensity profile of the attosecond pulse it is possible to use various iterative algorithms, such as the principal component generalized projection algorithm (PCGPA) [90].
In the first experiment reported by Hentschel et al isolated attosecond pulses were produced by spectrally selecting the cutoff region of the harmonic spectrum generated in neon by 7 fs driving pulses [81]. The first experimental measurement of isolated attosecond pulses based on the use of the FROG CRAB technique was reported in 2006 [19]. The streaking measurement can be also used to obtain a complete temporal characterization of the streaking femtosecond electric field, as first demonstrated by Goulielmakis et al [91].
Another technique based on the measurement of photoelectrons generated by an attosecond pulse under the perturbation of an IR electric field is the phase retrieval by omega oscillation filtering (PROOF) method, which is particularly suitable for the characterization of ultrabroadband attosecond pulses [84]. As in RABBITT, the IR field is assumed to be weak, so that its action on the photoelectron spectra can be treated using the lowest-order perturbation theory. It is possible to show that the photoelectron spectrum, I(ν, τ), can be written as the sum of three components: I(ν, τ) = I0(ν) + Iω(ν, τ) + I2ω(ν, τ), where τ is the delay between the XUV and IR pulses. I0(ν) represents a term which does not depend on delay, while Iω(ν, τ) and I2ω(ν, τ) are two terms oscillating in time with frequency ω and 2ω, respectively, where ω is the angular frequency of the IR field. From the term oscillating at the IR frequency ω, it is possible to extract the phase of the attosecond pulse. Both RABBITT and PROOF techniques rely on the use of a weak dressing IR field, since they are both based on the assumption that only paths involving a single IR photon contribute to the signal. Upon increasing the IR intensity, this assumption becomes invalid and systematic error can be introduced in the reconstruction of the attosecond field. PROOF was used in 2012 for the measurement of 67 as isolated pulses produced by the DOG technique [92].
Neither FROG CRAB nor PROOF provides access to the CEP of the attosecond pulses. Recently it was proposed, but has not yet been experimentally demonstrated, that information about the CEP of isolated attosecond pulses can be achieved by applying the attosecond streak-camera method using a CEP-stable IR pulse with an intensity higher than the one typically used for the temporal characterization of attosecond waveforms [86]. In the typical FROG CRAB configuration the streaking intensity is reduced in order to have a negligible contribution from the photoelectron released only by the streaking field through above threshold ionization (ATI), or at least to separate the ATI contribution from the streaking photoelectron spectrum. Upon increasing the IR intensity (as shown in figure 10), the amplitude of the energy modulation of the photoelectron spectra increases and a complex structure appears when the photoelectron spectra is shifted towards lower kinetic energies, which strongly depends on the relative delay. It has been demonstrated that this modulation is sensitive to the CEP of the attosecond pulse.

Figure 10. Calculated spectra of photoelectrons generated in argon by isolated attosecond pulses (duration τXUV = 250 as, central photon energy of 36 eV, CEP ϕXUV = 0°, intensity IXUV = 1012 Wcm−2) in the presence of 5 fs infrared pulses (central photon energy of 1.63 eV, CEP ϕIR = 0°) with intensities (a) IXUV = 1012 Wcm−2 and (b) IIR = 2 × 10¹³ Wcm−2. The vertical dashed white lines correspond to the XUV–IR temporal delay τ = 0. Adapted from [86].
Download figure:
Standard image High-resolution image3.3. In situ measurements
Various all-optical methods, based on the measurement of the photon spectrum, have been proposed and partly implemented to reconstruct the phase of attosecond pulse trains [93–96]. In particular, the combined use of a two-color driving field composed by the fundamental wavelength and its (weak) second harmonic is a very powerful experimental technique. This technique has been implemented in pioneering experiments by Dudovich et al [95] for the measurement of the emission time of high-order harmonics in an attosecond pulse train. Due to the symmetry breaking of the total driving field induced by the use of the two-color driving field, even harmonics of the fundamental frequency are generated. By changing the delay between the two fields, their relative phase is varied, inducing a modulation in the intensity of the even harmonic signal. By measuring this oscillation as a function of the delay, the relative phase of the odd harmonics can be characterized and the attosecond pulse train can be reconstructed.
This approach, originally applied to trains of attosecond pulses, has been recently extended to the characterization of isolated attosecond pulses [85], generated by using the polarization gating technique. A weak second-harmonic beam is directed in the gas jet used for XUV generation at a small angle θp with respect to the fundamental beam. The perturbing signal field weakly changes the attosecond pulse generation process, since the electron trajectories leading to the XUV generation are slightly modified. A perturbation of the wavefront of the XUV radiation is produced, resulting in a variation of the propagation angle, θ, and of the divergence of the XUV beam. Upon measuring the far-field spatial profile of the XUV radiation,  , for the XUV photon energy
  as a function of the propagation angle θ and of the temporal delay, τ, between the fundamental driving pulse and the perturbing second-harmonic pulse, it is possible to obtain a complete space-time characterization of the attosecond pulses in the generation medium and, therefore, at any point in space. In this case the perturbing second-harmonic beam acts as a spatial gate. Indeed, in the case when the XUV radiation is generated only by the short quantum path contribution, the spatial distribution of the XUV beam can be written as [85]

where  is the complex amplitude of the XUV radiation generated by the short quantum paths, at the photon energy
  , without the perturbing field in the near field, i.e. in the generation medium; y is the vertical coordinate.
  is the gate function, which describes the amplitude and phase modulation induced by the perturbing field;
  is the wavenumber of the XUV beam and c is the speed of light. Expression (8) is the same equation as used in the case of a FROG measurement, reported in equation (7). In this case the phase retrieval algorithm can uniquely reconstruct the functions
  and
and  . It has been demonstrated that the phase retrieval algorithm can be successfully applied even when both short and long quantum paths contribute to the XUV pulse generation.
By using the same experimental procedure it is also possible to retrieve the electric field of the perturbing pulse, as demonstrated by Kim et al [97]. In this case the laser beam is divided into two portions. The first beam is used to generate isolated attosecond pulses by polarization gating. The second beam, Es, is the pulse to be measured. The angularly resolved XUV spectrum is measured as a function of the delay, τ, between the two pulses. Then, the angular distribution of the XUV spectrum around a particular energy is plotted versus τ: the center of mass of the obtained angular distribution corresponds to the derivative of the electric field, dEs(t)/dt. This experimental technique, called a petahertz optical oscilloscope, represents a powerful alternative to attosecond streaking for complete reconstruction of optical fields, and it is based on the measurement of XUV spectra.
4. Fundamental issues addressed by attosecond science
We will now review a few important applications of attosecond pulses to atomic, molecular and solid-state physics. In particular we will discuss the following subjects: (i) measurement of temporal delays in photoemission from atoms and solids; (ii) investigation of electron correlation processes in multi-electron systems; (iii) a brief report on the main applications of attosecond pulses to the measurement of ultrafast molecular dynamics; (iv) first experimental evidence of charge migration in biologically relevant molecules; (v) applications of attosecond pulses to solid-state physics.
4.1. Delay in photoemission
The interaction of an XUV pulse with an atom or a solid can lead to electron emission from valence, inner-valence, and core levels or bands, depending on the photon energy and on the electronic structure of the system. In a pioneering experiment, Schultze et al investigated the photoelectron spectrum emitted in neon by an isolated attosecond pulse centered around 100 eV [8]. As shown in figure 11(A), the spectrum is composed by two electron wave packets corresponding to photoionization from the 2p and 2s shells. The photoionization process occurs in the presence of an intense few-cycle IR field, which gives an additional momentum shift to the emitted electron depending on the ionization instant. The analysis of the spectrogram as a function of the relative delay between the XUV and IR pulses evidences a small (but still measurable) time shift between the oscillation of the two electronic wave packets. In order to extract quantitative information, an optimized version of the FROG algorithm was used for the reconstruction of the spectrogram [98]. The result is shown in figure 11(B). The algorithm provides information on the amplitude and phase of the photoelectron wave packets, as shown in figure 11(C), which reports the reconstructed photoelectron spectra emitted from the 2s and 2p levels and the relative group delays (black solid line and red dotted line, respectively). The quality of the reconstruction is confirmed by the good agreement between the reconstructed and measured photoelectron wave packets (gray dashed line) (figure 11(C)) also for the delays corresponding to the largest positive and negative shifts of the electron energy distribution (figure 11(D)). The reconstruction evidences a delay of about 20 as between the emission of photoelectrons from the 2p shell with respect to the 2s level, with the 2s being emitted first. This work has triggered a large interest in the attosecond community not only in the physical origin of the observed delay, but, more generally, in the information that similar measurements can deliver on the electronic structure of the system, for instance the influence of electronic correlation, and on the electronic dynamics during the photoionization process.

Figure 11. (A) Photoelectron distributions emitted from the 2s and 2p levels in neon as a function of the relative delay between the isolated attosecond pulse and the intense IR streaking field. (B) Reconstructed spectrogram using an optimized version of the FROG algorithm. (C) Intensity of the photoelectron wave packets, measured (gray dashed line) and reconstructed (solid line); group delay of the wave packet (red line) retrieved from the algorithm. (D) Reconstructed (solid lines) and measured (dashed lines) streaked photoelectron spectra for the two delays shown in (C). Reproduced with permission from [8].
Download figure:
Standard image High-resolution imageIt is important to observe that in attosecond streaking both the isolated XUV pulse and the IR streaking field contribute to the observed delay and their contributions have to be disentangled in order to develop a simple physical picture. The time delay retrieved in a streaking measurement, tS, can be expressed as [10]

where  is the Eisenbud–Wigner–Smith (EWS) delay (often referred to as Wigner delay) [99–101] in the presence of the long-range Coulomb potential and tCLC is the Coulomb–laser coupling time shift. The first term represents the additional time required by the outgoing wave packet to escape the ionic potential with respect to a free propagating wave packet. In terms of the outgoing wave packet the EWS delay is given by the energy derivative of the phase of the transition matrix element between the initial (bound) and the final state (continuum). As such the photoionization process can be regarded as a half-scattering process. An additional correction has to be introduced because of the infinite range of the Coulomb potential. The second term tCLC takes into account the interaction of the IR field with the outgoing electronic wave packet in the long-range Coulomb potential. This term does not depend on the laser intensity and on the duration and shape of the IR streaking pulse [10] and it can be determined by numerical streaking calculations. This information, combined with an experimental measurement of the streaking delay tS, gives access to tEWS, offering insight into the formation of the electronic wave packet after the interaction with the XUV pulse. A detailed discussion of the interpretation and analysis of the terms contributing to the observed time delays is presented elsewhere [4, 10].
Time delays in photoionization have also been investigated using the RABBITT technique combining an attosecond pulse train with a weak IR field. In this case the timing information is encoded in the phase of the sideband oscillations due to the two-photon transition. Using this approach Klünder et al investigated photoionization from the 3s and 3p shells of argon in the photon energy range between 32 and 42 eV [102]. Also in RABBITT, the measured delay can be decomposed into a time delay due to the absorption of the XUV photon  and a time shift due to the action of the IR field on the photoelectron wave packet in the infinite range of the Coulomb potential. In the context of sideband oscillations the latter is usually referred to as the continuum–continuum delay τcc. In the experiment a clear dependence of the observed time delay as a function of the sideband was observed, indicating that the emission of the photoelectron wave packet from the 3s shell precedes that from the 3p shell by a few tens of attoseconds [102]. In this energy region, however, electronic correlation is expected to play an important role. Indeed the presence of a Cooper minimum in the 3s photoionization cross-section is a direct result of intershell electronic correlation. Guénot et al have considered the influence of this effect on the delay estimation by calculating the phases of the single-photon ionization amplitudes using the random-phase approximation with exchange (RPAE), which explicitly takes into account the correlation effects between different shells [103]. Correlation effects have also been discussed in connection with the discrepancy affecting the experimentally measured values and the theoretical results in the delay in photoemission of the neon experiment described above [8]. In particular, Feist et al have indicated that the excitation of unresolved shake-up satellites could lead to an error in the determination of the streaking time shifts [104]. It is therefore clear that more advanced models for the description of electron correlation are mandatory to improve the agreement between experimental results and theoretical predictions of time delays in multi-electron atoms.
Delays in photoemission were also observed in solids using attosecond streaking. Cavalieri et al measured a delay of about 100 as in the emission of photoelectrons from the 4f core shell and the conduction band of single-crystal tungsten [9]. The same approach was later applied to single-crystalline magnesium, showing that the emission from core-level (2p) and the valence-band states occurs simultaneously (within the experimental error bar of 20 as) [105]. The interpretation of attosecond time delays on the surface offers the opportunity to investigate the properties of the electronic response and electronic transport during photoionization. Indeed, the time delay can be influenced by the band structure of the material and by the spatial properties of the initial state wave function. Moreover, the photoionization process from a core level offers insight into the formation of the Bloch wave packet, its propagation up to the surface–vacuum interface, and in electron–electron scattering [10]. An important point for the interpretation of attosecond time delay on surfaces is the 'exact' time instant when the photoelectron wave packet starts to experience the external IR field. This time is related to the screening properties of the surface and to the penetration depth of the IR field in the first atomic layers. Neppl et al have shown that at optical frequencies screening occurs within a few ångströms, confining the penetration of the IR field to a single atomic layer [106].
Locher et al [107] investigated the time delay emission on the surfaces of the noble metals Ag(111) and Au(111) using the RABBITT method. The photoelectrons ejected by the surface can absorb or emit additional IR photons creating sideband (SBs) of the main photoelectron line (see figure 12(a)). In the experiment the RABBITT technique was applied simultaneously in two different interaction regions. A TOF electron spectrometer was placed in the first one for the characterization of the photoelectron spectra emitted in argon. The diverging pulses were then focused using a toroidal mirror in a second interaction region, where a hemispherical electron analyzer measured the electron emitted by the metal surfaces. In noble gases, the RABBITT technique has already been widely investigated and served as a reference to strongly minimize experimental instabilities and systematic errors. The RABBITT trace measured in argon (ionization from the 3p shell) is shown in figure 12(b). In Ag (ionization from the 4d band) sidebands of the main photoelectron lines can be observed, as shown in figure 12(c). The intensity of the sidebands oscillates as a function of the relative delay between the two pulses. Figure 12(d) reports two photoelectron spectra corresponding to the delays (3) and (4) shown in figure 12(c). The information of the photoemission delays is contained in the spectral phases ϕ2qg,s (2q indicates the SB order), which can be obtained by the fit of the sideband oscillations as shown in figures 12(e) and (f) for the gas and surface spectrograms, respectively. As in the case of attosecond streaking on tungsten and magnesium, the measured delay in photoemission τ2qs comprises the Wigner delay due to the absorption of the XUV photon  , a delay due to the transport of the photoelectron wave packet to the surface
  , and, finally, a delay induced by the measurement due to the continuum–continuum coupling
  :
:

The simultaneous RABBITT measurement in argon offers information that can be used to express the measured time delay on the solid surface in terms of photoionization delays in the gas phase, according to the equation

The Wigner delay for photoemission from argon  and the continuum–continuum delay in the gas
  have already been discussed and measured [108, 109]. The term τprop derives from an additional phase term due to the reflection on the toroidal mirror which refocuses the pulses in the second interaction region and to the Gouy phase shift between the two interaction points. Finally, the delay τrefl is due to the fact that the photoelectron wave packet leaving the surface experiences an IR field that is the superposition of the one impinging on the interface and the totally reflected component. The combination leads to an additional phase term that can be calculated according to the Fresnel's equations. The measurement in Ag indicates a strong variation of the photoemission delay as a function of the observed sideband, while the measurement in Au presents much smaller variations. The theoretical description indicates that the observed delays cannot be interpreted only in terms of initial state localization and electronic transport, and that other effects (such as final state effects) might play an important role in the formation of delay.

Figure 12. (a) Schematic energy levels of the RABBITT technique, involving the absorption of one XUV photon (HH 17, 19, 21) and the absorption or emission of one IR photon with creation of sidebands (SB 16, 18, 20, 22). (b), (c) Photoelectron distributions as a function of the relative delay between the attosecond pulse train and the IR field in argon (b) and on Ag(111) (c). (d) Photoelectron spectra for the two different time delays (3) and (4) indicated in (c). (e), (f) Experimental data (points) for the integrated SB 18 signal and fit (solid line) for argon (e) and Ag (f). Reproduced with permission from [107].
Download figure:
Standard image High-resolution image4.2. Correlated electrons
Electron correlation, which is determined by the interaction among electrons in a multi-electron system, plays a fundamental role in a number of physical processes and characterizes several non-equilibrium processes. It is particularly important in the relaxation processes of excited states of atoms and molecules irradiated by XUV pulses. The dynamics of these states can lead to various phenomena such as Fano resonances and Auger decays in atoms or interatomic Coulombic decay or charge migration in molecules and clusters. Attosecond pulses are ideal tools for the time-resolved investigation of correlation effects [12]. While a complete characterization of the time-dependent correlated motion of two electrons could be obtained by using the attosecond-pump–attosecond-probe technique, only alternative techniques based on the combination of XUV and IR pulses have been used so far in order to gain insight in the correlated electronic motion.
The first investigation of electronic correlation on the few-femtosecond timescale was reported in krypton using a sub-femtosecond XUV pulse centered around 97 eV by Drescher et al [110]. At this photon energy, ionization can occur not only from the outermost levels (4s and 4p), but also from the 3d core shell. In the latter case, the excited ionic core relaxes through electronic correlation by Auger decay, which leads to the formation of a doubly charged ion and the ejection of a second electron. Time-integrated measurements give access to the linewidth of the Auger photoelectron line (Γ = 88 ± 4 meV) [111]. The time-resolved observation of the decay process was obtained by using synchronized few-cycle IR pulses. The interaction of the IR field with the photoelectron wave packets emitted from the 4s and 4p shells leads to a broadening of the photoelectron line, reflecting the fact that the emission in the continuum is only determined by the duration of the sub-femtosecond XUV pulse and occurs on the IR sub-cycle timescale. In contrast, the emission of the Auger wave packet in the continuum extends over several cycles of the IR field (due to the lifetime of the excited state). In these conditions the IR field determines the appearance of sidebands of the main Auger line. By measuring the delay dependence of the integrated sideband signal, a lifetime of  fs was estimated for the M(d5/2). This value corresponds to a linewidth of
  meV and is thus in good agreement with the spectroscopic measurement.
Attosecond spectroscopy presents a peculiar advantage with respect to time-integrated techniques as it allows us to observe and order in time sequential relaxation processes. This unique characteristic is at the basis of ion-charge-state chronoscopy, which consists in the measurement of charged ionic species as a function of the relative delay between the XUV excitation pulse and the IR probing field. If an intermediate ionic species of charge N (AN+) is formed as the result of photoionization or of an electronic relaxation process (for example Auger decay), the synchronized IR pulse can probe its formation and decay time by ejecting an additional electron, thus determining a variation in the yield of multiple charged ions. This technique was used by Uiberacker et al [112] to investigate relaxation processes in highly excited xenon atoms. Photoionization by a 90 eV attosecond pulse in xenon leads to the formation of Xe+ with a 4d vacancy, which can decay as either a single (A1) or a cascaded Auger process (A2) with the formation of Xe2+ or Xe3+, respectively. As shown in figure 13 the delay dependences of the two charged-ion species are characterized by different dynamics. In particular, a detailed analysis of the electronic levels in the ionic species and the ionization pathways opened by the IR field indicates that the exponential rise and decay of the Xe4+ are connected to the evolution of the A1 and A2 Auger steps, respectively. A fit of the experimental curves allows one to determine decay times of τA1 = 6.0 ± 0.7 fs and τA2 = 30.8 ± 1.4 fs for the two Auger processes. Using a similar approach the decay times of sequential and cascaded Auger decays in krypton were also retrieved [113].

Figure 13. Ion yields of Xe4+ (a) and Xe3+ (b) as a function of the delay between the isolated attosecond pulse and the few-cycle IR pulse. Reproduced with permission from [112].
Download figure:
Standard image High-resolution imageThe simplest system for the investigation of electronic correlation is helium. This system is of particular importance because it gives the possibility to compare experimental results with full ab initio numerical simulations. Recently attosecond transient absorption spectroscopy, based on the use of attosecond pulses with few-optical-cycle IR fields, has been employed for the measurement of the dynamics of the two bound and correlated electrons in helium atoms [114]. Helium presents a series of doubly excited states (sp2,n+) below the N = 2 ionization threshold. These states correspond to the excitation of a two-electron wave packet, which decays through electron–electron correlation by ejection of one electron and relaxation of the ion to a lower-energy configuration. The energy of the photoelectron emitted by this autoionization mechanism coincides with that of the photoelectron emitted by direct photoionization. The two ionization pathways are indistinguishable and interfere, leading to a characteristic shape in the XUV absorption profile usually referred to as the Fano shape [115]. In the experiment the manifold of autoionizing states was excited by a broadband attosecond pulse and the time evolution of the bound two-correlated-electron wave packet was characterized by using a synchronized IR pulse, which couples the two lowest-lying components (2s2p and sp2,3+) of the series. The quantum beat among these components is observed as a modulation of the absorption spectrum with a period of 1.2 fs. The beating gives access to the relative phase between the two autoionizing states as a function of time φ(t). The combination of this experimental observable with known time-independent real-space representations of the autoionizing states allows one to visualize the highly correlated electronic motion [114]. In the same experiment, it was also demonstrated that an intense IR pulse can be used not only to reconstruct the correlated electronic motion, but also to control it. Indeed the Fano line shapes of the autoionizing states are strongly modified for increasing intensities of the IR field. In the time domain, the change corresponds to an additional initial phase term in the complex wavefunction of the autoionizing states. The phase dependences of the 2s2p and sp2,3+ are opposite in sign, and the phase difference can be tuned through 2π. Because the time evolution of the correlated motion depends on the relative phase, full control of the two-state electronic wave packet can be achieved in this way.
4.3. Ultrafast molecular dynamics
Dynamical processes in molecules occur on an ultrafast temporal scale, ranging from picoseconds to femtoseconds when concerning a structural change, down to attoseconds when dealing with electrons. Attosecond technology provides the ideal tool to follow and ultimately control the photoinduced electron and nuclear dynamics in molecules. The most conventional scheme to perform a pump–probe experiment in the attosecond domain is based on the use of an XUV isolated attosecond pulse or an XUV attosecond pulse train (APT) synchronized with an NIR femtosecond pulse. This is usually combined with detection of charged photofragments (electrons or ions) by using different techniques. The first application of ion momentum imaging with isolated attosecond pulses was reported in 2010, with the measurement of the electron localization process in hydrogen after attosecond excitation [116]. Isolated attosecond pulses have been used to achieve control of electron localization in the process of dissociative ionization of D2 and H2 molecules, induced by a sequence of an isolated attosecond pulse and an intense few-cycle IR pulse. A localization of the electronic charge distribution in the molecule has been measured with attosecond temporal resolution, as a function of the pump–probe delay. Such electron localization is due to two physical mechanisms. A first mechanism, which is the dominant one during the temporal overlap between the attosecond pump and IR probe, is strictly related to the excitation of autoionizing states. The second localization process is based on the interaction of the dissociating molecule with the NIR pulse. Electron localization in D2 and H2 molecules has also been investigated with APTs: in this case a time-dependent polarization of the molecule under the influence of an intense NIR pulse has been observed [117]. This process has been assigned to the interference resulting from the NIR-induced coupling between the continua of two different electronic states, namely the 2Σg+ state and the  state.
Experiments performed in H2 have been precursors for further works conducted with multi-electron diatomic molecules. In 2011 the same technique was exploited to control the photoionization of O2 molecules on a sub-femtosecond time scale [118], while more recently short APTs in combination with 12 fs NIR pulses have been used to characterize the vibrational motion in the binding potentials of ionized O2 using coincidence detection of photoelectrons and photoions [119]. The XUV–NIR pump–probe approach has also been widely used to investigate the dissociative ionization dynamics of N2. Molecular nitrogen is indeed the most abundant species in the Earth's upper atmosphere and the investigation of the ultrafast dissociative mechanisms leading to the production of N atoms and N+ ions is of prime importance for understanding the radiative-transfer processes occurring in the planetary atmosphere. In the experiment performed by Lucchini and co-workers [120], APTs were used to photoionize N2 molecules and the subsequent dynamics was probed by 15 fs NIR pulses. By measuring the angular momentum distribution of the produced N+ fragments as a function of the pump–probe delay, it has been possible to precisely clock the time required by an autoionization process to become energetically favorable. Further investigation of the XUV-induced dissociative ionization of N2 molecules was conducted by using a time-compensating XUV monochromator [121]. In this experiment, by tuning the energy of the XUV pulses in the range between 30 eV and 50 eV it was possible to investigate the dependence of the fragmentation process on the photon energy. Moderately strong IR pulses at 800 nm have been used to probe the dissociation dynamics, demonstrating the involvement of highly excited neutral species over the whole range of XUV photon energies. Recently, isolated attosecond pulses with a photon energy in the range 16–50 eV and a pulse duration of 300 as were used to ionize N2 molecules and the subsequent dissociation dynamics was probed with 4 fs NIR probe pulses with a peak intensity of 8 × 10¹² W cm−2 [122]. The extremely high temporal resolution provided by this experimental approach in combination with a sophisticated theoretical model has allowed crucial information on the potential energy curves (PECs) involved in the dissociative process to be obtained. Figure 14 shows the measured (a) and the calculated (b) kinetic energy (KE) spectrum of the N+ ions measured as a function of the XUV-pump and NIR-probe delay. As can be observed in this figure, both experiment and theory reveal (i) a clear depletion of the KE region around 1 eV (F-band) occurring 8 fs after zero time delay and (ii) the appearance of a clear sub-cycle modulation of the ion yield, with a periodicity of 1.22 fs. The depletion of the F-band has been assigned to resonant single-photon transitions and the time required by the wave packet to reach the internuclear distance at which the first resonant transition occurs was measured. The sub-cycle oscillatory pattern, identified outside the time overlapping region between the XUV and the NIR pulses, was assigned to an interference mechanism between two dissociative paths. The time versus energy dependence of the interference pattern has been demonstrated to be dependent on the shape of the repulsive part of the PECs involved in the XUV photoionization step.

Figure 14. (a) Time-dependent N+ kinetic energy spectra acquired within the pump–probe delay interval 5–16 fs. (b) Time-dependent N+ kinetic energy spectra calculated by including 616 states of N2+ within the pump–probe delay interval 5–16 fs. Adapted from [122].
Download figure:
Standard image High-resolution image4.4. Charge migration in biologically relevant molecules
Observing the electron dynamics in molecules on attosecond timescales allows for a clarification of the role of electronic correlations in the molecular chemistry, thus potentially paving the way to the advent of a new field: attochemistry [11]. Sudden ionization of biologically relevant molecules by XUV pulses has been theoretically predicted to drive very efficient charge dynamics along the molecular structure. This charge flow, which has been referred to as charge migration, precedes any rearrangement of the nuclear skeleton and it can evolve on a temporal scale ranging from a few femtoseconds down to tens of attoseconds [5, 6]. The extension of attosecond science to the study of more complex molecules is technically challenging; however, a first step in this direction was taken in 2012 with a pioneering work on the aromatic amino acid phenylalanine, which revealed the presence of a dynamics on a temporal scale of a few tens of femtoseconds triggered by ionization induced by short APTs [123]. A subsequent experiment performed on the same molecule with a higher temporal resolution has allowed us to measure a pure electron dynamics occurring in the amino acid after XUV photoionization [7, 124]. In this experiment, charge migration was initiated by 300 as isolated attosecond pulses, with photon energy between 15 and 35 eV, and it was subsequently probed by 4 fs, waveform-controlled NIR pulses. A clean plume of neutral phenylalanine molecules was generated by evaporation from a thin metallic foil heated by a continuous wave (CW) laser. The metallic foil was integrated into the repeller electrode of a time-of-flight mass spectrometer (TOFMS) and the ions produced by the interaction of the molecules with the XUV-pump and NIR-probe pulses were then collected by the TOFMS for mass analysis. Charge migration was evidenced in phenylalanine as an oscillatory evolution in the yield of the doubly charged immonium ion, a fragment which results from the loss of the carboxylic group. This periodic modulation (figure 15(a)) occurs with a frequency of 0.24 PHz, corresponding to an oscillation period of 4.3 fs, shorter than the vibrational response of the molecule. Numerical simulations of the temporal evolution of the electronic wave packet created by the attosecond pulse indicated that charge migration is originated from the coherent superposition of a number of electronic states. Moreover, as shown in figure 15(b), the measured oscillations mainly correspond to a periodic charge density variation around the amine functional group of the molecule.
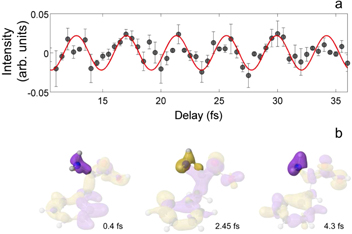
Figure 15. (a) Yield of doubly charged immonium ion versus pump–probe delay (dots) and sinusoidal fitting function (red solid curve). (b) Snapshots of the relative variation of the hole density with respect to its time-averaged value for the most abundant conformer of phenylalanine. Isosurfaces of the relative hole density are shown for cutoff values of 10−4 (yellow) and −10−4 (purple) arbitrary units. The location of the amine group is highlighted in the snapshots. Adapted from [7].
Download figure:
Standard image High-resolution imageCharge migration immediately following strong-field ionization (SFI) has been recently investigated by using high-order harmonic spectroscopy (HHS). Compared to photofragmentation spectroscopy, HHS (described in detail in section 5.2.1) allows for a reconstruction of both amplitudes and phases of the transiently occupied electronic states of the cation and determination of the initial shape of the hole created by the SFI process. This method requires alignment and orientation of the molecules under investigation; therefore, it can only be applied to linear and polar molecules. In the experiment performed by Kraus and co-workers, hole migration was initiated in spatially aligned and oriented iodoacetylene molecules by 800 nm or 1300 nm pulses in the ionization step of HHG [125]. The recombination step, which leads to the emission of the XUV spectrum, was then used to probe the temporal evolution of the hole density. Molecules aligned perpendicular to the laser field give rise to a quasi-field-free charge migration process, while for parallel alignment charge migration is controlled by the laser field and differs from the field-free evolution. Figure 16 shows the reconstructed quasi-field-free hole migration from the iodine side to the acetylene side of the molecule occurring in 930 as.

Figure 16. (a) Reconstructed electron dynamics for iodoacetylene molecules aligned perpendicular to the 800 nm driving field as a function of time after SFI. Adapted from [125].
Download figure:
Standard image High-resolution image4.5. Attosecond pulses for solid-state physics
Attosecond pulses can be used to investigate many-electron processes in the photoemission from solid surfaces such as core-hole screening [126, 127], particle–hole and collective plasmon excitation, etc. In this context, a recent application of the attosecond streaking technique has been reported, which allowed us to obtain important physical insights into the photoemission processes in solids [128]. The multi-step model of photoemission from solids [129] has been scrutinized and collective excitations in photoemission have been investigated with attosecond temporal accuracy and ångström-scale spatial resolution. In the multi-step picture, the absorption of an XUV photon leads to a transition from a core or valence level to a quasi-continuum state in the conduction band. The Bloch wave packet thus generated in the conduction band moves towards the surface. During this transport process the Bloch wave packet is subject to elastic and inelastic collisions, thus leading to particle–hole excitations. The final step is diffraction at the surface potential with eventual transmission into vacuum. Within this model a very interesting and highly debated topic is plasmon excitation and, in particular, the discrimination between intrinsic and extrinsic plasmon excitation. Intrinsic plasmon excitation is related to the first step in the photoemission process and it represents the solid-state analogy of shake-up in atomic photoionization. Extrinsic plasmon excitation is linked to the transport process in the multi-step model and it is produced by inelastic scattering of the primary photoelectron during its transport towards the surface. Due to the well defined temporal ordering and to the different length scales of the intrinsic and extrinsic mechanisms, which evolve on an attosecond time scale, the attosecond streaking approach has been proposed and tested as a powerful experimental technique able to disentangle the contributions from the two excitation mechanisms. Figure 17 shows the streaking traces corresponding to photoemission from a Mg(001) surface induced by isolated attosecond pulses with central energy of 118 eV. The main streaking trace, in the energy range from 65 to 72 eV, which corresponds to the photoemission from the 2p core level, is well separated by about 10.5 eV from the corresponding plasmon correlation satellite, generated by both intrinsic and extrinsic plasmon excitations. The plasmon satellite trace shows a delay Δτ = 60 ± 10 as with respect to the main 2p trace. A streaking delay is expected between extrinsic plasmon line and the main line, related to the transport process, which can be approximately calculated as the ratio between the inelastic mean free path, λinel, between two consecutive inelastic collisions and the electron velocity,  as. This transport-related delay is negligible for the intrinsic plasmon excitation, where a residual delay with respect to the main trace is related to the difference in intrinsic Eisenbud–Wigner–Smith (EWS) delay between the main line and the intrinsic plasmon satellite [130], which is expected to be smaller than Δτex. As demonstrated by Lemell and co-workers [128], upon measuring the temporal delay between the main streaking trace and the satellite trace, together with the corresponding energy spectra (in particular the intensity ratio between the direct and plasmon peaks), it is possible to obtain the relative ratio of intrinsic to extrinsic plasmon generation, α = 0.1 ± 0.05, and the inelastic mean free path near surface, λinel = 5.5 ± 0.5 Å. These results demonstrate the potential of attosecond techniques to achieve extreme temporal resolution in combination with sub-angstrom spatial precision.

Figure 17. (a) Measured streaking traces corresponding to photoemission from a Mg(001) surface induced by isolated attosecond pulses with central energy of 118 eV. (b) Relative shift of the streaking traces: the symbols are the experimental data, the lines are the best fitting curves. Adapted from [128].
Download figure:
Standard image High-resolution imageAnother very interesting application of attosecond methods to solid-state physics was reported in 2013, with the observation of an insulator-to-conductor transition in fused silica [131]. The possibility to control the conduction properties of a material by using optical pulses is extremely attractive from the technological point of view. In 2013 Schiffrin and co-workers [132] demonstrated that the ac conductivity of fused silica can be increased by more than 18 orders of magnitude within 1 fs, by using few-optical-cycle NIR pulses, with stable CEP and electric field amplitude approaching the critical value given by the following expression:

where  is the energy gap of the dielectric material (
 for fused silica); e is the electron charge and a is the lattice period (a ≈ 5 Å). If the above condition is satisfied, the NIR driving pulse is able to inject carriers from the valence to the conduction band of fused silica. The use of few-cycle pulses is essential to prevent damage of the dielectric exposed to electric fields of a few volts per ångström [133]. The electronic processes at the basis of the insulator-to-conductor transition (and vice versa) have been investigated by employing attosecond experimental methods [131], which are essential to probe the sub-femtosecond carrier dynamics involved in this process. A 4 fs NIR pump pulse, with a peak electric field amplitude E = 2.5 ± 0.5 V Å−1 and stabilized waveform, was used to determine a variation in the band structure of a 125 nm thick SiO2 membrane. An attosecond probe pulse (with central photon energy of 105 eV, pulse duration 72 as and polarization parallel to the polarization of the NIR pump pulse), focused with variable temporal delay on the sample, promoted electrons from the L-shell of silicon to the conduction band of SiO2. Figure 18(a) displays the measured modulation of the absorbance at 109 eV. Under the action of the NIR pulse, whose electric field, measured by attosecond streaking in a gas jet, is shown in figure 18(b), the sample transmission exhibits large oscillations at a frequency of 2ωL (where ωL is the NIR frequency) perfectly synchronized with the laser field. This measurement clearly demonstrated the complete and ultrafast reversibility of the field-induced changes of the optical properties of the dielectric sample up to the critical field strength. The ultrafast evolution of the transient optical density is a clear indication that such dynamics is dominated by instantaneous changes in the local density of the conduction band states and its virtual population [134]. This important result offers the potential for petahertz-bandwidth signal manipulation.

Figure 18. (a) Transient variation of the absorbance of a SiO2 membrane as a function of the pump–probe delay. Absorbance was integrated over a 1 eV bandwidth at 109 eV. (b) Electric field of the NIR pump pulse, measured by attosecond streaking. Adapted from [131].
Download figure:
Standard image High-resolution imageThe process of tunnel ionization, previously investigated in isolated atoms by using attosecond pulses, has been experimentally studied in solids (silicon) [135]. At excitation intensities larger than 1010 W cm−2, NIR pulses can excite electrons from the valence band to the conduction band, with multi-photon transitions across the direct band gap  . The temporal evolution of the electron population in the conduction band has been probed by isolated attosecond pulses, which excited electrons from 2p core orbitals of Si to the conduction band. The XUV radiation transmitted by a 250 nm thick single-crystalline free-standing Si membrane has then been measured as a function of the time delay between the NIR pump pulse and the XUV probe pulse. The temporal evolution of the transmission measured at about 100 eV is displayed in figure 19 and shows a step-like behavior synchronized with the half-cycle period of the NIR electric field. Each step presents a rise time of about 450 as, which gives an upper limit for the carrier–carrier scattering time. The observed evolution of the ionization process is in agreement with what is expected in the case of tunnel ionization. The experiment demonstrates that, at excitation intensities larger than about 1012 W cm−2, electron tunneling is the main ionization process in solids.

Figure 19. Transmission at 100.35 eV of a 250 nm thick silicon membrane excited by an intense few-cycle NIR pulse and probed by isolated attosecond pulses. Adapted from [135].
Download figure:
Standard image High-resolution imageUltrashort XUV pulses (<8 fs), obtained by monochromatizing a high-order harmonic spectrum, have been recently exploited to perform time- and angle-resolved photoemission spectroscopy (TR-ARPES) in graphene. Indeed, the dynamics of prethermal Dirac carriers in graphene occurs on a time scale which requires extreme time resolution. After photoexcitation of graphene using 800 nm pulses, an electron in the conduction band could recombine with a hole in the valence band (Auger heating) or the excess of energy of an electron high in the conduction band could generate a secondary electron–hole pair through inverse Auger scattering (impact ionization). Due to lack of holes at the top of the valence band of graphene, impact ionization is expected to dominate in the first few femtoseconds following the photoexcitation step. This prediction has been confirmed by the TR-ARPES measurements, in which a clear increase in the conduction band of carrier density accompanied by a reduction of the average kinetic energy has been observed in the first 25 fs after photoexcitation, indicating that impact ionization is the predominant scattering channel [136].
5. Attosecond measurements without attosecond light pulses
Various techniques have been proposed and partly implemented to achieve sub-femtosecond temporal resolution without the direct use of attosecond light pulses. In this section we will briefly review the main experimental results achieved so far.
5.1. Attoclock
Experimental information about the electron tunneling process can be obtained by employing the attoclock technique, which makes use of a close-to-circular polarized intense laser field in the two-cycle regime. The electric field deflects photoelectrons in the radial direction so that the instant of ionization is mapped to the final angle of the momentum vector in the polarization plane. Since the angle can be measured with an accuracy of Δθ ≈ 1°, the potential temporal resolution which could be achieved with accurate calibration of the experimental setup is Δτ = Δθ/ω ≈ 10 as (ω is the angular frequency of the driving electric field). The attoclock method has been employed to set an upper limit to the tunneling delay time during the tunnel ionization process in helium [137] and to measure the ionization times in double ionization of argon [138]. Using an attoclock setup with a cold target recoil ion momentum spectrometer (COLTRIMS) apparatus, Pfeiffer et al demonstrated in 2012 that the tunneling time for an electron ionized from noble gas atoms is vanishingly small within the experimental accuracy of 10 as [139]. Moreover they found that the freed electron presents an angular offset with respect to the expected output direction, which was ascribed to the interaction with the ionic potential during the angular streaking (see figure 20); this offset is independent of the laser intensity for helium atoms, whereas it shows a monotonic decrease for argon ones [139]. This difference has been explained in terms of multi-electron and Stark shift effects, which are much more important in argon owing to its larger polarizability. Though a COLTRIMS setup allows us to record coincidence measurements suitable for a complete reconstruction of the photoelectron distribution, recent advances in this field allowed the exploitation of velocity map imaging (VMI) spectrometers for attoclock measurements [140].

Figure 20. (a) Attoclock technique combined with COLTRIMS detection. An intense ultrashort laser pulse with circular polarization is focused in a gas jet. The resulting ions and electrons are detected in coincidence. (b) The green arrow shows the pulse propagation direction; the blue arrow represents the rotating electric field vector. The time evolution of the electric field is shown in orange. The electron trajectories with and without the interaction with the parent ion are respectively shown in red and black. Reproduced with permission from [139].
Download figure:
Standard image High-resolution imageThe high potential of the attoclock technique for novel studies in atomic and molecular physics has recently promoted several theoretical investigations aiming at a deep understanding of this technique in order to disclose all the involved physical effects [141, 142]. These studies confirmed the role of the Coulomb field of the ion in the attoclock results as well as the absence of a tunneling delay in single-electron systems; moreover it was found that attoclock measurements may distinguish among different kinds of multi-electron effect provided that a careful calibration of the outcomes is performed [142].
5.2. Probing atoms and molecules with recolliding electrons
The interaction of intense laser pulses with matter can be interpreted in terms of ionization and steering of the outermost electrons by the optical field; a fraction of these electrons recollide with the parent ion, acting as a probe that combines extreme temporal resolution and extreme spatial resolution, since the wavelength of a typical recollision electron matches the size of valence electron orbitals (∼1 Å). Several schemes have been proposed for the investigation of the atomic and molecular properties with sub-femtosecond resolution exploiting recollision electrons; we can group them into two different sets: (i) techniques based on the detection of photons emitted during the recollision and recombination processes; (ii) techniques based on the detection of electrons scattered during the recollision process.
5.2.1. Detection of photons: high-harmonic spectroscopy
The generation of high-order harmonics by interaction of atomic or molecular targets with intense laser pulses is well represented by the three-step model [13], which implies that the spectrum of the emitted radiation carries a wealth of information on both the ionization and the recollision processes as well as on the structure of the ionized target and on any temporal evolution of the hole left in the parent ion between ionization and recombination events. As mentioned in section 4.4, HHS can be exploited to study the nature of the target involved in the process. The natural temporal scale of HHG is in the attosecond domain, but harmonic generation is extremely sensitive to any change in the structure of the target molecule. Hence HHS has been also exploited for the study of much slower phenomena such as vibrational and rotational dynamics in molecules [143–146].
At first sight the three steps involved in HHG appear strongly entangled, thus hindering the extraction of specific information by HHS. However the nature of HHG itself provides the way to separate the three steps and acquire the required information. Figure 21 shows how ionization and recombination events are related to the emitted photon energy in HHG driven by a linearly polarized laser field. For a given photon energy two possible electron trajectories can be found; according to the flight time of the electron, they are called short and long trajectories. By an appropriate choice of the generation parameters and of the phase-matching conditions, only one of them can be selected (often the short one), hence a one-to-one correspondence can be established between electron flight time and emitted photon energy [147]. As long as one is only interested in the evolution of the atomic (molecular system) between electron ionization and recollision, this correspondence can be easily exploited for a time-resolved measurement by assigning the intensity of each harmonic peak to a different flight time. This was the case in experimental studies concerning for instance the proton rearrangement in methane upon ionization [148], the influence of nuclear motion on high-harmonic generation from hydrogen [149], the multi-electron dynamics during high-order harmonic generation in carbon dioxide [150] and the study of the chirality of some organic molecules on a sub-femtosecond time scale [151].

Figure 21. Description of electron trajectories contributing to the recollision process. Each color corresponds to a different kinetic energy at recollision. The dashed line shows the electric field for a laser wavelength of 800 nm. Reproduced with permission from [147].
Download figure:
Standard image High-resolution imageThe natural mapping between electron flight time and emitted photon energy may not be enough for more complex time-resolved studies. For instance one might be interested in determining the precise ionization and recollision times for different harmonic orders [147] or to impart different directions to the electron velocity at birth and recombination in order to probe the atomic (molecular) structure from different angles [152]. Such detailed studies require the introduction of additional degrees of freedom in HHG. A typical way to achieve this goal is to exploit another essential feature in HHG, namely the strong dependence of emission yield on the electron trajectory. The archetypal technique is the study of harmonics driven by elliptically polarized laser pulses: in the framework of the three-step model the maximum harmonic yield is obtained for linearly polarized laser pulses, since in this case the probability for a recollision between the ionized electron and the parent ion is maximized; a monotonic exponential decay of the harmonic signal is expected for increasing laser ellipticity. Any departure of the signal decay from this law carries meaningful information about the target or the emission process itself [144, 153, 154].
By combining the temporal dispersion of harmonic emission with the manipulation of the electron trajectories, one can determine independently the times of electron ionization and recombination as well as information about the target structure. An implementation of this idea is shown in figure 22: an intense laser pulse is combined with a weak, orthogonally polarized second-harmonic pulse. The pulses are synchronized and the relative phase offset between them can be finely controlled [147]. Since the overall driving field is no longer linearly polarized, ionized electrons flying in the continuum will be laterally displaced with respect to the parent ion; only a small set of electron trajectories will return to the ion, giving rise to harmonic emission at a specific photon energy as shown in figures 22(a) and (b). By changing the phase offset between the two laser fields, one finds a relationship between ionization times and emitted photon energies. An independent relationship between recombination times and photon energies is obtained by measuring the ratio between neighboring even and odd harmonics as a function of the phase offset. This ratio is maximized for those electrons that recombine with the parent ion at the maximum lateral velocity, that is with the largest incidence angle, as depicted in figures 22(c) and (d) [147]. By combining these two measurements, Shafir et al were able to confirm experimentally that the ionization and recombination times of electron trajectories involved in harmonic emission from a noble gas agree very well with the quantum stationary (saddle-point) solutions provided by the Lewenstein model [147]; moreover by applying this technique to HHG from carbon dioxide, they also observed peculiar features ascribed to the multi-electron nature of harmonic emission. Recently the technique was extended to probe the non-adiabatic character of field-induced electron tunneling by interpreting the emitted harmonic spectra in terms of tunneling interferometry on the attosecond temporal scale [155].

Figure 22. Manipulation of electron trajectories by a two-color laser field. The lateral shift in electron trajectory (a), (b) suppresses the recollision probability. Only a small set of trajectories giving rise to photon emission are selected in the ionization step (shaded red). By changing the two-color delay the gate is shifted in the ionization step. The selection of trajectories with maximum lateral velocity and angle at recombination (c), (d) is obtained by looking to the even-to-odd harmonic ratio (shaded red). By modifying the two-color delay, the gate is shifted in the recombination step. Reproduced with permission from [147].
Download figure:
Standard image High-resolution imageThe recollision electrons offer another opportunity for ultrafast investigation of atoms and molecules. Since high-order harmonic emission is produced by interference between the recolliding electron wave packet and the parent orbital, the measurement of the characteristics of the harmonic radiation allows one to obtain detailed information about the electronic structure of atoms and molecules through the amplitude and phase of the photorecombination matrix elements. This experimental approach was proven to be extremely sensitive to the structure of the outermost molecular orbital in complex molecules [156] as well as to multi-electron dynamics with the potential of attosecond temporal resolution [150, 157, 158]. Recollision electron imaging by HHG is at the basis of molecular tomography, first proposed and demonstrated in 2004, with the reconstruction of the highest occupied molecular orbital (HOMO) of N2 molecules [159]. This technique was later extended in order to include multi-electron effects [160]. In 2011 a self-referencing approach and a generalization of the tomographic procedure were introduced, which allowed the tomographic reconstruction of the electronic structure of a more complex molecule (CO2). The amplitude and phase of the harmonic field emitted by aligned molecules was determined as a function of their orientation with respect to the driving laser field [161]. From this result it was possible to reconstruct the outermost molecular orbital of carbon dioxide in fair agreement with the expected one (see figure 23). This technique was afterwards extended to other molecules such as N2O and acetylene [162]. Further efforts in developing tomographic techniques led in 2013 to the LAPIN approach, that combines interferometric HHG and exploitation of mixtures of the investigated species with a reference gas, demonstrating a complete determination of the emitted harmonic field in amplitude and phase and its exploitation for orbital imaging in bromine molecules [163].

Figure 23. Orbital tomography performed in CO2 exploiting HHG induced by by mid-IR ultrashort laser pulses. The molecules were aligned by a 800 nm laser pulse; the delay between aligning and generating pulses was scanned along the half rotational revival of carbon dioxide. (a) The temporal evolution of the alignment factor calculated in the experimental conditions. (b) The sequence of harmonic spectra as a function of the delay. (c) The tomographic reconstruction of the outermost molecular orbital of carbon dioxide, obtained from data shown in (b). Reproduced with permission from [161].
Download figure:
Standard image High-resolution image5.2.2. Detection of electrons: laser-induced electron diffraction and holography
Laser-induced electron diffraction (LIED) occurs when a laser pulse ionizes a molecule in the tunnel [164] or in the multi-photon [165] regime. The freed electron scatters on the molecular structure during ionization (in the multi-photon regime) or during both ionization and recollision (in the tunneling regime), as shown in figure 24. The momentum distribution of the ionized electrons can be exploited for a reconstruction of the outermost molecular orbital. It is worth noting that laser-induced electron diffraction and high-order harmonic generation are complementary phenomena: upon recollision, the electron wave packet can either recombine with the parent ion emitting a photon (HHG) or be diffracted by the ion (LIED). In order to probe the molecule in an effective way, the scattering electron must have a de Broglie wavelength on a scale comparable to the molecular bond lengths, which corresponds to kinetic energies of the order of 100 eV or more [164].

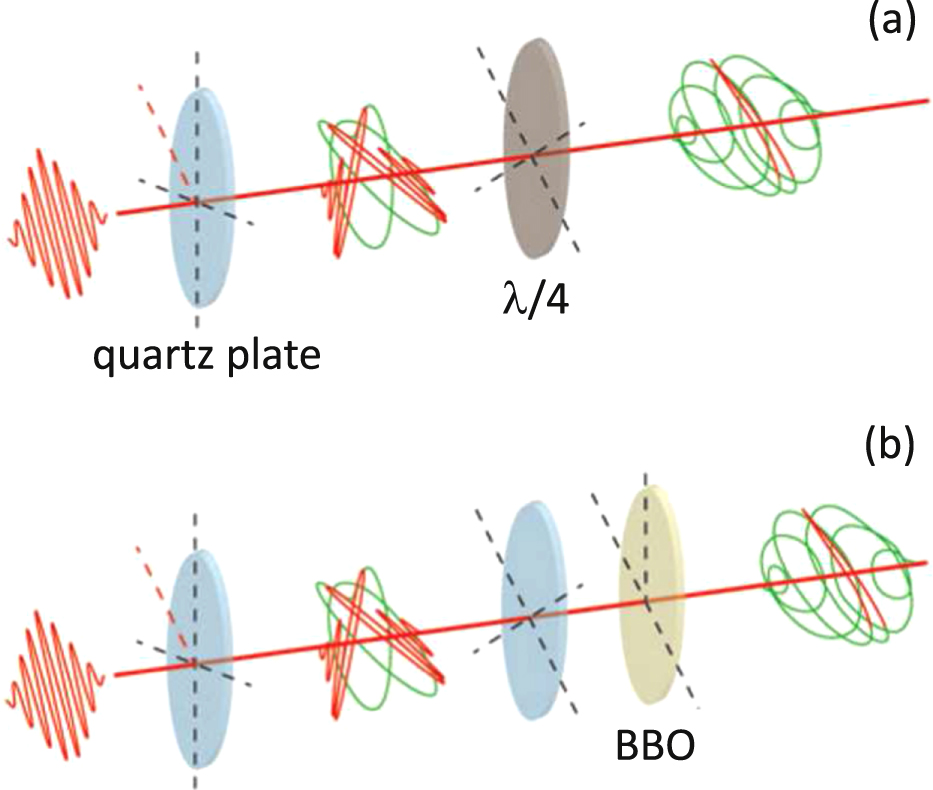
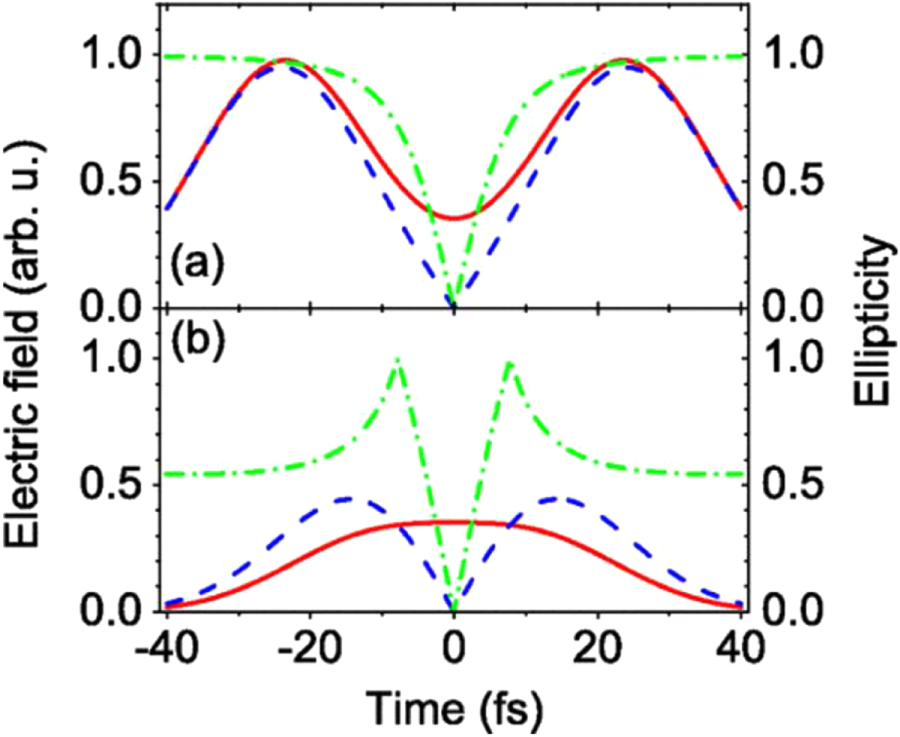
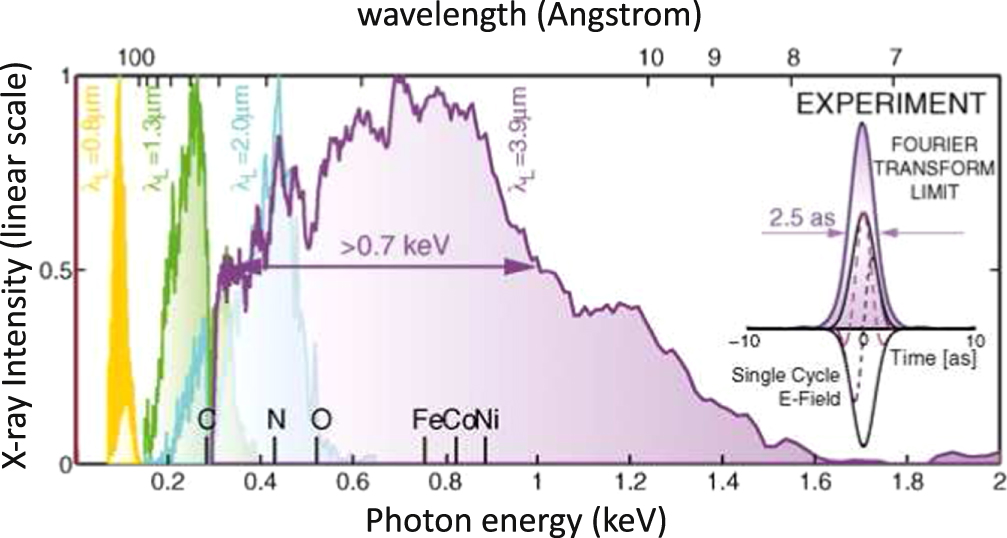
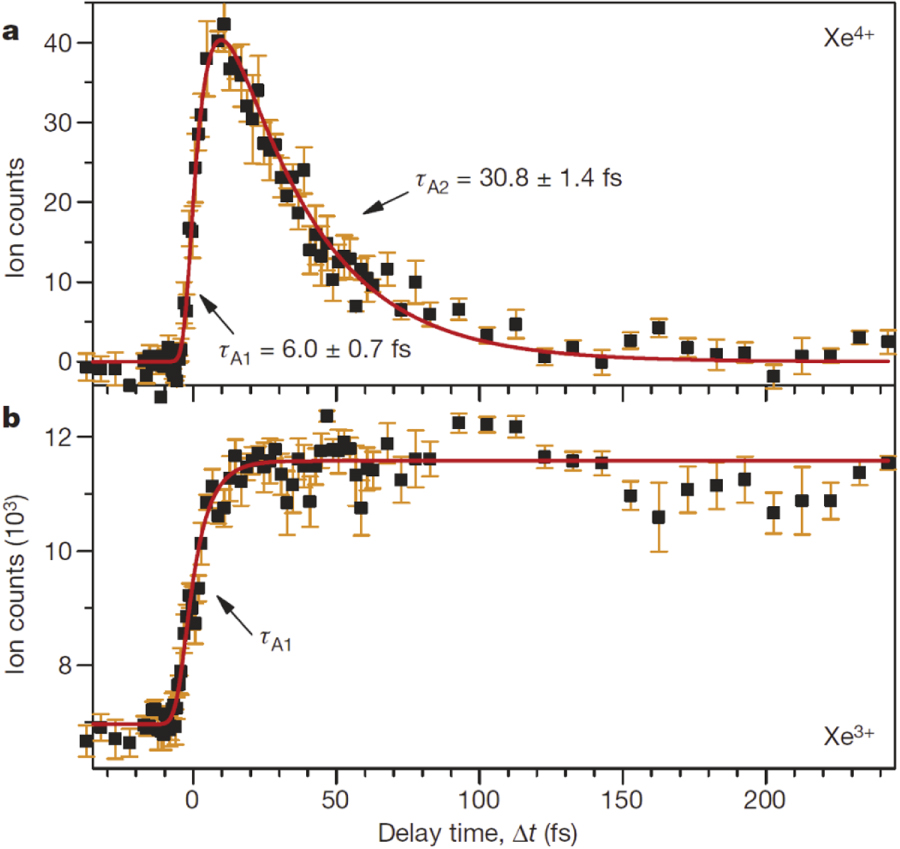
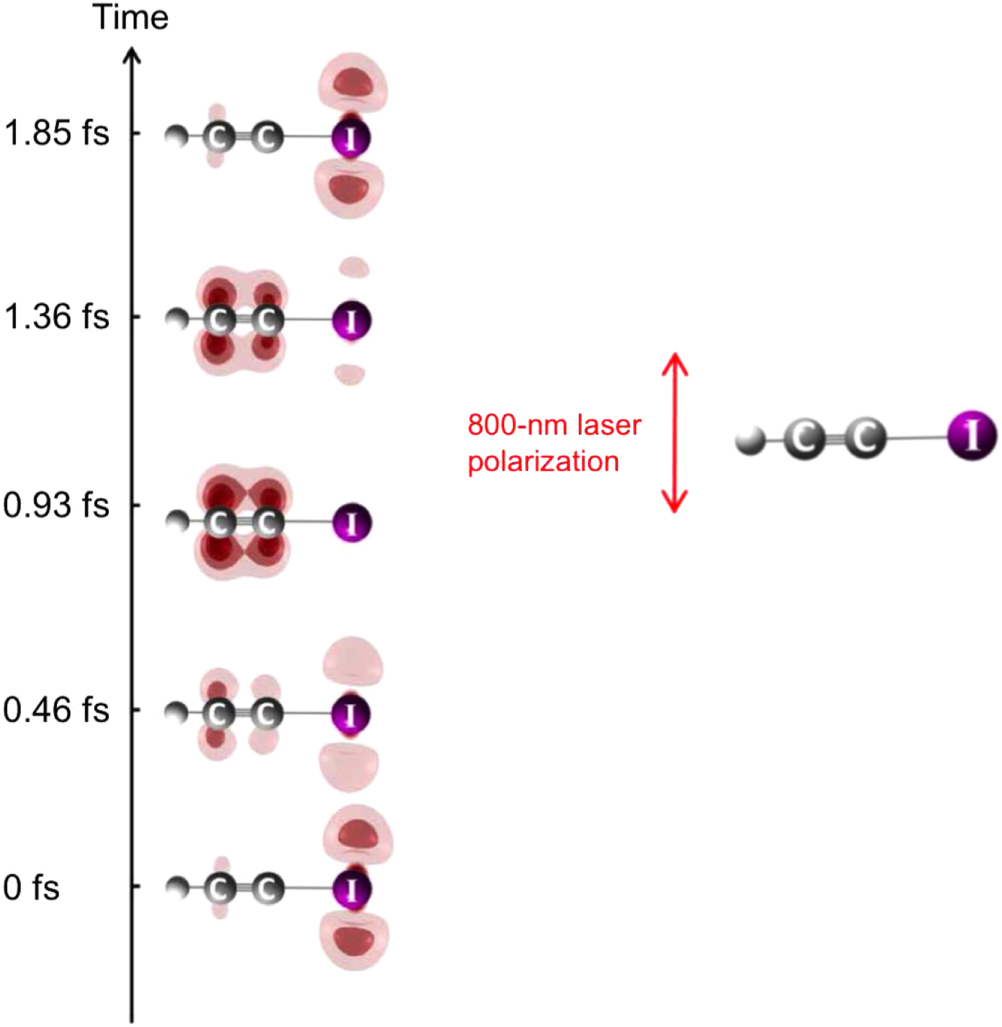
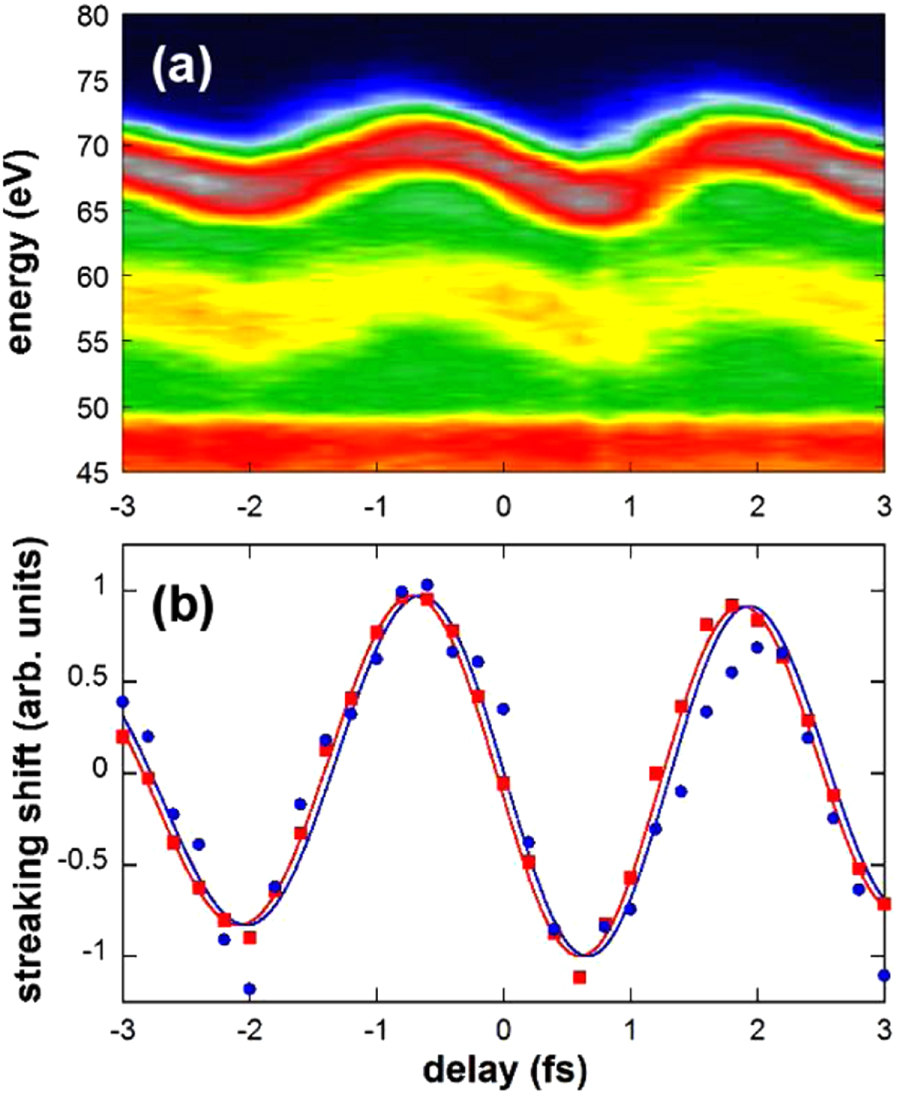
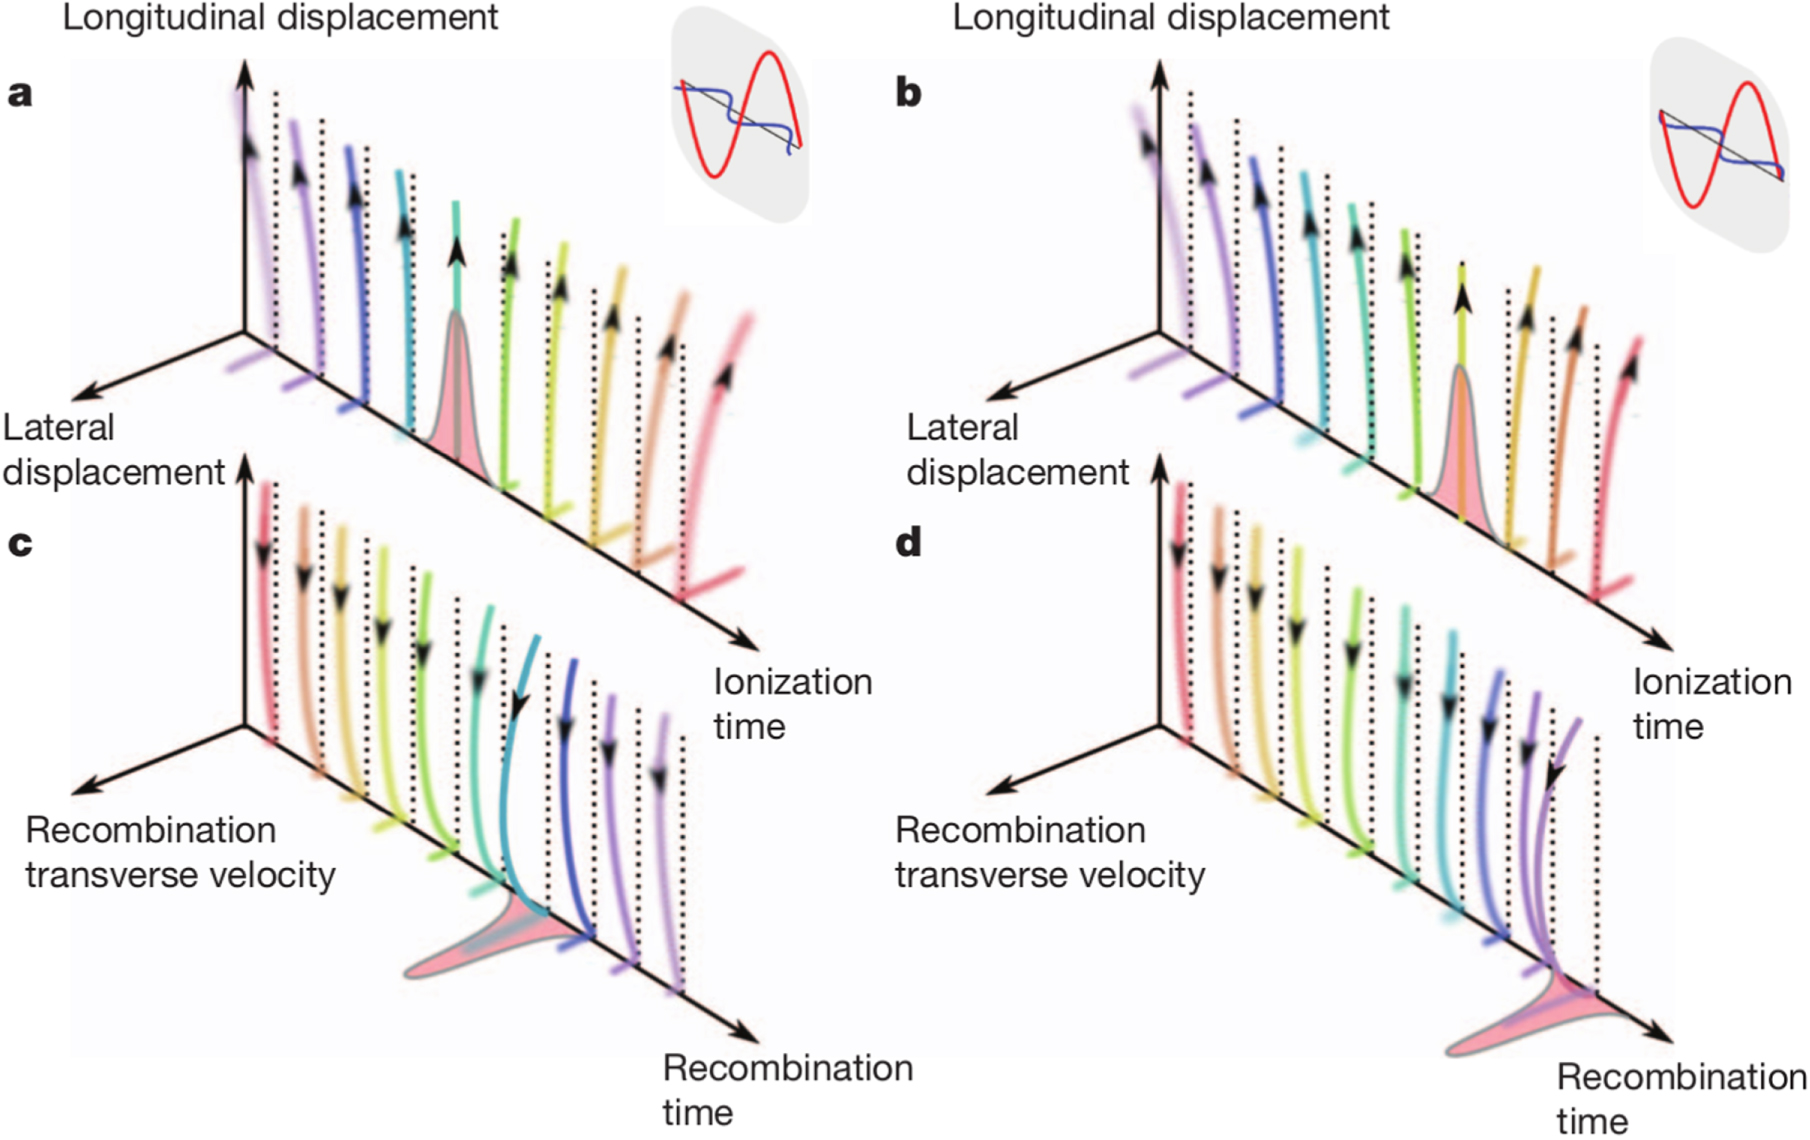
Figure 24. Top: during photoionization a portion of the electron wave packet escapes directly to the detector. Bottom: the remaining portion is driven back to the parent ion. The central portion of the recolliding wave packet diffracts from the molecule. Reproduced with permission from [164].
Download figure:
Standard image High-resolution image
The first LIED experiments were performed in small molecules using 800 nm laser pulses [164]; however, according to numerical simulations, a noticeable improvement of this technique may come from the exploitation of mid-IR ultrashort driving pulses [166]. Indeed mid-IR pulses may access a larger range of diffracted electronic momenta at low peak intensity; moreover the exploitation of a single-cycle pulse, which has been proven feasible [167], would limit the occurrence of multiple rescattering events, thus avoiding complex procedures for the retrieval of the molecular structure from the acquired data. Recently Blaga et al extended the LIED technique to time-resolved measurements of small molecules by using a tunable source of mid-IR laser pulses [168]. In a subsequent investigation, the same authors demonstrated accurate extraction of electron–ion differential cross sections from LIED experiments driven by mid-IR pulses in noble atoms [169]. The results opened novel perspectives in LIED measurements since they demonstrated that, at the high kinetic energies imparted by mid-IR pulses to colliding electrons, the role of valence orbitals in the diffracted pattern is negligible; hence structural dynamics in excited molecules can be followed by LIED without considering unknown contributions from outermost electrons. Very recently Pullen et al reported the simultaneous measurement of the CC and CH bond lengths in aligned acetylene through LIED, exploiting full three-dimensional electron–ion coincidence detection in combination with a mid-IR source at high repetition rate [170]. This work is definite proof that LIED is a robust and reliable technique for dynamical studies in complex molecules.
In the original version, LIED techniques aiming at the reconstruction of the molecular structure were based on the angular dependence of the scattered electrons; this approach requires the exploitation of a complex experimental setup as well as of a nontrivial analysis of the experimental data. In 2014 Xu et al demonstrated that, in some cases, a simplified approach can be adopted: instead of analyzing the angular dependence of the diffraction pattern at a fixed amplitude of the electron momentum, one can fix the scattering direction and analyze the electron energy spectrum [171]. This approach, dubbed fixed-angle broadband laser-driven electron scattering (FABLES), is able to retrieve easily the bond length of aligned molecules, thus simplifying time-resolved measurements of the molecular structure [171].
Though less explored than LIED, photoelectron holography is another intriguing phenomenon able to provide a description of the molecular structure. In 2011 Huismans et al exploited 7 μm pulses produced by a mid-IR free-electron laser for measuring time-resolved holographic patterns of photoelectrons produced in metastable (6 s) xenon [172]. The experiment demonstrated that tunnel ionization is a coherent source of photoelectrons that interfere with scattered ones, giving rise to electron holography. The large laser wavelength, which is expected to induce a very large wave packet spreading and thus a low scattering probability, did not hinder the hologram detection; on the contrary the large electron excursion, combined with the Coulomb focusing induced by the ion field, increased the scattering probability [172]. Recent investigations on photoelectron holography [173] demonstrated that a retrieval of the molecular structure exploiting recolliding electrons should take care of the detailed shape of the electron wave packet; in particular the authors concluded that the electron wave packet released from any non-symmetric system by strong-field ionization will exhibit an offset in the phase front that must be carefully considered and may influence both LIED and HHG-based techniques [173].
6. Conclusions
Fifteen years after the first demonstration of the generation of attosecond pulses, produced by using HHG in gases, it is possible to make a few simple statements: attosecond pulses are unique tools for the investigation of ultrafast electronic processes in atoms, molecules, nanostructures and solids. Impressive progress has been demonstrated from the technological point of view, with the possibility to routinely generate attosecond pulses in perfectly reproducible ways. Several new experimental approaches have been proposed and implemented, which allow real-time observation and control of ultrafast electronic events at the heart of several important processes. Future advances in attosecond technology will permit the routine generation of high-energy attosecond pulses, thus offering the possibility to perform attosecond-pump–attosecond-probe experiments, whose feasibility has been already demonstrated in a few impressive works [53, 174].
Acknowledgments
We acknowledge the support of the European Research Council under the ERC grants no. 227355 ELYCHE, no. 307964 UDYNI and no. 637756 STARLIGHT.