

Abstract
The primary requirement for the development of tools for extreme ultraviolet lithography (EUVL) has been the identification and optimization of suitable sources. These sources must be capable of producing hundreds of watts of extreme ultraviolet (EUV) radiation within a wavelength bandwidth of 2% centred on 13.5 nm, based on the availability of Mo/Si multilayer mirrors (MLMs) with a reflectivity of ∼70% at this wavelength. Since, with the exception of large scale facilities, such as free electron lasers, such radiation is only emitted from plasmas containing moderately to highly charged ions, the source development prompted a large volume of studies of laser produced and discharge plasmas in order to identify which ions were the strongest emitters at this wavelength and the plasma conditions under which their emission was optimized. It quickly emerged that transitions of the type 4p64dn − 4p54dn+1 + 4dn−14f in the spectra of Sn IX to SnXIV were the best candidates and work is still ongoing to establish the plasma conditions under which their emission at 13.5 nm is maximized. In addition, development of other sources at 6.X nm, where X ∼ 0.7, has been identified as the wavelength of choice for so-called Beyond EUVL (BEUVL), based on the availability of La/B based MLMs, with theoretical reflectance approaching 80% at this wavelength. Laser produced plasmas of Gd and Tb have been identified as potential source elements, as n = 4 − n = 4 transitions in their ions emit strongly near this wavelength. However to date, the highest conversion efficiency (CE) obtained, for laser to BEUV energy emitted within the 0.6% wavelength bandwidth of the available mirrors is only 0.8%, compared with values of 5% for the 2% bandwidth relevant for the Mo/Si mirrors at 13.5 nm. This suggests a need to identify other potential sources or the selection of other wavelengths for BEUVL. This review deals with the atomic physics of the highly-charged ions relevant to EUV emission at these wavelengths. It considers the developments that have contributed to the realization of the 5% CE at 13.5 nm which underpins the production of high-volume lithography tools, and those that will be required to realize BEUV lithography.
Export citation and abstract BibTeX RIS
Introduction
Development of shorter wavelength sources in the extreme ultraviolet (EUV) and soft x-ray spectral regions has been motivated by their application in a number of high profile areas of science and technology. Since the 1980s, progress has been spurred by the development of multilayer and zone plate optics that permit focussing and imaging using short wavelength photons. While much interdisciplinary research is now directed to fabrication and imaging of nanostructures or three-dimensional imaging and single-shot flash photography of microscopic biological structures, such as cells and macromolecules, in vivo, by far the largest activity has been in the area of so-called extreme ultraviolet lithography (EUVL). Currently, state of the art lithography is performed using 193 nm ArF excimer lasers. To print smaller feature sizes requires moving to successively shorter wavelengths and the development of Mo/Si multilayer mirrors (MLMs) with reflectivities of around 70% at 13.5 nm in a 4.5% bandwidth led to the selection of this wavelength for the development of EUVL and prompted the search for suitable sources with strong EUV emission at this wavelength. After some twenty years of research, the semiconductor industry is finally introducing lithography sources that have sufficient in-band power for high-volume manufacturing (HVM). The deployment of such systems is essential to keep pace with Moore's law, which envisages a doubling of computing capacity every eighteen months or so, corresponding to a decrease in spatial dimension of individual components by ∼40%. The smallest feature size that can be printed, the linewidth W, is determined by the wavelength λ and the numerical aperture NA of the optical system according to  where the parameter
  [1] and NA = 0.33 for the current generation of EUVL tools [2]. The processing conditions of the wafer determine the exact values of k1. Since exposure tools using Mo/Si MLMs require typically ten reflections, including that from the mask, the final throughput is typically about 2% and this is confined to a region with a bandwidth of 2% centred on 13.5 nm, which defines the so-called 'in-band' region [3] (figure 1). The attractiveness of EUVL stems from the fact that it represents the extension of tried and tested optical methods, albeit to another wavelength region. The alternatives of immersion lithography at 193 nm with double exposure and electron beam lithography were dismissed by lithography tool manufacturer ASML as being too expensive by comparison with EUVL, once feature sizes drop below 22 nm [4].

Figure 1. Reflectivity characteristic of multilayer mirrors for 13.5 nm (Mo/Si) and 6.X nm (La/B) lithography, using reflectivities from [5]. Note that the reflectance bandwidth is lower for the lower wavelength mirror. The blue curve is for a single reflection whilst the green curve is for ten reflections.
Download figure:
Standard image High-resolution imageIn any practical source, because of the short wavelength, emission from moderate to highly charged ions must be involved and a suitable plasma-based arrangement is required to generate a plasma temperature sufficient to produce large populations of the relevant species. For a blackbody source to peak at 13.5 nm, the required temperature is approximately 18.5 eV which indicates that discharge produced plasmas (DPPs) and/or laser produced plasmas (LPPs) with an electron temperature of at least this value are required. In addition to identifying the most suitable choice of element, the parameters to be optimized include the plasma conditions such as electron and ion densities and temperatures which are strongly dependant on discharge voltage and duration for DPPs and laser wavelength, pulse duration and focussing conditions for LPPs. This optimization hinges on maximizing the conversion efficiency (CE) of input laser energy (in the case of LPPs), or discharge energy (in the case of DPPs) into EUV energy within the 2% bandwidth of Mo/Si MLMs. For LPPs the CE is thus defined as the ratio of the EUV output energy within this bandwidth to total input laser pulse energy whilst for DPPs it is the percentage of the total electrical energy used to create the plasma that is emitted in-band.
Based on available spectroscopic data, three candidate elements quickly emerged, Li, Sn and Xe all of which have ions with strong resonance transitions within the required 2% bandwidth at 13.5 nm. Although Sn plasmas were already known to emit strongly 13.5 nm [6, 7], early work had concentrated on Xe plasmas since, as an inert gas, Xe posed fewer debris problems than Sn and moreover, gas and liquid jet target systems had been successfully developed as LPP sources [8]. The use of Xe also posed little difficulty in DPP sources. Although an early experiment had already shown the feasibility of using EUV emission from LPPs for performing contact lithography [9], the first demonstration of projection EUVL was made at Sandia Labs in 2000–2002, where the EUV LLC Engineering Test Stand (ETS) tool operating with a capillary discharge Xe source was used to successfully pattern 45 nm features onto resists for the first time [10]. However, the CE of Xe DPP sources without laser activation was found to be at best 0.5% while LPPs generated with Nd:YAG laser pulses at λ = 1.06 μm on solid Xe targets had a maximum CE close to 1.2% [11]. While most academic research has concentrated on LPPs, hybrid LPP-DPP sources were developed by industrial researchers. For example, after discounting the use of Xe discharge plasmas because of the low CE from input electrical energy to in-band EUV emission, Philips developed a discharge system using liquid tin electrodes which was triggered by a Nd:YAG laser pulse and which could be operated at repetition rates up to 1 kHZ, while similar systems were built by XTREME UV and Ushio. The CE claimed for these hybrid sources was typically 2% [12]. For LPPs on the other hand, to minimize the problem of debris, mitigation schemes such as plasma curtains to ionize neutral debris and electrostatic and magnetic deflection setups were developed [13].
It was subsequently shown that the 13.5 nm emission from Xe originated from 4d8 − 4d75p resonance transitions in a single ion stage, Xe10+. These lines were identified by Churilov et al [14] from a comparison with atomic structure calculations using the suite of codes developed by Cowan [15]. To attain maximum intensity the plasma conditions should be chosen to maximize the population of this ion stage. A subsequent study performed at the NIST electron beam ion trap (EBIT) source showed that a threefold improvement in intensity within a 2% bandwidth could be obtained if the 4d–4f and 4p–4d resonance transitions in the same ion stage at 12 nm were used instead. Interestingly, a five-fold enhancement was found in a 2% bandwidth near 11 nm where emission is due to 4p64dn − 4p54dn+1 + 4dn−14f transitions in Xe11+ − Xe17+ (n = 7 − 1) [16]. The emission from these transitions peaks at 13.5 nm in Sn [6].
Mo/Be MLMs are potential candidates for operation at wavelengths near 11 nm, but because of the high mobility of Be ions they cannot be fabricated with sufficient boundary layer definition to provide the required reflectivity [18]. If the mirror wavelength cannot be altered then the possibility of using the same transitions in another element was the obvious alternative. In figure 2, the variation of the position of the peak emission from unresolved transition arrays (UTA), resulting from 4p64dn − 4p54dn+1 + 4dn−14f transitions with atomic number is shown [17]. It should be noted that in obtaining this figure, spectra were recorded using two Nd:YAG lasers, one delivering a maximum energy of 250 mJ at λL = 1064 nm in 150 ps and a second giving 400 mJ at λL = 1064 nm in 8 ns. The peak emission from both sets of plasmas generally coincided but because of differences in both opacity and ion populations some slight variation in position were sometimes observed. The reasons for these differences will be discussed in the next section. Calculated average wavelengths with the General purpose Relativistic Atomic Structure Program (GRASP) [19] code for the rare earth elements are in qualitatively good agreement with experiment though absolute values are shifted slightly towards shorter wavelength in every case. In performing these calculations, the line strength distributions for each ion stage were weighted by the ion populations estimated from the calculated average electron temperature and summed to give an overall intensity distribution with absorption effects excluded. It is clear from this figure that the emission peak in Sn appears at 13.5 nm.
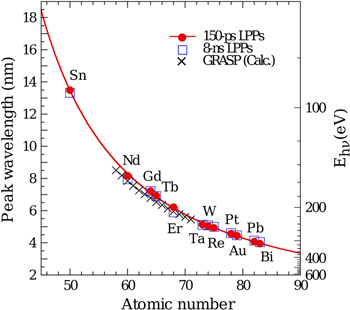
Figure 2. Variation of peak postion for emission from 4p64dn − 4p54dn+1 + 4dn−14f transition arrays with atomic number (Z) [17]. Reproduced with permission from Ohashi et al Appl. Phys. Lett. 104 234107 (2014). Copyright 2014, AIP Publishing LLC.
Download figure:
Standard image High-resolution imageIn Li plasmas the 1s–2p transition of Li2+ also emits near 13.5 nm. For Li plasmas produced by a Nd:YAG laser operating at the fundamental wavelength of 1.06 μm, the CE was investigated at the laser frequencies ω, 2ω and 3ω [20]. The maximum CE of 2.3% was measured at 2ω at an intensity of 2–4 × 10¹⁰ W cm−2 with a spot size of 400–600 μm. The maximum CEs obtained at the other frequencies were a little below 2% with similar focal spot sizes and intensities. These CEs were consistent with comparative studies on Li and Sn plasmas [21], which indicated that CEs for Sn were about twice as great as those for similar Li plasmas. These results were confirmed by a subsequent study which reported lower CEs but again found that Sn plasmas were capable of providing a CE nearly twice that of Li [22] and most effort was thereafter dedicated to the optimization of Sn plasmas as EUVL sources.
In figure 3 the EUV spectra of Xe and Sn are presented for comparison. All three were obtained from LPPs on slab targets. The Xe plasma was formed on a solid Xe target condensed onto a copper finger cooled by liquid nitrogen. The Sn spectra were recorded using LPPs from tin foil (100% Sn concentration, dashed red line) and Sn doped glass (6% Sn concentration by number, solid blue line) targets at a laser power density of ∼2 × 10¹¹ W cm−2 [23]. The 6% Sn target was fabricated by dissolving SnO2 in borosilicate glass to give a concentration of 6% Sn atoms by number. Since a glass capillary array was used to isolate the target chamber from the spectrograph when recording the Xe spectra it was not possible to determine the source radiance. In contrast the absolute intensity was measured for the Sn plasmas as the spectrograph response had been calibrated at the BESSY Synchrotron. The 4p64dn − 4p54dn+1 + 4dn−14f transitions in Xe11+ − Xe17+ (n = 7 − 1) are responsible for the emission peak near 11 nm, while the corresponding transitions in Sn give rise to the emission peaks at 13.5 nm for the 6% Sn target and 13.2 nm for the pure Sn target. The differences in emission result from the difference in opacity resulting from the different Sn concentrations. Emission from the plasma core is absorbed by strong resonance transitions in lower ion stages which means that the line emission from pure targets is dominated by lines from the highest stages present and is consequently shifted to higher energy. In contrast, at low concentrations, the absorption is reduced because of the lower ion density and the spectrum reflects better the emission from all ions present. Indeed, for emission from a specific transition array in a particular ion stage within a LPP, lines with low oscillator strength or gf-values are relatively unaffected by absorption while those with high gf values can actually appear in absorption and may be missing completely in spectra from LPPs of pure metal targets, while at low concentrations the intensities generally mirror the gf-value distribution. The in-band region, which is defined by the reflectivity of the Mo/Si mirrors, is included for comparison. In 2007, the semiconductor industry set a power requirement of >200 W EUV emission in-band at intermediate focus, i.e. after reflection off the collector optic, as a target for source development. It became immediately obvious that while Xe might have a future in metrology sources, for HVM, where EUV power and a high CE of discharge or laser energy into in-band EUV were essential, Sn was potentially a more suitable source.
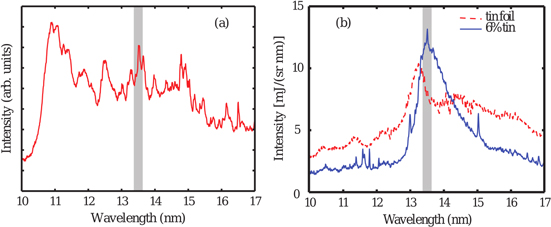
Figure 3. Spectra of Xe (a) and Sn (b) LPPs in the EUV. The Xe plasma was formed on a solid Xe target. The Sn spectra were recorded using LPPs from tin foil (100% Sn concentration, dashed red line) and Sn doped glass (6% Sn concentration by number, solid blue line) targets. In each case the same 1064 nm laser pulse, with a duration of ∼15 ns, was used to form the plasmas at a focused power density of ∼2 × 10¹¹ W cm−2. The Xe spectrum was recorded at 90° to the incident laser pulse through a glass capillary array, while the Sn spectra were recorded at 45° to the incident laser pulse with no array present.
Download figure:
Standard image High-resolution imageRecently, for emission produced from Sn plasmas, Gigaphoton demonstrated an efficient high repetition rate source capable of delivering 92 W at intermediate focus under continuous operating conditions with a CE of 4% and it was foreseen that 150 W would be achieved by the end of 2014 [24]. In their source, a small (∼30 μm diameter) Sn droplet is vapourized and ionized by a prepulse from a Nd:YAG laser and the expanding plasma cloud is then reheated by a pulse from a CO2 laser (figure 4).
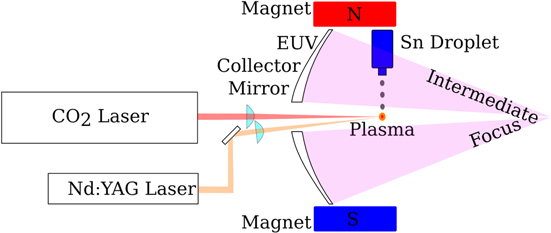
Figure 4. Schematic diagram of the Gigaphoton Sn droplet source. The magnets are used to deflect ionized debris away from the entrance of the lithography tool.
Download figure:
Standard image High-resolution imageIn this review the atomic physics and plasma considerations that led to this choice of illumination scheme and helped pinpoint the optimum laser parameters will be dealt with first and subsequently work on the development of sources for so-called beyond EUV lithography (BEUVL) will be discussed.
Atomic physics considerations for lithography source development at 13.5 nm
As shown in figure 3, the EUV spectrum of Sn is dominated in the 13.5 nm region by an intense UTA, arising mainly from 4p64dn − 4p54dn+1 + 4dn−14f transitions. Because there is significant overlap between lines of these transitions in different ion stages (transitions with Δn = 0 tend to overlap in energy) absorption by lower ion stages significantly reduces the emitted intensity of the UTA [23]. As already pointed out, the use of solid slab targets in which the Sn concentration was reduced was found to both increase the peak brightness by comparison with the output from pure Sn targets and shift the peak into the in-band region (figure 3). Furthermore, if the remaining target constituents were primarily low-Z materials the radiation emitted was concentrated in a band 1–2 nm wide centred near 13.4 nm and the ordinary recombination continuum from the plasma was suppressed compared to that from pure tin targets [25, 26]. This may be understood easily in terms of simple calculations within the collisional-radiative (CR) regime, where collisional excitation is balanced by radiative de-excitation and three body recombination [27], which show that recombination radiation scales as 〈z〉4, where 〈z〉 is the average ion charge in the plasma, which increases with atomic number. Thus the suppression of out–of-band radiation is especially significant for Sn in plastic or hydrocarbon targets which are dominated by hydrogen. In a controlled study with tin-doped glass targets, it was found that the brightness attainable with slab targets was highest for a Sn concentration of 5%, and was ∼45% greater than the emission attainable under identical plasma conditions from pure tin. The resulting CE was close to 3% with a Nd:YAG pulse focused to a power density of 2 × 10¹¹ W cm−2 [23]. In a high resolution study of the UTA emission, the transitions responsible were identified and shown by comparison with calculations using the flexible atomic code [28] to originate from the spectra of Sn IX to Sn XIV and the strongest lines are identified in figure 5 [29, 30]. Plasma modelling calculations performed to obtain the ion distributions as a function of electron temperature (figure 6), showed that the condition for production of these ion stages for an optically thin plasma corresponds to electron temperatures in the 25–50 eV range [31, 32].
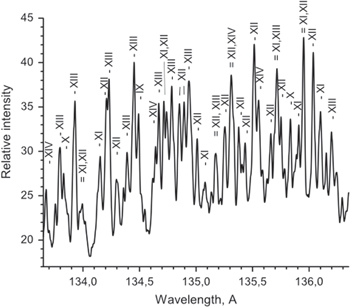
Figure 5. Spectral classification of the strongest transitions appearing in the Sn UTA at 13.5 nm [29]. Reproduced with permission from Churilov and Ryabtsev Phys. Scr. 73 614 (2006). © The Swedish Academy of Sciences. Reproduced by permission of IOP Publishing. All rights reserved.
Download figure:
Standard image High-resolution image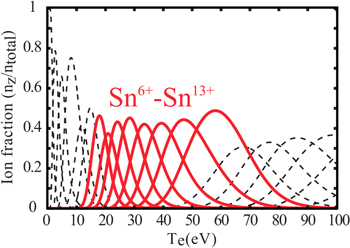
Figure 6. Calculated ion stage distribution in Sn LPPs as a function of electron temperature, assuming collisional radiative equilibrium and an electron density of 1021 cm−3.
Download figure:
Standard image High-resolution imageThe ion stages involved all possess a partially occupied 4d subshell and the dominant emission arises from 4p64dn − 4p54dn+1 + 4dn−14f transitions which merge in adjacent ion stages to a form a UTA consisting of many thousands of lines. For such transitions, because of the near degeneracy of the 4p54dn+1 and 4dn−14f configurations, it is necessary to allow for configuration interaction (CI) in the upper state [6, 33, 34]. The effects of CI cause a strong spectral narrowing and concentrate the emission intensity in the high energy end of the array. This narrowing is clearly visible in figure 7 where theoretical spectra for Sn XIII, obtained using the Cowan suite of codes [15] are plotted. In this figure, the label 4d4f refers to 4p64d2 − 4p64d4f transitions. Even in the absence of CI, calculations for 4p64dn − 4p64dn−14f transitions had shown the presence of 'emission zones' at the high energy end of an array though their position shifted towards the array mean wavelength with increasing ionization, i.e. decreasing n [35]. This enhancement at the high energy end of the array is clearly present in figure 7. The sum 4d4f + 4p4d + 4d5p refers to a full CI calculation of the type 4p64d2 − 4p54d3 + 4p64d4f + 4p64d5p, which clearly shows the spectral narrowing effect. It should be noted that only radiative probabilities are plotted without accounting for the population distribution amongst the upper levels for any particular plasma temperature. According to the UTA formalism, for 4p64dn − 4dn−14f transitions the position of the line strength weighted mean of an array is shifted from the position of the differences in average energies by an amount [36]
where  and
and  are Slater Condon direct and exchange integrals respectively and the coefficients
  and gk resulting from integrals over polar and azimuthal angles in general decrease with increasing k [37]. Here g1 = 137/70 has the largest numerical value and the above formula can be roughly approximated as
  and so the position of the peak emission is determined by the degree of 4d and 4f overlap. In the rare earths, where
  is almost constant for different ion stages of a given element, the effect of CI is to essentially remove this n dependence and the combined 4p64dn − 4p54dn+1 + 4dn−14f array is narrowly peaked at
  above the difference in average energies of the ground and upper state configurations. In figure 2, which presented the variation in position of this UTA with atomic number, it was noted that for the lanthanides the calculated values were all displaced to the high energy side of their true position and this results from the overestimation of the ab initio value of
  in the GRASP code calculation. The same is true of the spectra shown in figure 7 which are also calculated ab initio. In this case the UTA peak is at 12.91 nm or approximately 4.2 eV above 13.5 nm. To obtain better agreement it is necessary to expand the basis to include higher nf orbitals or reduce the effective exchange interaction by scaling the
  parameter as is done when using Cowan code calculations. For example, in calculating the spectrum shown in figure 2, the value of G1(4d, 4f) was found to be 15.811 eV indicating that a scaling of between 70 and 80% for the Slater Condon parameters is required, consistent with other studies.

Figure 7. Ab initio calculations of the effects of CI in the spectrum of Sn XIII. The label 4d4f refers to 4p64d2–4d4f transitions, the label 4p4d refers to 4p64d2–4p54d3 transitions, 4d5p means 4p64d2–4d5p transitions and the sum 4d4f + 4p4d + 4d5p refers to a full CI calculation of the type 4p64d2 − 4p54d3 + 4d4f + 4d5p, which clearly shows the spectral narrowing effect. gA is the statistical weight of the upper level multiplied by the Einstein A coefficient for the transition.
Download figure:
Standard image High-resolution imageIn an excited state basis, mixing of 4f and nf orbitals essentially increases the mean radius of the 4f wavefunction [38]. The spectra of the lanthanides and the elements preceding them in the periodic table are well known to be dominated by 4f contraction effects [39].
For tin, as for these elements, 4f contraction increases with ion stage due to the interplay between the attractive Coulomb and centrifugal repulsion  terms in the effective radial potential, where l is the orbital angular momentum quantum number and m is the reduced mass of the electron. Both the 4f wavefunctions and effective radial potentials for each ion stage from neutral Sn to Sn13+ are presented in figure 8. In neutral Sn, it is seen that the effective potential is bimodal with a shallow inner well close to the nucleus separated from a broad outer well, with a minimum near 16a0, by a centrifugal barrier. The EUV absorption spectrum of Sn I is dominated by a large 4d–
 f shape resonance [40, 41] or delayed onset, due to the fact that 4d–f excitation can only occur when the f photoelectron has sufficient energy to surmount the centrifugal barrier separating the outer and inner wells. Indeed, because of the lack of any overlap between the 4d wavefunction and the bound nf wavefunctions which are eigenstates of the outer well, the only strong discrete transitions appearing in the 4d photoabsorption spectrum are 4d–np [42], With increasing ionization, the inner well deepens, the potential barrier decreases and the outer-well nf functions gradually contract into the inner well region, As they do, the 4d, nf overlap increases and the intensity of 4d–nf transitions increases. In Sn II the spectrum is still dominated by the 4d–f shape resonance but by Sn IV the resonance is overlaid by many strong lines [43]. With increasing ionization, the inner well deepens sufficiently to support a bound 4f electron and at this point the spectrum will be dominated by discrete transitions and the oscillator strength, associated with 4d–f in the neutral is effectively transferred to 4d–4f excitation. From figure 8 it is seen that the centrifugal barrier effectively disappears past Sn7+ or Sn8+. As a result, the 4d, 4f wavefunction overlap, which increases with increasing ionization stage, approaches a constant value past Sn9+ causing the matrix element for 4d–4f transitions to increase and also to shift the transition energy to higher values with increasing ionization. Consequently, the emission of the Δn = 0, n = 4 − n = 4 UTA in tin is not as bright as the corresponding transitions in the lighter rare earths [44] where the 4f wavefunction contracts much more rapidly with increasing ionization. The overall result, because of this more gradual contraction in Sn, is that the 4–4 UTA has a relatively large bandwidth and is less sensitive to opacity effects since the overlap of discrete Δn = 0 transitions in adjacent ion stages is less complete, especially in stages below Sn9+. Calculations have also shown that production of more highly ionized ions with 4pn ground configurations is, in general, undesirable since, as no strong CI effects are present to cause overlap at high energy, the 4p–4d transition arrays move to longer wavelengths with increasing n and result in a broadening of the UTA. Another well known cause of broadening of UTAs is the emission of satellite lines of the type 4p64dn−1nl − 4p54dnnl + 4dn−24fnl resulting from dielectronic recombination or charge exchange [45, 46], which contribute on the long wavelength side of the corresponding resonance transitions in a particular ion stage. The cumulative effect when a number of ion stages are considered is an enhancement of intensity on the long wavelength side of the array [47]. The effects of satellite emission can explain, at least in part, the long wavelength emission in the 14–16 nm region present in the 100% Sn spectrum of figure 3. Since LPPs are in general optically thin for satellite transitions, their emission increases with Sn concentration and so they are essentially not visible in the 6% Sn spectrum. Direct observation of the satellites that can appear in Sn spectra in the region of the UTA was made in a charge-exchange experiment where charge selected ions of Sn, produced by the electron cyclotron resonance (ECR) source at Tokyo Metropolitan University, captured an electron in collisions with rare gas atoms [48]. The pressure in the interaction chamber was kept sufficiently low so as to favour single electron capture. The original aim of the experiment was actually to observe ion differentiated resonance emission since in LPP experiments, spectra are both temporally and spatially integrated over a laser pulse, i.e. over a wide range of plasma conditions and contain contributions from many ion stages which overlap especially in the region of the 13.5 nm UTA. However, unexpectedly, the charge exchange spectra were found to be dominated by an intense unresolved transition array near 13 nm in every case while the resonance lines were relatively weak. In Sn XV for example, the previously identified 4p6 1S0 − 4p54d 1P1 resonance line at 13.2463 nm [49] was very weak yet the spectrum contained an intense UTA (figure 9). From atomic structure calculations, it was found that this array arises from 4s24pm-14d − 4s24pm-14f + 4s24pm−24d2 transitions. Thus in the case of Sn XV, instead of a single resonance line, the spectrum contains a large number of lines resulting from 4s24p54d − 4s24p54f + 4s24p44d2 transitions. The analysis also showed that excited state CI effects must again be included when interpreting these satellite spectra [48].
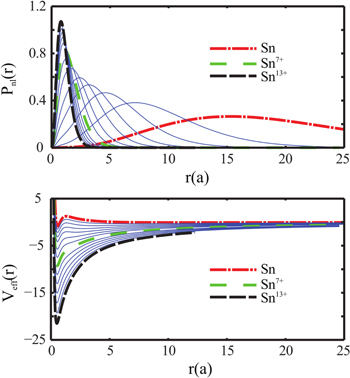
Figure 8. 4f wavefunction contraction with increasing ionization in Sn (top) caused by the changing radial potential (bottom). Note that in neutral Sn the potential is bimodal and the 4f wavefunction is essentially an eigenstate of the outer well. In Sn7+ the (centrifugal barrier separating the inner and outer well has disappeared and the 4f wavefunction has contracted into the ionic core. With increasing ionization the inner well deepens and the 4f wavefunction becomes more tightly confined.
Download figure:
Standard image High-resolution image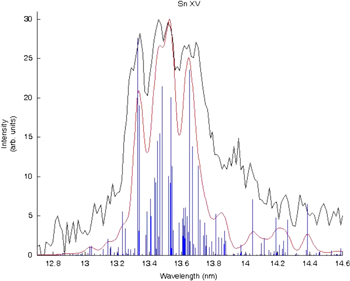
Figure 9. UTA in Sn XV arising from 4p54d − 4p44d2 + 4p54f satellite emission observed in charge exchange spectra at the TMU ECR source [48]. The upper (black) trace is the experimental specrum recorded by charge exchange, the positions and gA values of the individual satellite transitions, calculated using the Cowan code [15] are indicated by the stick plots while their convolution, assuming and instrumental linewidth of 0.01 nm is given by the red trace. Reprinted figure with permission from D'Arcy R, Ohashi H, Suda S, Tanuma H, Fujioka S, Nishimura H, Suzuki C, Kato T, Koike F, White J and O'Sullivan G Phys. Rev. A 79 042509 (2009). Copyright 2009 by the American Physical Society.
Download figure:
Standard image High-resolution imageProperties of Nd:YAG LPPs
Early work with LPPs using both slab and droplet Sn targets with Nd:YAG irradiation showed that the maximum CE obtainable was of the order of 2–3% [23]. It was limited by three factors, plasma opacity, reflection by steep plasma gradients and suboptimal plasma emitting volumes. Thus schemes reducing the plasma density, either by using doped targets as mentioned earlier, by using foam targets [50] or increasing the laser wavelength to reduce the critical electron density, nec, and by extension, ion density, were explored. In a LPP most of the laser radiation is absorbed at a density close to the critical value nec ∼ 1021/λL2 cm−3, where λL is the laser wavelength in μm [27]. It had already been shown that the optimum power density was in the region of 1–2 × 10¹¹ W cm−2 for λL = 1.06 μm and that if λL was decreased using harmonics of Nd:YAG but the power density was held constant, the CE decreased due to increased opacity [7].
In an experiment to measure the variation in CE for a number of pulse durations ranging from 1.2 to 8.5 ns it was found that the optical depth, τ, for 13.5 nm radiation, depended on the laser intensity, IL, wavelength, λL and pulse duration, tL, according to [51]
Therefore the optical depth increases linearly with laser pulse duration. A maximum CE of 2.2% was obtained for a pulse length of 2.3 ns at a power density of 5 × 10¹⁰ W cm−2. At longer pulse durations the CE decreased as expected. The results also showed that the optimum pulse duration was determined not only by the optical depth but also by the fraction of the laser energy absorbed in the EUV emitting region, located in front of the critical density layer and where laser absorption is dominated by the inverse bremsstrahlung process. The fraction of the laser energy absorbed in the EUV emitting region was calculated to vary from 25% at 1.2 ns to 85% after 8.5 ns corresponding to absorption at increasing scale lengths due to plasma expansion. Hence the emission can be enhanced by increasing the scale length. However this must be achieved while at the same time minimizing the optical depth which increases with pulse duration.
The use of prepulses provides an effective method of accomplishing this result. The use of prepulses with 100% Sn containing targets was also found to increase the CE by up to 80% [52]. Using a prepulse meant that the initial plasma had time to expand before being reheated by the main pulse. The increase in intensity was then due to the interaction of the main pulse with a larger plasma EUV emitting volume with a density lower than that produced directly by the laser-solid interaction. The emission from this lower density plasma is not self absorbed as effectively and so the overall emission is enhanced by the presence of a larger plasma volume that is less opaque to its own emission at 13.5 nm. In addition there is an added bonus that reflection losses are reduced because of the gentler plasma gradients. Various plasma models all pointed to a CE of 6–8% being attainable in the absence of absorption but this figure is reduced to 2–3% when opacity effects are included. The optimum prepulse duration should be very short as it influences the expansion and uniformity of the initial plasma. Gigaphoton have observed that the overall CE increases from 3% to almost 5% if the prepulse duration was changed from 10 ns to 10 ps. For 10 ns pulses, the plasma is essentially disc shaped, with the dominant expansion orthogonal to the incident beam direction, while for 10 ps illumination it is 'dome' shaped and the expansion is greater in the laser beam direction, meaning that the main pulse interacts with a larger, less dense volume with a less steep plasma gradient [53].
The strongest emission was also observed in the direction of the target normal. Subsequent experiments confirmed this aspect and also clearly showed that the emission was not isotropic [23, 54, 55].
Properties of CO2 LPPs
Whilst much of the work on Nd:YAG LPPs was being conducted, it was pointed out that the opacity problem could be greatly reduced by the use of CO2 lasers operating at λ = 10.6 μm. The critical electron density and hence the ion density at this wavelength is a factor of 100 lower than for Nd:YAG produced plasmas [57]. Detailed calculations by Nishihara and co-workers [58] showed that for CO2 radiation incident on solid Sn targets at a power density of 1010 W cm−2, a CE of up to 8% was attainable in a 30 eV plasma. Moreover, at lower densities and irradiances, even higher CEs are attainable. However in this case the number of ions may become so small that the absolute emitted intensity is insufficient to reach the power requirements for HVM, even at 100 kHz repetition rates. In addition the calculations showed that the scale length for laser absorption through inverse bremsstrahlung can match that for optical depth for 13.5 nm radiation and when optimized can yield a spectral efficiency of ∼35%. Spectral efficiency was defined as the ratio of the emission in the 2% bandwidth at 13.5 nm to the total emission [58]. The optimum pulse duration under these conditions was calculated to be of the order of 10 ns. Early experiments with CO2 laser irradiation of solid Sn slab targets indicated that CEs approaching 4% could be obtained for 10 ns pulses and that the CE dropped for longer pulses as shown in figure 10 [56]. Since commercial CO2 lasers generally have pulse durations >10 ns careful target design needs to be considered. Subsequently it was found that the CE increased from 2% to 4% with 100 ns long CO2 pulses if plasmas were formed in 200 μm deep cavities at power densities of (1–3) × 1010 W cm−2 [59]. This effect was not evident for Nd:YAG produced plasmas using clean slab targets (impurities due to oxidation or surface contamination can often affect the power emitted in the first shot on target). Subsequently it was found that using 100 ns pulse lengths and similar power densities that the CE increased from 2% to close to 5% after twenty laser shots at the same target position [60]. This was attributed to the formation of a cavity of diameter 500 μm and depth 100 μm. The CE was found to saturate at 5% for additional shots. Another study [61] found that the CE increased from 2.7% to 5% after around sixty shots on the same position using 30 ns long CO2 pulses at a slightly higher power density of 6 × 10¹⁰ W cm−2. In this work it emerged that the highest CEs were obtained for groove widths between one and two times the focal spot diameter. Modelling showed that the electron density inside the groove had a maximum value of 1019 cm−3 and compared to a planar target, where the plasma expands freely and the density decreases rapidly away from the surface, the walls of the groove inhibited the hydrodynamic expansion of the plasma and gave some lateral confinement leading to effectively a 1D expansion. The result was a denser region in front of the target with a gentler density gradient compared to plasmas expanding in 2D. In addition, the lateral confinement produced by the groove or crater walls, reduces kinetic energy loss from the EUV production zone thereby boosting radiation losses. When the target is located at the focal position of a lens a steep density gradient is produced that leads to a lower CE than when the lens is slightly defocused. In the latter, modelling and interferometric studies indicate a slower reduction in density and gentler gradient in this case also which results in increased emission [62].
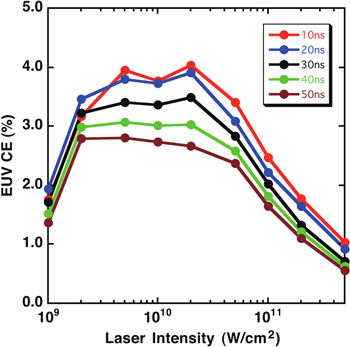
Figure 10. EUV conversion efficiency versus pulse duration for CO2 illumination of a planar Sn target [56]. Reprinted from Sunahara A, Nishihara K and Sasaki A Plasmas Fusion Res. 3 043 (2008), with permission from JSPF.
Download figure:
Standard image High-resolution imageMass limited targets
In HVM, since laser repetition rates up to 100 kHz are needed, slab targets cannot be used as the heat produced would be sufficient to vapourize them. Various solutions were proposed that included 'punch out' targets, where a laser is used to vapourize a small section of a foil that could then be reheated by a second laser pulse [63] as well as mass limited droplets (to minimize debris) or mist targets [64–66]. However, direct illumination of mass limited droplets results in low CEs as the beam diameter generally exceeds that of the droplet, particularly for CO2 pulses and the plasma gradient is steep resulting in a sizable reflection. The first successful demonstration with a droplet target used 10 ns Nd:YAG laser prepulses incident on 40 μm diameter Sn droplets at a power density of 5 × 10⁸ W cm−2 to produce a low energy plasma. The mismatch between solid and critical density is less for Nd:YAG than CO2 resulting in more efficient heating. The resulting plasma expanded at a velocity of approximately 105 cm s−1 and the density scale length reached ∼200 μm after around 200 ns [58]. It was found that if the main 10 ns CO2 laser pulse arrived 180 ns after the end of the prepulse, a CE of 6.5% was obtained (figure 11). At the time of these experiments, the industry roadmap called for the production of 180 W of in-band radiation at intermediate focus. Assuming a collection efficiency of 33% and that each Sn ion emits in the region of 5–10 in band photons per laser pulse, a droplet of diameter 20 μm containing around 1014 atoms should be sufficient for a debris-less source [62]. Experiments were performed using 36 μm diameter droplets irradiated with Gaussian 1.06 μm pulses at intensities ranging from 5 × 10¹⁰ W cm−2 to 4 × 10¹¹ W cm−2 while the main 10.6 μm pulse had a duration of 30–50 ns and was focussed to a power density of 1010 W cm−2. The CE was measured as a function of interpulse delay and an interpulse delay of ∼1 μs was found to be optimum. At this time the droplet had expanded to fully fill the focal spot of the CO2 laser at a density where the scale length was close to optimum. However, the maximum CE obtained was close to 4% which indicated that the longer pulse length again reduced the overall efficiency of the process [62]. As already mentioned, Gigaphoton have recently demonstrated an efficient high repetition rate source using ∼30 μm diameter Sn droplets, ionized by a prepulse from a Nd:YAG laser and reheated by pulse from a CO2 laser of 10 ns duration with a CE of ∼4.6% indicating that there is still scope for a further increase in efficiency if the droplet vapourization can be made uniform, the CO2 pulse beam diameter matched to that of the vapour droplet when its electron density is close to 1019 cm−3, and the pulse duration matched to the time before the reheated plasma has too low a density for efficient laser plasma coupling.

Figure 11. Conversion efficiency dependence on CO2 laser intensity for single (dashed) and double (solid) irradiation by a 10 ns pulse on a Sn droplet target. The interpulse delay was 180 ns [58]. Reproduced with permission from Nishihara et al Phys. Plasmas 15 056708 (2008). Copyright 2008, AIP Publishing LLC.
Download figure:
Standard image High-resolution imageOther experiments have been performed to try to obtain a higher overall CE. In one experiment, SnO2 powder was dissolved in water and coated onto a Si wafer to provide a mist target [67]. The powder consisted of particles of 30 nm diameter, but when coated into the substrate these combined to form dispersed agglomerates ranging in size from 10 nm to a few μm. These were then dispersed from the target using a laser pulse shock and were found to expand at a velocity of approximately 40 ms−1 and to reach a distance of 2 mm from the target after ∼60 μs (figure 12). The particle mist was then irradiated by a Nd:YAG pulse at a power density of 5 × 10¹⁰ W cm−2 to produce a plasma and a CE of up 5% was inferred.
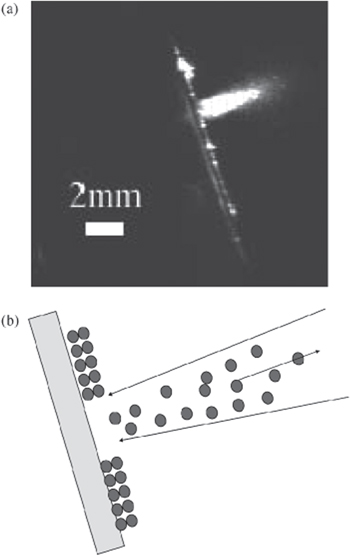
Figure 12. Distribution of particles in SnO2 mist target produced by laser shocking of SnO2 nanoparticles on a Si substrate [67]. Reprinted figure with permission from Aota and Tomie Phys. Rev. Lett. 94 015004 (2005). Copyright 2005 by the American Physical Society.
Download figure:
Standard image High-resolution imageIn a more recent experiment the stagnation layer formed by two identical colliding plasmas was used to provide a target plasma for reheating with a CO2 pulse [68]. Such plasmas have been studied extensively because of their potential usefulness in controlling deposition quality and rates in pulsed laser deposition experiments [69]. In this setup two counter-propagating plasmas interact in a vacuum in a way that depends on their density and relative velocity. Under certain circumstances the two plasmas interpenetrate and form a stagnation layer which then evolves slowly (on a timescale of 100 s of ns) while remaining quite static in space. By carefully tuning the initial separation of the two seed plasmas as well as the initial power density of the laser pulses that formed them, it is possible to tune the electron density and temperature in the stagnation layer. Thus the density can be optimized to maximize CO2 laser absorption.
A Nd:YAG laser operating at λ = 1.064 μm which could deliver up to 650 mJ in a 7 ns pulse was used to produce the initial plasmas. Two beams were produced, by intercepting the laser beam with a wedge prism, and focussed onto the target, resulting in two focal spots of ∼130 μm diameter, producing two plasmas separated by 1.3 mm. The seed plasmas were formed inside a 90o wedge, so that they interacted and collided with their long axes at 90° relative to each other to produce a cigar-shaped stagnation layer, approximately 3 mm long and 0.35 mm wide, which was subsequently reheated by a pulse from a TEA CO2 laser (figure 13). The stagnation layer can be engineered to have a much longer plasma scale length than a plasma formed by a laser pulse incident on a solid target, as well as having a density close to 1019 cm−3, the critical density for a CO2 laser pulse. The CO2 pulse was incident at 90° to the axis of the stagnation layer, so that it hit it side on. The point of impact of the CO2 laser was scanned along the long axis of the stagnation layer and the interpulse delay was varied to identify the circumstances under which the CE was optimized. The maximum CE was obtained at an inter-pulse delay of approximately 60 ns between the seed Nd:YAG pulses with E ∼ 135 mJ into each plasma seed, to give a power density of ∼1 × 10¹¹ W cm−2 reheated by a CO2 pulse with E ∼ 250 mJ, focussed to a power density of ∼1.7 × 10⁹ W cm−2, centred ∼300 μm along the stagnation layer. The maximum CEs obtained were 2.1% when no reheating took place and 3.6% when the CO2 laser pulse was used to reheat the stagnation layer. If the input Nd:YAG laser energy and in-band energy produced when no reheating took place were subtracted from the total values for the reheat experiment a CE of 5.1% of CO2 laser energy into in-band energy is obtained. Moreover the CO2 pulse had a measured focal spot diameter of 520 μm, while the stagnation layer diameter exposed to the CO2 beam, estimated from the visible imaging, was 350 μm. Thus since only 70–80% of the poor quality CO2 beam was utilized, with proper matching of the laser profile to the stagnation layer a further increase of CE up to ∼7% should be attainable [68]. In addition the number of variables pertinent to this type of target, such as seed separation, input laser energy, angle of the wedge, position of CO2 focus and time delay etc, provide a large parameter space for investigations to further increase the CE.

Figure 13. Visible emission from colliding plasmas produced from a 90° wedge Sn target.
Download figure:
Standard image High-resolution imageLithography sources beyond 13.5 nm
In 2009, lithography tool manufacturer ASML, prompted by the availability of La/B4C mirrors with a reflectivity of ∼40% in a 0.6% bandwidth near 6.7 nm [70], announced that sources would be needed at 6.X nm for future lithography beyond 13.5 nm (see figure 1). The value of 'X' was to be decided by the source-mirror combination that maximized the (much narrower than at 13.5 nm) in-band CE. For defect-free multilayers with no interlayer diffusion, the maximum reflectance of LaN/B and LaN/B4C MLMs is ∼83% at 6.66 nm and ∼82% at 6.63 nm, respectively. In both cases the reflectivity drops rapidly at wavelengths below 6.6 nm. From figure 2, it is evident that the Δn = 0 n = 4 − n = 4 UTA of Gd should emit near these wavelengths. Churilov et al recorded spectra of vacuum spark and LPP emission of Gd and Tb, which clearly showed that both elements have 4p64dn − 4p54dn+1 + 4dn−14f transitions at these wavelengths and thus will emit intense UTAs [71]. The results of their study are presented in figure 14. If the peak mirror reflectivities are to be used then the emission from Tb is more intense in the 6.63–6.66 nm range, though Gd is capable of providing greater intensity if the full reflection curve of the mirrors is exploited. If the relevant levels are populated in a plasma, the emission processes are more efficient in Gd and Tb than in Sn because of better overlap of emission from adjacent ion stages and also greater intensity at the peak of the UTA due to the fact that the 4f wavefunction is completely contracted in the relevant ions [72]. In addition 4d - 4f transitions of the type  not present in Sn, may also contribute to the in-band emission.
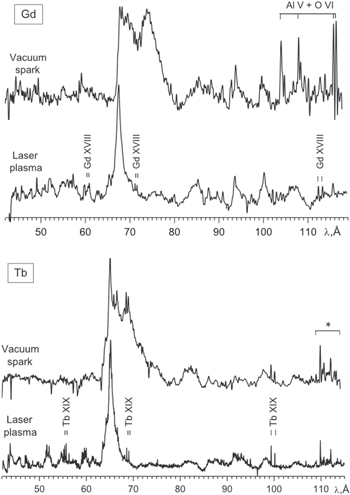
Figure 14. Spectra of Gd and Tb from both LPP and DPP. The LPP spectra were produced using a Nd:Glass laser that delivered 2–3 J in 20 ns, focussed to a power density of (5–8) × 1011 W cm−2 [71]. Reproduced with permission from Churilov et al Phys. Scr. 80 045303 (2009). © The Swedish Academy of Sciences. Reproduced by permission of IOP Publishing. All rights reserved.
Download figure:
Standard image High-resolution imageIndeed the presence of these open 4f subshell configurations makes calculation of spectra much more complex than in the case of Sn because of the greatly increased number of transitions possible. The calculated positions of 4p64dn − 4p54dn+1 + 4dn−14f transitions, are presented in figure 15 [73]. Note that with increasing ionization, the width of the array initially increases and their mean value shifts slowly towards longer wavelength with increasing ion stage. In contrast, transition arrays of the type 4d104fm − 4d94fm+1 display the opposite trend and move toward shorter wavelength with increasing charge [73]. Thus the resonance lines of Ag-, Pd- and Rh-like species essentially define the short wavelength limit of the UTAs in both Gd and Tb. Since these spectra are relatively simple and contain relatively few high intensity lines they are expected to yield the strongest individual features. Moreover, because of the jump in ionization potential encountered in moving to a new shell or subshell, spectra are often dominated by emission from closed subshell or single electron outside closed subshell species because of a build up of population in the former. For other stages with open 4d and 4f outermost subshells the available excited state populations are distributed over a much larger number of levels resulting in a myriad of weaker lines. Further corroboration of this behaviour may be inferred from fusion studies where similar transitions dominate the EUV emission of tungsten ions. The spectrum of tungsten following impurity injection at the large helical device at the Japanese National Institute for Fusion Science is dominated by a UTA analogous to that observed in Gd and Tb [74] and the strongest lines result from 4d—4 f lines in the spectra of Ag-like W XXVIII, Pd like W XXIX and Rh-like W XXX, with ground configurations 4d104f, 4d10 and 4d9. These lines were originally identified from TEXT Tokamak spectra [75–77] where again they were the strongest lines superimposed on the background UTA. Thus the electron temperatures in the EUV emitting regions of a Gd or Tb plasma should chosen to maximize the population of the corresponding isoelectronic ions, Gd17+—Gd19+ and Tb18+—Tb20+. Assuming CR equilibrium, the ion stage distribution as a function of electron temperature for an Nd:YAG LPP is shown in figure 16 to be in the range 100–120 eV [72, 78, 79].
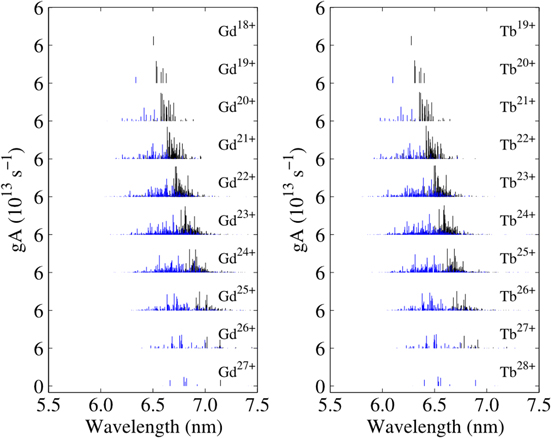
Figure 15. The calculated positions of 4p64dn − 4p54dn+1 + 4dn−14f transitions in the spectra of Gd and Tb ions [73]. gA is the statistical weight of the upper level multiplied by the Einstein A coefficient for the transition. Transitions to levels with a dominant 4p54dn+1 composition are indicated in blue, while those to levels primarily derived from 4dn−14f are indicated in black. Reprinted figure with permission from Kilbane and O'Sullivan Phys. Rev. A 82 062504 (2010). Copyright 2010 by the American Physical Society.
Download figure:
Standard image High-resolution image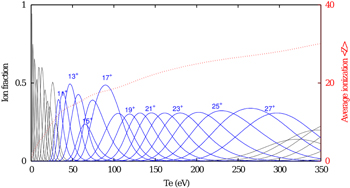
Figure 16. Ion stage distribution as a function of electron temperature (Te) for a Gd plasma [72]. The electron density was assumed to be 1021 cm−3. Reproduced with permission from Kilbane and O'Sullivan J. Appl. Phys. 108 104905 (2010). Copyright 2010, AIP Publishing LLC.
Download figure:
Standard image High-resolution imageThis value is slightly lower than might be expected from a simple comparison with the situation for Sn, as the dominant stages that emit within the 2% band in Sn are from configurations with fewer 4d valence electrons, which are in fact isoelectronic with more highly charged Gd23+—Gd27+.
Because 4d–4f and 4p–4d transitions are involved, similar constraints as in Sn plasmas determine the optimum emission conditions i.e. the plasma should be optically thin, the laser pulse should be sufficiently long to enable the required ion stages to be reached but short enough to limit opacity so once more, ideally, a short wavelength prepulse should be followed by a longer wavelength main pulse for optimum laser plasma coupling. Experiments with dilute targets show an increase in CE in the in-band emission compared to that from pure targets [80], decreasing the wavelength using Nd:YAG harmonics also reduces the CE value [80] while use of a pre-pulse increased the overall CE for inter-pulse time delays of the order of 500 ns [81]. As for Sn plasmas the viewing angle was also shown to affect the observed level of emission [82]. Finally the use of CO2 laser irradiation greatly enhances the spectral purity as seen in figure 17 [83].
To establish the best value of 'X' in 6.X a calculation using both available spectroscopic data [75–77] and theoretical spectra for other stages computed with the Cowan suite of codes [15] yielded a value of X = 0.76 nm for an optically thin plasma at an electron temperature close to 110 eV, which is close to the wavelength of the 4d101S0 - 4d94f 1P1 resonance line emitted from Pd-like Gd18+. Indeed this line completely dominates the spectrum of figure 17. An earlier work based on a combination of spectroscopic measurement and calculations with the RZLINE code [84] yielded a value of X = 0.775 ± 0.25% [85]. Subsequently, in a detailed high resolution study of LPPs recorded from both Nd:YAG and CO2 laser plasmas and supported again by modelling with the RZLINE code this value was refined to X = 0.746 nm and the optimum temperature estimated to be close to 90 eV which at an electron density ne ∼1020 cm-3 is predicted to give a CE close to 3% in a 0.6% bandwidth centred on 6.746 nm [86].

Figure 17. Time integrated emission from CO2 laser produced Gd plasmas at different laser intensities of (a) 5.5 × 10¹⁰, (b) 8 × 10¹⁰, (c) 9.8 × 10¹⁰ and (d) 1.3 × 10¹¹ W cm−2. The peak wavelength of 6.76 nm is due to the 4d10 1S0–4d94f 1P1 resonance line emitted from Pd-like Gd18+[83]. Reproduced with permission from Endo J. Mod. Phys. 5 285 (2014).
Download figure:
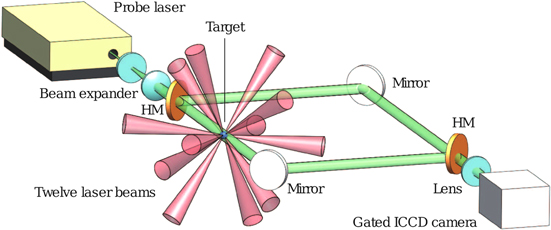
Standard image High-resolution imageHowever measured CE values as reported to date are significantly less. In a comparison of emission from plasmas produced by a 140 fs, λ = 800 nm, E = 30 mJ, titanium:sapphire laser, a 150 ps, λ = 1064 nm, E = 190 mJ Nd:YAG and a 10 ns, λ = 1064 nm E = 420 mJ Nd:YAG pulses, focussed into a 30–40 μm spot, a maximum CE for the 150 ps pulses of 0.4% was measured compared to values of 0.3% and 0.12% for 10 ns and 140 fs laser irradiation, respectively [87]. The optimum laser intensity for efficient 6.7 nm EUV emission was found to be close to 7 × 10¹³ W cm−2, where the electron temperature is calculated to be of the order of 130 eV. Because of the higher electron temperatures required compared to Sn, the focal spot size needs to be smaller which introduces significant kinetic losses from lateral plasma expansion thereby reducing the radiation losses. In a recent experiment that was designed to effectively minimize lateral expansion, the GEKKO-XII laser at the Institute of Laser Engineering (ILE) in Osaka University was used to produce a uniformly expanding plasma. Twelve laser beams each at a wavelength of 1.053 μm and a constant pulse energy of 1 J, giving a total energy of 12 J, with a temporal Gaussian shaped pulse width of 1.3 ns [full width at half-maximum]. irradiated spherical Gd coated targets uniformly (figure 18). At a laser intensity of 1 × 10¹² W cm−2, estimated to yield an electron temperature of around 100 eV, the maximum in-band BEUV CE in 0.06% bandwidth was observed to be 0.8% which is one of the highest values reported to date [88], Use of CO2 pulses should further improve on this figure. In order to get to the required power densities, the development of TEA CO2 system capable of delivering hundreds of mJ in around 1 ns has recently been reported and CEs of up to 1.6% have been measured for focal spot diameters in the 200 μm range using CO2 laser plasmas. In addition to the theoretical challenge posed by the presence of open 4f electron subshells to the modelling of Gd plasmas a major engineering challenge is the design and construction of the target delivery system. The melting point of Sn is 231.93 °C so that droplets are relatively easy to produce, for Gd the corresponding value is 1311.85 °C. Targets based on the stagnation layers formed by two colliding plasmas may provide a viable alternative.
Figure 18. Illumination scheme used to guarantee uniform irradiation of a spherical Gd coated polystyrene target to eliminate the effects of lateral expansion.
Download figure:
Standard image High-resolution image
Conclusion and future prospects
Currently the prospects for HVM at 13.5 nm appear to be very good. Gigaphoton plans to have a commercial source capable of delivering 150 W at intermediate focus available in 2015, while ASML are already shipping NXE 3100 scanners to research institutes and microchip manufacturers. After many years of delay, it appears that 13.5 nm lithography based on LPPs of Sn droplets will be used for HVM within the next three years. As both theory and the results of the colliding plasma reheating experiment have shown, improvement in CE is possible and should help realize even greater power availablility. In this regard, further refinements of the laser prepulse shape, to ensure uniform expansion, supression of droplet fragmentation and of the reheating CO2 pulse temporal profile and duration to guarantee optimum laser plasma coupling should be investigated. In this regard, results from femtosecond heating of cluster targets may have a role in establishing the optimum pre-pulse configuration. It is well known that the CE for EUV emission from cluster targets is greater than for either atomic or solid tragets for fs pulse irradiation [89, 90] while fragmentation is assisted by the excitation of surface plasmons on sub λL sized structures. Thus illimination with a fs pulse immediately after the prepulse illumination could assist with attaining complete vapourization of any remaining droplets and ensure greater plasma uniformity.
With regard to BEUVL at 6.7 nm, since reduction of feature dimensions by a factor of two requires four-times more photons each with double the energy of their 13.5 nm counterparts, the power at intermediate focus must increase by almost an order of magnitute. Given that CEs for Gd targets obtained to date are generally below the 1% level, it looks increasingly unlikely that this will be attainable with Gd LPPs, which implies seeking alternative sources at other wavelengths or development of new source types such as dedicated FELs. This idea is not new, the possibility of using FELs was proposed in the early 1990s [91] but fell from favour as the the power requirements for HVM grew. However FEL based EUV sources are once again being seriously considered as candidates sub 10 nm EUVL for >1000 W EUV sources, and several SASE (self-amplified spontaneous emission) FEL proposals for readiness in 5–7 years are being planned [83, 92–95]. The desired high power may be obtained through scaling to MHz operation. Currently identified challenges are the elimination of temporal spikes through seeding with coherent HHG emission at 13.5 nm, efficient energy recovery in the LINAC, the challenge of combining high resist sensitivity with a high ablation threshold, optics damage at high EUV powers, coherence, and radiation from circulating high energy electron beams and in beam dumps. Establishing a proof of concept system maintaining the existing wafer production cost and the lead time for readiness also remain as major challenges for the realization of FEL-based high power EUV sources.
Acknowledgments
This work was supported by Science Foundation Ireland under Principal Investigator research Grant No. 07/IN.1/I1771 and Science Foundation Ireland International Co-operation Strategic Award 13/ISCA/2846.