
Abstract
The influence of both positive and negative bias on global and plasma-edge parameters has been comparatively studied with a newly designed electrode biasing system in the J-TEXT tokamak. Compared to the 0 V bias case, the global particle confinement of plasma is enhanced under bias with both polarities, with the increments of the central line-averaged density and the soft x-ray emission, as well as the reduction of the edge Hα radiation level. The suppression of plasma-edge fluctuations and turbulent particle transport are obviously observed under bias, in different degrees with different polarities. The potential fluctuation amplitude is observed to be increased at the vicinity of the limiter under positive bias, with the existence of a peaked low-frequency mode characterized as high coherence and near-zero cross-phase poloidally in the edge region, which is not found in the negative bias case. The poloidal correlation length of turbulence is greatly enhanced under bias with both polarities; it shows a positive correlation with the amplitude of the poloidal phase velocity, which is mainly driven by the local Jr × B torque at the plasma edge under bias. The characteristic parameters of intermittent events (i.e. blobs), including amplitude, radial velocity, related particle flux and radial size, decreased dramatically under bias in the edge region.
Export citation and abstract BibTeX RIS
1. Introduction
Although the H-mode was discovered more than three decades ago at its first realization on the ASDEX tokamak in 1982 [1], understanding the underlying physics, especially the mechanism of the L–H transition, is still incomplete and needs more investigation. However, more and more experimental and theoretical results support the robust relationship between the E × B shear flows and the confinement improvement.
One of the effective ways to drive the local E × B shear flows is by externally inserting an electrode into the local plasma that is biased with respect to the wall (or the limiter). Since the pioneering experimental work performed on CCT in 1989 [2], biasing experiments have been carried out on many devices with different magnetic configurations, including tokamaks [3–13], stellarators [14, 15], reversed field pinches [16] and basic plasma devices without closed magnetic field lines [17, 18]. The most common phenomenon obtained through these experiments was the enhancement of local E × B shear flows, accompanied by a suppression of the turbulence and an improvement of the global confinement [19]. The emergence of the Er bifurcation, which is similar to the L–H transition, was firstly reported on CCT under negative bias [2] and later was also observed in TEXTOR with both a positive and negative bias [3]. Once a critical value of the electrode current was reached, a sudden transition occurred with an abrupt decrease of the radial conductivity, as well as a sharp increase of Er and the poloidal velocity, which was followed by a significant improvement, especially of the particle confinement. To better understand the physical mechanism of Er bifurcation with biasing, a theoretical model has been proposed based on a charge conservation equation [20]. The results indicate that the interaction between the two nonlinear terms, i.e. ion bulk viscosity and ion orbit losses, gives rise to the bifurcation phenomenon; various spatial structures of Er are possible for the same boundary condition.
Although the confinement improvement is considered as a general character of the biasing experiments, its effectiveness, however, seems to be related to the way of biasing. In ISTTOK, a comparison shows that the limiter biasing is less efficient in driving the E × B shear flows and improving confinement than the electrode biasing; negative biasing has a negligible influence on the plasma due to the low electrode current level [8]. However, after introducing a small emissive electrode, the efficiency of negative bias has been promoted greatly [21]. The results obtained in T-10 reveal that the initial (pre-bias) states of plasma, such as the wall condition, may have an essential influence on the improved confinement performance [9].
Recently, the experimental investigation of the interaction between mean and fluctuating shear flows has become a hot topic in biasing related research. The level of long-distance correlation (LDC) structures in a potential fluctuation, which behaves in a similar way to zonal flows, was observed to be amplified under positive bias on tokamaks [22–24] and stellarators [14, 15]. Further studies showed that the LDC strength is sensitive to the polarity of the bias [23] as well as the magnetic perturbation of plasma, and reduces at a high-density level [25].
A newly designed electrode biasing system (EBS) has been constructed and performed experimentally in the J-TEXT tokamak recently. The influence of both positive and negative bias on global and plasma-edge parameters has been comparatively studied in this paper. The improvement of global particle confinement and the suppression of plasma-edge turbulent particle transport are clearly observed under bias with both polarities. The behavior of potential fluctuation is found to be sensitive to the polarity of bias. The poloidal correlation length of turbulence is increased greatly under bias; it shows a positive correlation with the amplitude of the poloidal phase velocity, which is mainly driven by the local Jr × B torque induced by the biasing. Moreover, some characteristic parameters of the blob, including the amplitude, radial velocity, related particle flux and radial size are dramatically decreased under bias.
The rest of the paper is arranged as follows: the electrode biasing system and the Langmuir probe (LP) diagnostic are introduced in section 2, the main data analysis methods used are described in section 3, the experimental results including the biasing influence on global confinement and plasma-edge parameters are illustrated in section 4, discussions about common and different characteristics of plasma responses to positive and negative bias are presented in section 5 and finally a conclusion is given in section 6.
2. Experimental setup
An electrode biasing system (EBS) has been designed and constructed on J-TEXT, which is a conventional circular cross-section tokomak [26] with a major radius of 105 cm and a minor radius of 26.5 cm. To reduce the influence on the plasma, the system is designed to contain a pneumatic driving part; thus the electrode can reciprocate in a single discharge. The front face of the electrode can reach about 5 cm inside the limiter (r ∼ 21.5 cm) by an innermost insertion. The bias voltage applied on the electrode with respect to the vacuum chamber wall is provided by a power supply consisting mainly of a capacitor bank. According to the parameters of the power supply, the available range of bias voltage is −400 to +400 V. A current-limiting protection module is added to keep the electrode current drawn under the level of 200 A, which is adjustable according to the practical situations. The signals of electrode current Ibias and voltage Ubias were obtained through the sensors installed near the EBS and acquired with a frequency of 500 kHz. The schematic of the EBS is shown in figure 1(a).

Figure 1. Schematics of (a) the electrode bias system (EBS), (b) the Langmuir four-tip probe array and (c) the arrangement of the LP system and EBS.
Download figure:
Standard image High-resolution imageThe preliminary biasing experiments were executed in hydrogen discharges with a limiter configuration. The discharge parameters were set as follows: the plasma current Ip = 120 kA, the toroidal magnetic field Bt = 1.8 T and the central line-averaged density 〈ne〉 = (1.5–2.2) × 1019 m−3. During a discharge, a disk shaped (1 cm thick and 4 cm in diameter) electrode head, which is made of hard graphite, was inserted radially into the plasma through a top port of the tokamak and reached the position r = 22.5 cm (i.e. about 4 cm inside limiter). The bias voltage applied during the flat-top phase of the plasma current was in the range of −300 to 300 V for the purpose of avoiding disruption and the duration of the biasing was set as 150 ms. The corresponding volt–ampere characteristic of the biased electrode is shown in figure 2. Normally, the electrode current under negative bias is often limited by the ion saturation current, which can be calculated according to the LP theory by

Here, Cs is the sound speed and Aeff is the projection area of the electrode in the direction of the magnetic field. The local plasma parameters at the position of the electrode can be estimated approximately as follows: the plasma density ne ∼ 5 × 10¹⁸ m−3, the temperatures Ti ∼ Te ∼ 50 eV and the projection area Aeff = 800 mm2. Thus, the theoretical prediction of the ion saturation current is about 30 A, which is close to the measured electrode current under −270 V bias, as presented in figure 2.

Figure 2. Volt–ampere characteristic of biased electrode.
Download figure:
Standard image High-resolution imageA reciprocating probe system equipped with a Langmuir four-tip probe has been used to monitor the edge plasma behavior in the experiment, which covers a measuring range r = 24.5–29.5 cm. The schematic of the four-tip probe array is presented in figure 1(b), which consists of a pair of double probes (tips 1 and 3) and two single probes (tips 2 and 4). The double probes, which are aligned in the toroidal direction, are used to measure the ion saturation current Is. While the two single probes, with a poloidal separation of about 7 mm, are used to measure the floating potentials Vf1 and Vf2, respectively. The probe data are acquired with a frequency of 2 MHz. More information about the LP system can be found in [27]. In the late analysis, we find that the double probes (tips 1 and 3) are partially shadowing each other, which is due to the inclined angle between the magnetic field lines and the aligned direction of the probes being too small to avoid shadowing. However, in our opinion, the main influence of shadowing on the Is measurements is the decrease of the absolute values of Is, while the relative value as well as the fluctuating behaviors of Is should be little influenced. The arrangement of the probe tips remains unchanged under different bias conditions in the experiments, thus the results involving the Isat measurements in this paper should still be credible.
The directions of the plasma current Ip and the toroidal field Bt are the same and anticlockwise at the top view of the device. As shown in figure 1(c), both the LP system and EBS are installed on the top ports of J-TEXT at toroidal degrees of 22.5° and 45° from the limiter, respectively.
3. Data analysis methods
3.1. Correlation analysis and turbulent particle flux
The correlation analysis method is one of the most commonly used techniques in fluctuation study to estimate the coherence and cross-phase between two arbitrary stationary signals. For two given time series x(t) and y(t), the spectra of coherence and cross-phase γxy(f) and cross-phase θxy(f) are defined as


where Px(f) and Py(f) are the corresponding power spectra of signals x(t) and y(t) and Pxy(f) is their cross-power spectrum [31]. Through the coherence and cross-phase spectra, one can obtain the distribution of the correlation between the two signals as a function of the frequency. The averaged coherence γxy and phase shift θxy can be evaluated as

The particle flux Γr driven by the fluctuations of density ne and radial velocity Vr is defined as

The influence of the electron temperature Te fluctuation is ignored in our analysis, so the density fluctuation can be substituted by the fluctuation of the ion saturation current Is. The turbulent particle flux can be estimated as

That is, the turbulence-driving particle transport is determined by the fluctuation levels (i.e. root-mean-square values) of the ion saturation current Is and the poloidal electric field Eθ, as well as their coherence γIE and cross-phase θIE. The latter two terms can be calculated by equations (4) and (5), respectively.
3.2. Conditional average
Meso-scale intermittent events (i.e. blobs), which can contribute a significant portion of the turbulent transport at the plasma edge, are well embedded in the ambient turbulence. Conditional average is a useful method to separate the events, as well as their related parameters, from the ambient turbulence for detailed study [32]. By presetting a certain level of threshold, usually several times the standard deviation, those events that succeed, which satisfy the condition, are defined and orientated in the conditional signal. Then, a conditional average is obtained by windowing the target signal into slices at the corresponding time of events, which are accumulated and averaged finally as the result. If the conditional signal and the target signal are the same, it is called an auto-conditional average (ACA). Otherwise, the method is called a cross-conditional average (CCA). In our analysis, the ion saturation current Is is set as the conditional signal and the preset threshold is 2.5 times the standard deviation of the Is fluctuation. Information of the blobs, including the amplitude, radial velocity and related particle flux are obtained and analyzed with the help of ACA and CCA, as presented in section 4.2.5.
4. Experimental results
4.1. Influence on global confinement
To compare the influences on plasma behavior with different bias conditions, three typical discharges are selected, including shot #1027591 with 0 V bias, shot #1027589 with positive (+300 V) bias and shot #1027594 with negative (−300 V) bias. For convenience, the description of positive (negative) bias represents the +300 V (−300 V) bias case hereafter in this paper, unless otherwise noted. In figure 3, the evolutions of plasma parameters of these discharges are presented with three distinct colors: black, red and blue. In these discharges, the electrode was inserted to the position r = 22.5 cm (i.e. 4 cm inside the limiter) at about 0.25 s, with a bias duration of 150 ms in the interval 0.28–0.43 s. In the bias phase, the electrode current Ibias drawn under +300 V bias is in the range 60–100 A, with a slow decrease with time, which is larger than the −300 V bias case where Ibias = 20–70 A. Comparing to the case of positive bias, the variation of the plasma state is inferred to be relatively greater under a negative bias, with a greater change of the electrode current as well as the plasma parameters, including plasma density and edge Hα level. The global particle confinement is improved under both polarity bias cases. In the positive bias case, the overall increments of the central line-averaged density and the soft x-ray emission level are about 18% and 30%, respectively, while the edge Hα radiation level decreases by a factor of about 1.7. In the negative bias case, the evolution of plasma state is more complicated, with a degradation of particle confinement occurring at around 0.4 s, which is evidenced by the obvious increase of the edge Hα level and the electrode current amplitude without an increase of the central line-averaged density. The overall increments of the central line-averaged density and soft x-ray in the negative bias case are about 30% and 58%, respectively, while the edge Hα radiation level decreases by a factor of about 1.9. The trace of the reciprocating LP is shown in figure 3(f). The profiles provided below are obtained from the probe data during the inserting phase (0.33–0.37 s).

Figure 3. Evolutions of (a) plasma current, (b) electrode current, (c) central line-averaged density, (d) edge Hα radiation, (e) central line-averaged soft x-ray emission and (f) trajectory of the LP under different bias cases. The interval of bias is indicated.
Download figure:
Standard image High-resolution image4.2. Influence on plasma-edge parameters
4.2.1. Equilibrium and fluctuation profiles.
The plasma-edge equilibrium profiles of floating potential Vf and radial electric field Er are obtained under different bias conditions and presented in figure 4. The horizontal coordinates of the profiles in this paper are indicated as the difference between the radial position of reciprocating LP rprobe and the minor radius a, i.e. Δr = rprobe − a. Thus, Δr = 0 represents the position of the limiter (or the last closed flux surface), while Δr < 0 represents the plasma-edge region inside the limiter. The profiles of Vf are modified greatly according to the polarities of bias at the edge inside the limiter. Ignoring the contribution from electron temperature, the radial electric field Er can be deduced from the profile of floating potential Vf by

Here, the positive Er indicates a radially outside electric field. Comparing to the 0 V bias case, both the absolute value and shearing rate of Er are obviously increased under bias with both polarities. Under positive bias, Er reaches a maximum value about 8.6 kV m−1 at Δr = −0.2 cm. The averaged shearing rate of E × B velocity γE×B in the broad shear layer (Δr = −2.0–1.5 cm) is about 2.4 × 10⁵ s−1, which is calculated as
While under negative bias, Er reaches a minimum value about −4 kV m−1 at Δr = −0.5 cm, with the mean shearing rate in the shear layer (Δr = −2.0–1.5 cm) as 1.1 × 10⁵ s−1. Comparatively, the shearing rate for the 0 V bias case is as weak as about 0.5 × 10⁵ s−1 at the vicinity of the limiter.

Figure 4. Equilibrium profiles of (a) floating potential Vf and (b) radial electric field Er under different bias cases at the plasma edge. The vertical lines indicate the position of the limiter.
Download figure:
Standard image High-resolution imageThe modification of the fluctuations of plasma-edge parameters is found to be sensitive to the polarities of bias, especially for the floating potential Vf, as shown in figure 5. Under positive bias, the amplitude of the Vf fluctuation is increased at the range Δr = −0.8–1.0 cm, which is mainly due to the growth of the low-frequency power below 50 kHz, as revealed in the corresponding space-resolved power spectrum (see figure 6(c)) based on the short-time Fourier transform (STFT) technique. While for the negative bias case, the fluctuation of Vf is suppressed in the whole edge region, which is consistent with an obvious reduction of the spectral power density in the low-frequency range (<20 kHz), as shown in figure 6(a). The fluctuation levels of Is and poloidal electric field Eθ are all decreased under bias with both polarities, but in different degrees. The suppression of these fluctuation quantities is less effective in the range Δr = −0.5–1.0 cm under positive bias (see figures 5(b) and (c)), with a broadening of the corresponding frequency spectra, which is not clearly observed in the case of negative bias (see figures 6(d)–(i)).

Figure 5. Profiles of fluctuations for (a) floating potential Vf, (b) ion saturation current Is and (c) poloidal electric field Eθ under different bias cases. The vertical line indicates the position of the limiter.
Download figure:
Standard image High-resolution image
Figure 6. Space-resolved power spectra of Is ((a)–(c)), Vf ((d)–(f)) and Eθ ((g)–(i)) based on the STFT technique, under different bias cases. Spectra of each parameter correspond to a unified color bar which denotes the logarithm of the power density. The vertical lines indicate the position of the limiter.
Download figure:
Standard image High-resolution image4.2.2. Turbulent particle flux.
As previously introduced, the turbulence-driving particle flux, Γr, is determined by the fluctuation levels of Is and Eθ, as well as their coherence γIE and cross-phase θIE, according to equation (7) in section 3.1, under the assumption of ignoring the influence of electron temperature fluctuation. The fluctuation levels of Is and Eθ, as have been provided and discussed above, are suppressed in the whole edge region, but in different degrees for different biased polarities. At the vicinity of the limiter (Δr = −0.5–1.0 cm), the extent of the suppression on the fluctuations of Is and Eθ under positive bias is weaker compared to the negative case. Moreover, their coherent and cross-phase spectra, as presented in figures 7 and 8, also behave differently according to the polarities. Under positive bias, the coherence γIE is even strengthened inside the limiter, which is due to the enhancement of coherence in a broad-frequency range, as shown in figure 8(c). Their cross-phase θIE is kept small where the coherence is high, making the suppression on fluctuation levels as the only contributor to the reduction of turbulent particle flux in the edge under positive bias. In the negative bias case, the coherence γIE is decreased at the vicinity of the limiter, while the cross-phase related term cos(θIE) is modulated greatly inside the limiter, which decreases to become negative at Δr ∼ −2.0 cm (see figures 7(b) and 8(d)). Thus, the reduction of turbulent particle flux under negative bias is attributed to the combined role of fluctuation suppression and de-phasing at the edge region that is inside the limiter. The degree of suppression on the turbulent particle flux is relatively greater under negative bias, compared to the positive bias case (see figure 7(c)).

Figure 7. Profiles of coherence (a), cross-phase related term cos(θIE) (b) and the resulting turbulent particle flux (c) under different bias cases. The vertical line indicates the position of the limiter.
Download figure:
Standard image High-resolution image
Figure 8. Space-resolved spectra of coherence ((a)–(c)) and cross-phase ((d)–(f)) between Is and Eθ fluctuations under different bias cases. The vertical lines indicate the position of the limiter.
Download figure:
Standard image High-resolution image4.2.3. Details of potential fluctuations.
The coherent and cross-phase spectra between two floating potentials Vf1 and Vf2, which are poloidally separated by about 7 mm, are provided in figure 9. Compared to the 0 V bias case, the coherence distributions as a function of the frequency are much higher in a broad range under bias with both polarities, as shown in figures 9((a)–(c)). The high-coherence region under positive bias is relatively broader in both the space and the frequency domain than the negative bias case. The cross-phase keeps varying slowly in an approximate linear way in the region where the coherence is high (see figures 9((d)–(f))). This high-coherence behavior of the potential fluctuations could be related to the enhancement of the poloidal velocity of the local plasma, as will be discussed later.

Figure 9. Space-resolved spectra of coherence ((a)–(c)) and cross-phase ((d)–(f)) between two floating potential fluctuations with 7 mm poloidal separation, under different bias cases. The vertical lines indicate the position of the limiter.
Download figure:
Standard image High-resolution imageTo further investigate the unrevealed property of turbulence, the local wavenumber–frequency spectrum is estimated based on the two-point spectral analysis technique [28], in which the fluctuations of the two poloidally separated floating potentials, Vf1 and Vf2, are employed as the data source. Figure 10 shows the resulting wavenumber–frequency spectra S(kθ, f) obtained at Δr = −2 cm under different bias conditions. For the 0 V bias case, the spectral power density is mainly located in the low-frequency range below 30 kHz, with a broad distribution of poloidal wavenumber kθ, as shown in figure 10(b). Here, the positive kθ indicates the ion diamagnetic drift (IDD) direction, while the negative one indicates the electron diamagnetic drift (EDD) direction. Under negative bias, the spectral power density mainly locates in the negative kθ region and concentrates in a narrow space of low-frequency (<100 kHz) and small kθ (−2–0 cm−1), as presented in figure 10(a). The related dispersion relation shows a quasi-linear behavior in the ranges 0–30 and 30–100 kHz, respectively, with different slopes. The poloidal phase velocity of turbulence Vph estimated by the two-point spectral analysis technique is about 2 km s−1 towards the EDD direction. Under positive bias, the distribution of the spectral power density shows a clear turning point at around 15 kHz, as marked in figure 10(c). In the frequency range below 15 kHz, the wavenumber kθ keeps close to 0 cm−1, with the power density peaks at f ∼ 12 kHz. While in the frequency range above 15 kHz, the spectral power density locates in the positive wavenumber region in an approximately linear way, with the power density peaks at f ∼ 21 kHz. The estimated phase velocity is about 4 km s−1 towards the IDD direction. Two LFMs exist under positive bias at this position (Δr = −2 cm), with the peaked frequencies 12 kHz and 21 kHz, respectively, as shown in the cross-spectra in figure 11. The 12 kHz LFM also exists under the 0 V bias case but is absent under the negative bias case. This mode may correspond to a geodesic acoustic mode (GAM) with extremely high coherence and a near-zero cross-phase between floating potential fluctuations with a 7 mm poloidal separation. A theoretical prediction of the GAM frequency by
 [33] is 11.7 kHz with the relevant parameters on J-TEXT (major radius R = 1.05 m and local temperatures Ti ∼ Te ∼ 30 eV); this predicted frequency is rather close to the observed frequency of the LFM (∼12 kHz). The other LFM under positive bias (f ∼ 21 kHz) also shows a high-coherence behavior, with a wavenumber kθ ∼ 0.2 cm−1.
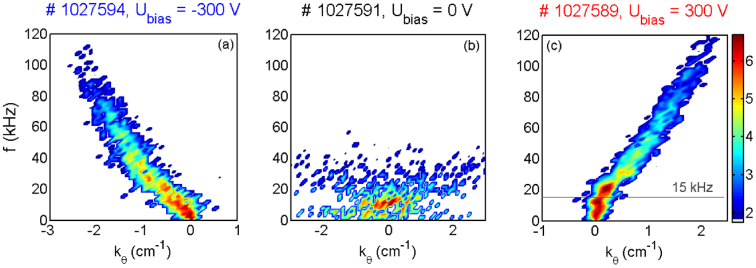
Figure 10. Frequency–wavenumber spectra S(kθ, f) estimated with two poloidally separated floating potentials at Δr = −2 cm, under different bias cases.
Download figure:
Standard image High-resolution image
Figure 11. Cross-power spectra (CPS) (a), as well as coherence (b) and cross-phase (c) spectra between two poloidally separated floating potentials at Δr = −2 cm, under different bias conditions. The LFMs are denoted in the spectra.
Download figure:
Standard image High-resolution imageThe common feature shared by the bias cases with different polarities is the tendency of a broadening of the frequency space as well as a narrowing of the wavenumber spectral width, compared with the 0 V bias case. According to [29], the narrowing of the poloidal wavenumber spectral width corresponds to the enhancement of the poloidal coherence of the turbulence. The profiles of poloidal correlation length Lcθ estimated by the two-point spectral analysis technique are given in figure 12. While the distribution of Lcθ under 0 V bias is almost flat and stays in the range 1–2 cm in the whole measured region at the plasma edge, the amplitude of the correlation length increases greatly under bias and reaches to the level of ∼8 cm and ∼10 cm for the negative and positive bias cases, respectively. The high-Lcθ region under positive bias (Δr = −2.0–1.0 cm) is relatively broader than the negative bias case (Δr = −2.0–0 cm). Compared to the 0 V bias case, the poloidal correlation length Lcθ at the plasma edge (Δr = −2 cm) is enhanced in a wide frequency region under bias (see figure 13), which is consistent with the high-coherence behavior shown in figure 9. In addition, the LFMs contribute essential roles to the large Lcθ in the low-frequency region (f < 25 kHz) under 0 V and positive bias cases.

Figure 12. Profiles of poloidal correlation length of turbulence Lcθ under different bias cases. The vertical line indicates the position of the limiter.
Download figure:
Standard image High-resolution image
Figure 13. Frequency spectra of poloidal correlation length Lcθ at Δr = −2 cm under different bias cases. The LFMs are denoted in the spectra.
Download figure:
Standard image High-resolution image4.2.4. Poloidal velocity.
The profile of poloidal phase velocity of turbulence Vph is modified greatly under bias, as shown in figure 14. Here, the positive value of the phase velocity indicates the IDD direction, while the negative value indicates the EDD direction. For the 0 V bias case, the amplitude of the phase velocity is low, varying slowly with the radius in the range −0.5–1 km s−1. While under positive bias, the poloidal phase velocity speeds up greatly towards the IDD direction and reaches to the level of 3.5–4.5 km s−1 inside the limiter. Under negative bias, the phase velocity speeds up in the EDD direction and reaches to a maximum amplitude of ∼2.5 km s−1 around Δr = −1.5 cm. The radial current Jr drawn by the biased electrode at the plasma edge may induce a Jr × B torque with a significant poloidal component, driving the local plasma to speed up poloidally. This is demonstrated by the statistical result in figure 15, which is obtained by a bias voltage scan (from −300 V to +300 V with the step-size as 100 V) and shows a positive correlation between the poloidal phase velocity Vph measured at Δr = −2 cm and the radial current Jr. Vph has a negative value (i.e. towards the EDD direction) in the absence of a radial current (Jr = 0), which is consistent with the existence of the spontaneous negative Er structure just inside the limiter in purely ohmic discharges on the device [27].

Figure 14. Profiles of poloidal phase velocity of turbulence Vph under different bias cases. The vertical line indicates the position of the limiter.
Download figure:
Standard image High-resolution image
Figure 15. Distribution of Vph measured at Δr = −2 cm as a function of radial current Jr drawn by the biased electrode, under different bias cases (scan the bias voltage from −300 V to +300 V, with the step-size as100 V).
Download figure:
Standard image High-resolution image4.2.5. Intermittent events and related transport.
The previous works show that the intermittent events, i.e. blobs, can make a significant contribution to the total turbulent particle flux in the edge of the J-TEXT tokamak with purely ohmic discharges [27, 30]. How to control the level of the events, as well as the related transport, becomes an important issue. A recent experimental work performed on a simple magnetized toroidal device, TORPEX, shows that the blobs (especially their velocities) can be controlled by the electrostatic convective cells generated by a two-dimensional array of biasing electrodes [18]. Thus, some influence of the bias on the intermittent events is expected.
In our analysis, a conditional average is used to separate the blobs and their related parameters, including the radial velocity and the turbulent particle flux, from the ambient turbulence. Using the fluctuation of ion saturation current Is as the conditional signal and 2.5 times of its standard deviation as the threshold, the results of ACA of Is, as well as the CCAs of radial velocity Vr and turbulent particle flux Γr, are shown in figure 16. Here, the turbulent particle flux Γr is estimated by equation (7) and the radial velocity Vr is calculated with:

For the convenience of comparison, several characteristic parameters of a blob are defined as follows. The blob amplitude corresponds to the difference between the maximum value and the background value, while the blob life time
 corresponds to the full width at half maximum (FWHM) of the ACA of Is (figure 16(a)). The blob related radial velocity
 and particle flux
 are estimated by the peak values of the corresponding CCAs (figures 16(b) and (c)); the radial size of the blob
 is calculated by

In addition, the statistical property of the intermittency of density fluctuation, which is characterized by the non-Gaussian probability distribution function (PDF), can be quantified as skewness (S) and kurtosis (K). The corresponding formulas are given by


Here, σ is the standard deviation of a random stationary signal x. For a Gaussian signal, the values of S and K are 0 and 3, respectively.

Figure 16. ACA of Is fluctuation (a), as well as CCAs of Vr fluctuation (b) and turbulent particle flux Γr(c), measured at Δr = −2 cm under 0 V bias.
Download figure:
Standard image High-resolution imageCompared to the 0 V bias case, the skewness of the density fluctuation is obviously suppressed under a positive bias inside the limiter, where the distribution of the kurtosis has little change, as shown in figures 17(a) and (b). Together with that, the blob related parameters, including the amplitude, radial velocity and the resulting particle flux are all decreased in the same region, as shown in figures 17(c)–(e). For the negative bias case, the distributions of skewness and kurtosis even show a little increase inside the limiter; the decreases of the blob characteristic parameters are mainly due to the suppression of the fluctuation levels of Is and Eθ. Apart from this, the out-phase between the Is and Eθ fluctuations could be another contributor to the reduction of blob related particle flux inside the limiter.

Figure 17. Profiles of skewness (a) and kurtosis (b), as well as the amplitude (c), radial velocity (d) and particle transport (e) related to blobs under different bias cases. The vertical lines indicate the position of the limiter.
Download figure:
Standard image High-resolution imageMoreover, the blob life time
and radial size
are all dramatically decreased inside the limiter under bias comparing to the 0 V bias case, as shown in figure 18. The blob life time
is about 8–12 µs under a 0 V bias inside the limiter, while it decreases to 5–8 µs and 3–4 µs under negative and positive bias cases, respectively. Along with the reduction of radial velocity
under bias, the resultant radial size of the blob
decreases by a factor of ∼2 under a negative bias and of ∼4 under a positive bias inside the limiter, compared to the 0 V bias case.

Figure 18. Profiles of blob life time
(a) and radial size
(b) under different bias cases. The vertical line indicates the position of the limiter.
Download figure:
Standard image High-resolution image5. Discussions
According to the results presented above, the responses of plasma to positive and negative bias show both common and different characteristics. The common characteristics mainly include: (1) an improvement of the global particle confinement of plasma, with an increase of the central line-averaged density and soft x-ray emission as well as a decrease of the edge Hα radiation; (2) an enhancement of the plasma-edge shearing rate of the radial electric field Er and a suppression of the plasma-edge turbulent particle transport; (3) a speed-up of the poloidal phase velocity of turbulence Vph at the plasma edge; (4) an increase of the poloidal correlation length of turbulence Lcθ and (5) a decrease of the radial size of blobs
at the plasma edge. As revealed by the statistical results in figure 19(a), the poloidal correlation length Lcθ increases with the amplitude of the poloidal phase velocity Vph. An analysis in different time scales (see figures 19(b) and (c)) show that Lcθ in large time scales (f < 25 kHz), which covers the frequency regions of LFMs, is obviously larger than that in small scales (f > 25 kHz). This is particularly obvious for the 0 V and positive bias cases where LFMs exist. On the other hand, Lcθ in both large and small time scales all increase with the amplitude of the poloidal phase velocity Vph. These results indicate the robust relationship between the increment of the poloidal phase velocity Vph and the high-coherence (or large-Lcθ) behavior of potential fluctuations in the poloidal direction observed under bias. Another statistical result in figure 20 shows that the radial size of blobs
has a negative correlation with the amplitude of the poloidal phase velocity. This may be due to the increased shearing effect on the filaments from the shear flows, which can be enhanced with a greater amplitude of the poloidal velocity.

Figure 19. Distributions of the poloidal correlation length Lcθ (a) as well as that in large time scales (f < 25 kHz) (b) and in small time scales (f > 25 kHz) (c) as functions of the absolute value of the phase velocity Vph under different bias conditions at Δr = −2 cm.
Download figure:
Standard image High-resolution image
Figure 20. Distribution of the radial size of blobs
as a function of the absolute value of the phase velocity Vph under different bias conditions at Δr = −2 cm.
Download figure:
Standard image High-resolution image
The main different characteristics of plasma responses concentrate on the potential fluctuation, the behavior of which is sensitive to the polarity of the bias. The fluctuation level of the floating potential is increased under a positive bias at the vicinity of the limiter while it is decreased under a negative bias in the whole edge region that is measured, compared to the 0 V bias case (figure 5(a)). The spectral analysis in figure 6 shows that the increase of the local potential fluctuation under a positive bias is mainly due to the growth of low-frequency spectral power below 50 kHz. Together with that, A GAM like LFM ∼12 kHz characterized as a high-coherence and near-zero cross-phase in the poloidal direction exists under a positive and 0 V bias while absent under a negative bias at the plasma edge (Δr = −2 cm); the spectral power of the LFM under a positive bias is lower than the case of a 0 V bias (figure 11). These observations may be consistent with the results in ISTTOK [23].
6. Conclusions
The experimental results provided above show that both the global particle confinement and the plasma-edge parameters can be modified under bias, with positive or negative polarity. Under negative (−300 V) bias, the electrode current drawn is lower than the positive (+300 V) bias case as expected, with a greater variation of the plasma state. The absolute value and the shearing rate of radial electric field Er are greatly promoted under bias, with broad shear layers distributed in both polarity cases. Together with that, the local fluctuations and turbulent particle flux are evidently suppressed. The suppression of turbulent particle flux is mainly due to the reduction of fluctuation levels in the positive bias case and is attributed to the combined role of fluctuation suppression and de-phasing under negative bias, at the plasma edge.
The behavior of potential fluctuation is found to be sensitive to the polarity of the bias. That is, the low-frequency power density (<50 kHz) of the potential fluctuation is increased in the edge region under a positive bias, with the existence of a peaked LFM (∼12 kHz) characterized as a high coherence and near-zero poloidal phase shift, which is not found in the negative bias case. The poloidal correlation length of the turbulence is greatly enhanced under bias and shows a positive correlation with the amplitude of the poloidal phase velocity, which is mainly driven by the poloidal component of Jr × B torque in the bias phase. In addition, the influence of bias on the intermittent events (i.e. blobs) and related transport is studied. The intermittency of the density fluctuation, which is quantified by the statistical parameters (i.e. skewness and kurtosis), is evidently suppressed under a positive bias inside the limiter, with an obvious reduction of the characteristic parameters, including the amplitude, radial velocity and the related transport of the blob. While under a negative bias, the intermittency shows no suppression and the resulting reduction of the characteristic parameters of the blob is mainly due to the decrease of the fluctuation levels as well as the de-phasing between the fluctuation quantities. Compared to the 0 V bias case, the blob radial size is decreased by a factor of ∼2 and ∼4 under negative and positive bias, respectively.
Acknowledgments
The authors are grateful to Professor C X Yu and Dr L Wang for their useful discussions about the experimental results and to Mr B Rao for the help from the EBS power supply. This work is supported by the National Natural Science Foundation of China (Nos 10990214 and 11305070), the Ministry of Science and Technology (Contract Nos 2011GB109001 and 2013GB106001) and the Fundamental Research Funds for the Central Universities (Nos 2013TS062).