
Abstract
Waveguide mirrors (WGMs) possess nano-structured surfaces which can potentially provide a significant reduction in thermal noise over conventional dielectric mirrors. To avoid introducing additional phase noise from the motion of the mirror transverse to the reflected light, however, they must possess a mechanism to suppress the phase effects associated with the incident light translating across the nano-structured surface. It has been shown that with carefully chosen parameters this additional phase noise can be suppressed. We present an experimental measurement of the coupling of transverse to longitudinal displacements in such a WGM designed for 1064 nm light. We place an upper limit on the level of measured transverse to longitudinal coupling of one part in seventeen thousand with 95% confidence, representing a significant improvement over a previously measured grating mirror.
Export citation and abstract BibTeX RIS

Content from this work may be used under the terms of the Creative Commons Attribution 3.0 licence. Any further distribution of this work must maintain attribution to the author(s) and the title of the work, journal citation and DOI.
1. Introduction
Major upgrades to the worldwide network of gravitational wave detectors are currently under way. New designs for the Advanced LIGO [1], Advanced Virgo [2], KAGRA [3] and GEO-HF [4] detectors will provide unmatched ability to detect gravitational waves in the audio spectrum. At their most sensitive frequencies, these detectors are expected to be limited by Brownian thermal noise arising from the reflective coatings on the detectors' test masses [5–8]. In order to help mitigate this limitation beyond the next generation of detectors, efforts are under way to develop mirror coatings with lower thermal noise [9, 10].
In the case of Advanced LIGO, each end test mass (ETM) consists of a substrate with 19 pairs of sub-wavelength coatings which produce a transmission of 5 ppm for 1064 nm light [11]. Each layer within this stack contributes to the overall thermal noise [7, 8]. The approach taken by Levin to calculate the thermal noise of mirrors [5] shows that mechanical loss at the front surface of a mirror contributes more to the Brownian noise level than loss from an equivalent volume in the substrate. Additionally, typical coating materials tend to exhibit mechanical loss orders of magnitude higher than typical substrate materials [7, 8]. For these reasons particular attention is being given to the reduction of coating thermal noise to improve the sensitivity of future detectors.
One strategy, to be applied for example in KAGRA, is to cool the mirrors to cryogenic temperatures. While this can potentially reduce the thermal noise of the mirrors [12], the application of cryogenic mirrors requires new infrastructure, different choices of mirror substrate and coating materials and poses the challenge of heat extraction from the mirror without spoiling its seismic isolation and thermal noise performance. Efforts in the application of cryogenics are also under way to identify suitable substrate and coating materials for ET-LF, the low frequency interferometer as part of the proposed Einstein Telescope [13–16].
Apart from using different coating materials [17, 18] or different beam shapes [19–21] such as with LG33 modes [22], another potential approach is to utilise waveguide mirrors (WGMs) [23–26]. These mirrors can possess high reflectivity at a wavelength determined by their structure. In contrast to conventional dielectric mirrors, mirrors possessing waveguide coatings can exhibit high reflectivity without requiring multiple stacks [27]. A waveguide coating instead presents incident light with a periodic grating structure of high refractive index material nH on top of a substrate with low refractive index nL (see figure 1). Light is forced into a single reflective diffraction order, the 0th. In transmission, only the 0th and 1st diffraction orders are allowed as long as the condition in equation (1) for the grating period, p, and the light's wavelength in vacuum, λ, is fulfilled [23]. The light diffracted into the 1st order undergoes total internal reflection at the substrate boundary where it excites resonant waveguide modes. Light leaving the waveguide then contains a 180 ° phase shift with respect to the 0th order transmitted light, causing destructive interference such that most of the incident light is reflected [28].


Figure 1. Propagation of light within a waveguide mirror. The grating and waveguide layers have refractive index nH, and sit atop a substrate of refractive index nL. Blue arrows represent incident light and red arrows represent reflected light. In realisations of waveguide mirrors such as this, a thin etch-stop layer is placed between the grating and waveguide layers to assist fabrication [26].
Download figure:
Standard image High-resolution imageA recent set of calculations by Heinert et al [29] showed that a suitably optimised WGM can provide a reduction in the coating thermal noise amplitude of a factor of 10 at cryogenic temperatures compared to mirrors employed in Advanced LIGO.
Previous efforts to demonstrate grating structures as alternatives to dielectric mirrors have identified phase noise in the light reflected from the grating not otherwise present in dielectric mirrors [30, 31]. This effect arises from transverse motion of grating mirrors with respect to the incident light. Incident light at angle α is reflected into the mth diffraction order, exiting at angle  (see figure 2). The change in path length
  between the reflected and incident light is then

where  and
and  represent the relative optical path length of each depicted ray. The phase modulation induced in the light reflected from the WGM is proportional to Fourier frequency with a 90° phase lead over the transverse motion [32]. The noise added to the reflected light can be enough to mitigate the improvement in coating thermal noise, as witnessed in a study of 2nd order Littrow gratings [32]. Although WGMs also possess gratings, the resonant waveguide structure has been shown in simulations by Brown et al to be invariant to transverse to longitudinal coupling [33].

Figure 2. Optical path length changes  and
and  due to transverse motion of a Littrow grating. Incident light diffracted into a different order undergoes a path length change
  .
.
Download figure:
Standard image High-resolution imageThere are two mechanisms by which grating mirrors can couple transverse motion into longitudinal phase changes (see figure 3). The first is through transverse motion of the grating, which can in principle be minimised with appropriate suspension design. The second mechanism is the coupling of changes in the opposite cavity mirror's alignment into the spot position on the grating mirror. This effect is of particular importance to gravitational wave observatories, where longer arm lengths can increase its detrimental impact. For this reason the second mechanism is considered in more detail in this work.

Figure 3. Two ways in which light can be scanned across the surface of the WGM. The left panel shows the effect of WGM motion with respect to a static beam, while the right panel shows the effect of light beam motion (due to rotation of the cavity mirror opposite the WGM) with respect to a static WGM. The latter effect is the one primarily considered in this article.
Download figure:
Standard image High-resolution imageIn order to quantify its transverse coupling, a WGM was produced in collaboration with Friedrich–Schiller University Jena, Germany (see table 1 for its properties). It was designed for light of wavelength 1064 nm, and consisted of an etched grating structure on top of a waveguide layer, both tantala, on a silica substrate. This article details an experiment carried out to measure its transverse coupling level.
Table 1. Design parameters of the WGM produced by Friedrich-Schiller Jena for the experiment to measure transverse to longitudinal coupling. It is similar to the one used in [26], with increased reflective surface area.
| Parameter | Value |
|---|---|
| Materials | SiO2, Ta2O5, |
| Al2O3 | |
| Design λ | 1064 nm |
| Grating depth | 390 nm |
| Waveguide depth | 80 nm |
| Etch stop depth | 20 nm |
| Grating period | 688 nm |
| Fill factor | 0.38 |
| Reflectivity | 96% |
2. Experiment
The fabricated WGM was used as the input coupler for a Fabry–Pérot cavity, held on resonance using the Pound–Drever–Hall (PDH) technique [34]. The error signal provided by the PDH technique represents changes in cavity length, and this can be fed back to the laser's frequency via a frequency stabilisation servo.
2.1. Cavity length signals
A non-zero WGM transverse to longitudinal coupling,  , produces a phase shift on the reflected light. This manifests itself as an effective change in cavity length,
  , as the laser light is scanned across its grooves by a rotation of the ETM:

where θ is the ETM's rotation angle and κ is the cavity's coefficient of ETM rotation to transverse WGM spot motion.
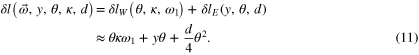
Additional cavity length changes are also produced via two geometrical effects (see figure 4). The first effect,  , is due to the position of the beam with respect to the centre of the mirror's surface. For a rotation θ, a beam offset from the centre of the mirror by a displacement y will receive a change in (longitudinal) path length of

for small angles. The second effect,  , is due to the depth d of the mirror, proportional to the rotation angle θ. The position of the centre of the mirror with respect to the zero rotation case, yd, is then

and the change in path length this causes is

The total longitudinal effect  caused by the rotation of the ETM is therefore


Figure 4. Geometrical ETM longitudinal effects. For a given rotation θ and spot centre position offset y, the (longitudinal) position change in the surface of the mirror (shown in blue) as seen by the reflected light is approximately  . The straight, solid red line in the figure shows this longitudinal change.
Download figure:
Standard image High-resolution imageConsidering the ETM's level of rotation and its dimensions and mass, it is possible to calculate the cavity length change due to the two geometrical effects shown in equation (7) and then, from the residual cavity length change, infer the WGM's coupling level. The phase effect associated with transverse to longitudinal coupling is expected to be independent of spot position, whereas there is a phase change about the ETM's centre of rotation. It is therefore expected that a spot position will exist, for a non-zero WGM transverse coupling level, offset from the ETM's centre of rotation, for which there is a cavity error signal minimum. This effect arises as a result of  and
and  combining coherently (see figure 5). The spot position corresponding to the cavity error signal minimum allows the WGM's transverse to longitudinal coupling level to be inferred.

Figure 5. Simulations of indicative cavity longitudinal error signals during ETM rotation for different levels of WGM coupling. The signals are functions of the transverse position of the reflected light relative to the ETM's centre of rotation, the angle of rotation, the mirror depth and the WGM's coupling level. The rotation to longitudinal coupling of the ETM (black dashed line) combines with the transverse to longitudinal coupling of the WGM (red, green and blue dashed lines) to produce cavity length changes (red, green and blue solid lines). In this example configuration, the ETM rotation is 1 × 10⁻⁷ rad, the ETM's depth is 0.1 m and the corresponding WGM coupling levels are 1:370 (red), 1:3700 (green) and 1:37000 (blue).
Download figure:
Standard image High-resolution imageExamples of WGM coupling levels yielding cavity length changes smaller than (blue), larger than (red) and roughly equivalent to (green) the ETM's effects are shown in figure 5. For cases where the WGM's coupling level yields a significant cavity length change with respect to that of the ETM's rotation, coherent combination creates a trough offset from the ETM's centre of rotation.
2.2. The Glasgow 10 m prototype
The Glasgow 10 m prototype facility provided a test bed in which the WGM's transverse to longitudinal coupling could be quantified. The prototype is housed in a Class 1000 clean room and consists of an input bench at atmospheric pressure and a vacuum envelope able to reach pressures of order 10−5 mBar. The envelope consists of nine 1 m diameter steel tanks, each connected by steel tubes, arranged into two parallel arms of length 10 m, with a shorter arm for input optics situated between them.
In the experiment, 1064 nm laser light was passed through a single-mode fibre to provide spatial filtering and an electro-optic modulator (EOM) to impose RF sidebands on the light to facilitate PDH control. The light was then coupled into the vacuum system via a periscope. This configuration can be viewed in figure 6.

Figure 6. The experimental setup in the prototype facility. The laser light is passed through input optics (not shown), a mode cleaning fibre and an EOM before being coupled into the vacuum system via a periscope. It then travels to tank 2 where it is reflected off a beam splitter and directed into one of the arms of the prototype by a steering mirror in tank 3. The two cavity mirrors in tanks 4 and 5 form a Fabry–Pérot cavity. The cavity mirrors are suspended from triple stage suspensions, and the beam splitter and steering mirror are both suspended from double suspensions. The ETM is rotated in yaw using the 70 Hz source. It is fed to a coil driver where it is coupled into tank 5 via a vacuum feedthrough. Coil formers on the front edges of the reaction mass contain wound copper wire connected to the vacuum feedthrough. Magnets are attached to the back of the ETM. The reaction mass is behind the ETM, containing a hole in its centre to allow light to exit the vacuum tank where it can be viewed with the CCD camera. A larger version of the contents of tank 5 can be viewed in the panel to the right of the figure. The cavity is held on resonance by the frequency stabilisation servo. This feeds back to the light's frequency via the laser crystal's temperature below 12 Hz and its PZT above 12 Hz up to a unity gain frequency of 14 kHz.
Download figure:
Standard image High-resolution imageTanks 2 and 3 housed a beam splitter and steering mirror, respectively, attached to double stage suspensions. In tanks 4 and 5 were sets of two triple suspension chains based on the GEO-600 design [35]. A viewport present to the rear of tank 5, and to the side of tank 1, allowed for light to exit the vacuum envelope for the purposes of sensing and control.
The WGM was attached to an aluminium block of mass 2.7 kg and suspended from tank 4's cascaded (triple) pendulum, forming the cavity's ITM. A silica test mass, also 2.7 kg, with a 40 ppm transmission coating, was used as the ETM, suspended from a similar triple pendulum in tank 5. On the rear surface of the ETM were three magnets for the purpose of actuation, the positions of which are shown in figure 7. With optimal alignment the mirrors formed an overcoupled cavity with finesse 155.

Figure 7. The positions of the magnets on the rear surface of the ETM. The magnet designations used in this article are shown in red text. The top magnet is positioned at the centre of yaw, near the top of the mass. The left and right magnets are positioned 56.3 mm either side of the centre of yaw. Coils on the ETM's reaction mass (not shown) are positioned coaxially behind each magnet.
Download figure:
Standard image High-resolution imageA three-stage reaction chain was placed behind the triple pendulum of the ETM to provide voice coil actuation upon the magnets on the ETM's rear surface. The upper and intermediate stages were identical to those of the chain carrying the ETM, however—for the purposes of another experiment, not reported here—the lower stage was split into two parts separately suspended from the intermediate stage. The part closer to the ETM was a 1.8 kg aluminium block that carried the voice coils. The other part was a 0.9 kg aluminium block required to balance the suspension.
2.3. Measuring cavity length changes
An RF photodetector was placed at the viewport on tank 1, where it could view the light reflected from the cavity. By using PDH demodulation, the signal from this photodetector provided an error signal for the cavity length. This signal was fed back to the laser via the frequency stabilisation servo to maintain cavity resonance. The frequency stabilisation servo's high frequency feedback signal—a voltage applied across the laser's piezoelectric transducer (PZT)—provided a means of calibrating cavity length changes at frequencies greater than 12 Hz. Using the PZT's frequency response, 1.35 MHz/Vrms, the cavity length change  per error signal volt could be calculated to be 133 nm/Vpeak.
3. Measurements and analysis
From the orientation of the WGM's gratings, it was expected that actuation of the ETM in yaw, which would scan the cavity light across the WGM's surface transverse to the direction of its grooves, would exhibit WGM transverse to longitudinal coupling if present.
For the purposes of actuation upon the ETM, two sinusoidal signals VL and VR (corresponding to the left and right voice coils on the ETM's reaction mass, respectively) were produced using separate, phase locked signal generators. A signal frequency of 70 Hz was chosen so as to be above the suspensions' pole frequencies but low enough to provide an adequate signal-to-noise ratio. The signals VL and VR, with suitable balancing (see below), could then be actuated in- or out-of-phase to produce longitudinal or yaw actuation upon the ETM, respectively.
When VL and VR were identical in magnitude but out-of-phase, the ETM's movement contained a linear combination of rotational and longitudinal components due to force imbalances between the voice coils. To ensure that actuation upon the ETM contained only a yaw component, the cavity's longitudinal error signal was minimised during out-of-phase actuation by changing the gain of VL. This balanced the magnitude of the torque applied by each actuator to the left and right sides of the ETM. Any WGM transverse to longitudinal coupling present would act with phase orthogonal to this voice coil actuation and would thus be unchanged by the torque balancing.
Pitch actuation upon the ETM, which would scan the cavity light in a direction parallel to the WGM's grooves, was not expected to contribute to the cavity's error signal via the WGM's coupling. However, unintended pitch actuation upon the ETM would couple into the cavity's length via the same geometrical mechanism as yaw shown in equation (7). To minimise the ETM's pitch component during actuation in yaw, the cavity's error signal was minimised by applying an offset voltage to the top coil. In practice, minimal pitch coupling was achieved when the offset signal was zero.
3.1. Actuator calibration
To calibrate the cavity's longitudinal response to voice coil actuation, the voice coils were actuated with the balanced VL and VR signals in-phase at a frequency f = 70 Hz for a period of 120 s. This, along with the ETM's mass m, could then be used to obtain the force applied to the ETM by the voice coils:

3.2. Measurement of WGM transverse to longitudinal coupling
Four spot positions corresponding to y in equation (4) were chosen across the surface of the ETM. The input beam was aligned to the cavity axis corresponding to each spot position using the beam splitter and steering mirror nearest to the ITM, and the cavity mirrors were aligned to create a fundamental mode resonance. The voice coil signals VL and VR were set out-of-phase to produce motion on the ETM in yaw. The magnitudes of VL and VR were not altered between the longitudinal calibration and this yaw actuation, so it was expected that the previously outlined minimisation of yaw to tilt actuation would also result in minimal longitudinal to tilt actuation. The cavity length signal was recorded for a period of 300 s.
For each nominal spot position an additional measurement was taken with VL set to ± 0.1 V from its balanced setting for a period of 60 s. This allowed two additional data points to be obtained for each spot position. By calculating the gradient (cavity length change per spot position with respect to the centre of yaw) of the central and inner-left spot positions, it was possible to assign an effective spot position for each of the offset points.
Table 2. Cavity parameters.
| Parameter | Description |
|---|---|
| Cavity input power | Approx. 150 mW |
| ETM transmissivity | 40 ppm |
| ETM radius of curvature | 15 m |
| ETM spot size | 2.138 mm |
| ITM transmissivity | 4% |
| ITM radius of curvature |

|
| ITM spot size | 1.554 mm |
| Cavity length | 9.81 m |
| Cavity finesse | 155 |
| Cavity g-factor | 0.347 |
| Beam waist size | 1.554 mm |
| Beam waist position | At ITM |
| Sideband frequency | 10 MHz |
The spot positions used to obtain cavity error signals are shown in table 3. These positions are shown with respect to the centre of the ETM's reflective surface. The spot positions were subject to two sources of error: the measurement of the spot positions with respect to the centre, and the error in the ETM's centre of rotation due to misalignment between the voice coils and their corresponding magnets. The spot position error was assumed to be ±1 mm from visual inspection of the suspensions, measured via the CCD camera placed in transmission of the ETM, using the known width of the ETM's reaction mass as a calibration. The error in the spot position measurements dominated the error in voice coil alignment. Although misaligned voice coils could have lead to a change in the expected ETM force coupling (leading to a change in the centre of rotation of the ETM), it was found from separate measurements that the effect of any possible misalignment during the experiment could only account for a drop in force of 0.11%. This contributed a negligible error (±0.03 mm) to the results.
Table 3. Spot positions on the ETM for the far left, inner left, central and right positions, respectively. The positions are shown in groups of three corresponding to the offset applied to VL. All spot positions have an error of ±1 mm.
| Spot position (mm) | ||
|---|---|---|
| −0.1V | 0.0V | +0.1V |
| −12.9 | −12.5 | −12.1 |
| −5.4 | −5.0 | −4.6 |
| −0.4 | 0.0 | 0.4 |
| 12.1 | 12.5 | 12.9 |
Knowledge of the distance of the ETM's voice coils from the centre of rotation, yc; the ETM's moment of inertia, I; the coil driving frequency, f; and the force calibration from equation (8) allowed the rotation angle to be obtained geometrically using the relation

The numerical simulation tool FINESSE [36] was then used to calculate κ for the cavity parameters shown in table 2. This was determined to be 18.5 m rad−1. The WGM's transverse displacement was then the product of κ and θ.
3.3. Analysis of the coupling level
Using the known contribution to the cavity length signal from the rotation of the ETM,  , and the cavity length signals
  measured during the experiment, the WGM's coupling level could be calculated statistically using Bayes' theorem. For this experiment, Bayes' theorem can be expressed mathematically as:

where  is the probability density distribution of the experimental parameters,
  , given the observed data,
  (the posterior);
  is the likelihood and
  is the probability distribution of the experimental parameters. The observed data
  are the measured cavity error signals for each of the spot positions.
In this analysis we are primarily interested in estimates of the model parameters. We are therefore free to ignore the constant evidence factor  present in Bayes' theorem when calculating the posterior. In the future it may be of interest to compare different models for the coupling level (or lack thereof), in which case the evidence could be calculated to obtain a model odds ratio.
3.3.1. Model and parameters
To obtain a posterior for the WGM's coupling level, it was necessary to build a model and state prior belief of the parameters' probability distributions.
In the model, the ETM's geometrical longitudinal effect at arbitrary spot position y (equation (7)) for the rotation and mirror depth used in the experiment was combined coherently with a specified level of WGM transverse to longitudinal coupling,  . It was then possible to predict the total change in cavity length
  as a function of spot position y, given the fixed parameters θ, κ and d, using equations (3) and (7):
The effect of beam smearing was also considered. The suspended optics contain residual displacement noise, leading to a broadening of the trough at which the ETM's longitudinal coupling and any WGM coupling cancel (see figure 5). To model this effect, the assumption was made that the motion of the spots on the ETM followed a Gaussian distribution about their nominally measured position. Eight-hundred small 'offset distances'  were applied uniformly to the spot positions, drawn from a randomly generated Gaussian distribution. The number of offset distances was chosen as a compromise between adequate statistical significance and technical constraints. Calculating the cavity length change as a function of spot position for each of these offset positions, and combining them in an uncorrelated sum, allowed an average, 'smeared' signal to be modelled which more closely resembled the measurements. The standard deviation of the Gaussian distribution was an additional parameter,
  , provided as an input to the model.
The summing of signals introduced by the modelling of beam smearing led to an artificial increase in the magnitude of the model's predicted cavity length signals. To compensate for this effect, a further parameter was introduced: a multiplicative scaling factor,  , applied uniformly to the model. This factor also had the additional effect of compensating for the uncertainty in the calibrated cavity length signals. By marginalising over a suitable distribution of scaling factors, it was possible to account for this uncertainty in the analysis of the WGM's coupling level. The model used in the analysis to predict the smeared, scaled cavity length change,
  , was then:

where  is the ith offset distance, drawn from a Gaussian distribution with standard deviation
  .
.
3.3.2. Likelihood
The likelihood function assumed for the model was a Gaussian distribution,

where N is the number of spot positions and  is the (identical) variance of each of the measured spot positions.
3.3.3. Priors
Bayes' theorem requires an assumption of probability distributions (priors) for each of the free parameters prior to the consideration of the measured data. The assumptions made for each free parameter in the model can be found in table 4. The upper bound on coupling was assumed to be a factor 10 better than the grating mirror measured in [32], given the indication from [33] that no coupling is present. The bounds on the scaling factor and spot smearing standard deviation were chosen from earlier observations of the behaviour of the signals during the experiment. All priors were assumed to be uniform.
Table 4. The distributions assumed for each of the free parameters in the model, along with their dimensions, prior to the computation of the posterior.
| Parameter | Symbol | Distribution | Dimensions |
|---|---|---|---|
| WGM transverse to longitudinal coupling |

|
Uniform, ![$\left[0,\frac{1}{1000}\right]$](https://content.cld.iop.org/journals/0264-9381/32/17/175005/revision1/cqg517453ieqn37.gif)
|

|
| Spot smearing noise standard deviation |

|
Uniform, ![$\left[0,3\times {10}^{-3}\right]$](https://content.cld.iop.org/journals/0264-9381/32/17/175005/revision1/cqg517453ieqn40.gif)
|

|
| Calibration scaling |

|
Uniform, ![$\left[0,\frac{1}{10}\right]$](https://content.cld.iop.org/journals/0264-9381/32/17/175005/revision1/cqg517453ieqn43.gif)
|
3.3.4. Algorithm
A form4 of the Metropolis-Hastings Markov-Chain Monte-Carlo (MCMC) algorithm [37] was applied to the model to marginalise over the three parameters. The outputs of the MCMC are a chain of samples (values at each parameter) that are drawn from the posterior distribution. A histogram of samples for a given parameter gives the marginal posterior distribution for that parameter from which the mean and standard deviation can be calculated.
To ensure the convergence of the MCMC on the posterior, a 'burn-in' period of 100000 iterations was performed. The convergence was verified manually following completion. A further 100000 iterations were then used to sample from the posterior and this second set is the one that we used for our results.
4. Results
From the parameter marginalisation it was possible to produce a posterior probability density distribution for the coupling level as shown in figure 8. The coupling level predicted from the distribution is bounded between 0 and 1:17000 with 95% confidence, with a mean coupling level of 1:27600. The probability density distributions for the scaling and standard deviation parameters are shown in figure 9. The scaling posterior distribution indicates a mean value of 29.3 × 10⁻³ with standard deviation 0.94 × 10⁻³. The posterior distribution for the beam smearing parameter indicates a range of possible values between 0 and 1.3 × 10⁻³ m.

Figure 8. Posterior probability density distribution of WGM coupling levels (in units of meters longitudinal per metre transverse) yielded by statistical analysis of the data. The red shaded region shows the coupling levels falling within the most probable 95% of the distribution.
Download figure:
Standard image High-resolution image
Figure 9. Posterior probability density distribution of other parameters used in the analysis: scaling applied to the model's predicted longitudinal signal (left plot) and the standard deviation assumed for the Gaussian distribution used to model beam smearing (right plot). Both distributions lie well within their prior ranges (see table 4).
Download figure:
Standard image High-resolution imageThe measured cavity length signals as well as the 95% upper limit and mean WGM coupling level predicted by the analysis are shown in figure 10. The phase discrepancy between the model and the measurements, as witnessed in this figure most profoundly for the spot positions around −5 × 10⁻³ m, is thought to be an artefact from the modelling of the beam smearing effect. The residual test mass motion that motivated the inclusion in the model of beam smearing may have contained some non-Gaussian behaviour.

Figure 10. Measurements and simulations of the cavity length signal for spot positions with respect to the ETM's centre of yaw. The calibrated cavity length change per radian (vertical axis) from the measurements is shown (blue stars) alongside the model's simulated cavity length changes per radian for the mean (red), 95% upper limit (green) and zero (black) WGM coupling levels. The simulated plots use a scaling factor of 29.3 × 10⁻³ and a beam smearing standard deviation of 0.8 × 10⁻³ m. Error bars are shown on the measured spot positions corresponding to their uncertainty. The errors in cavity length change are obtained from the noise floor surrounding each measurement. The noise floors were approximately constant for all measurements, with mean value 0.8 × 10⁻⁵ m rad−1. Phase error bars are visible for the central values. The errors on each phase measurement, from left to right, are: ±0.0188, ±0.0254, ±0.0283, ±0.1387, ±0.1721, ±0.2178, ±3.2726, ±3.2303, ±2.0603, ±0.0385, ±0.0342 and ±0.0336°.
Download figure:
Standard image High-resolution image
The upper limit on the predicted coupling level, 1:17000, represents a significant improvement over previously measured grating designs such as the 2nd order Littrow grating measured in [32], where the coupling factor was of order 1:100.
Acknowledgments
The authors would like to thank members of the LIGO Scientific Collaboration for fruitful discussions. The Glasgow authors are grateful for the support from the Science and Technologies Facility Council (STFC) under grant number ST/L000946/1. The Jena authors are grateful for the support from the Deutsche Forschungsgemeinschaft under project Sonderforschungsbereich Transregio 7.
Footnotes
- 4
'Yet Another Matlab MCMC Code' by Matthew Pitkin. Available as of time of writing at https://github.com/mattpitkin/yamm.