

Abstract
The behaviour of confined liquids on board an orbiting spacecraft is mainly driven by surface tension phenomena, which cause an apparently anomalous response of the liquid when compared with the behaviour that can be observed on an Earth laboratory provided that the amount of liquid is high enough. The reason is that in an orbiting spacecraft the different inertial forces acting on the bulk of the liquid are almost zero, causing thus capillary forces to be the dominant ones. Of course, since gravity forces are proportional to the liquid volume, whereas surface tension forces are proportional to the liquid surface, there are situations on Earth where capillarity can be the dominant effect, as it happens when very small volume liquid samples are considered. However, work with small size samples may require the use of sophisticated optical devices. Leaving aside the neutral buoyancy technique, a way of handling large liquid interfaces is by using drop towers, where the sample falls subjected to the action of Earth's gravity. This approach is suitable when the characteristic time of the problem under consideration is much smaller than the drop time. In this work the transformation of an out-of-use chimney into a drop tower is presented. Because of the miniaturization, hardiness and low cost of current electronic devices, a drop tower can be used as an inexpensive tool for undergraduate students to experimentally analyse a large variety of surface tension driven phenomena.
Export citation and abstract BibTeX RIS
1. Introduction
Surface tension driven phenomena naturally appear in many natural and industrial processes where fluid interfaces, either gas–liquid or liquid–liquid, are involved. The huge amount of fluid mechanic problems that can arise when interfaces are considered has focussed the attention of many scientists for more than two centuries. However, the interest on such surface tension driven flows has notably increased in recent decades due to the introduction of new mathematical tools together with the possibility of solving the problems under consideration by numerical methods. Besides, implementation of new experimental techniques has allowed scientists and researchers the possibility of checking the accuracy of theoretical predictions.
There is another remarkable interest in surface tension flows associated with the use of confined liquids in spacecraft, as the position of liquid–gas interfaces are not well defined under low gravity conditions.
On the Earth's surface, since gravity is normally the dominant force, capillarity effects are mainly confined to small regions of the gas–liquid–solid domain (wetting). However, under the weightlessness (or almost weightlessness) conditions existing on an orbiting spacecraft, surface tension effects can be dominant. Therefore, it can be said that the behaviour of fluids in space is driven by surface tension forces (which must be taken into account even in large fluid systems), making fluid behaviour more difficult to predict than under normal gravity conditions (i.e., on the Earth's surface). According to the aforesaid, it should be mentioned that new challenges appear when handling liquids on board spacecraft, which are not usually present in terrestrial environments where the effects of surface tension are often negligible.
Fluid behaviour in low gravity is strongly influenced by the container geometry and even small changes in the storage conditions may have drastic effects. For example, when transferring fluid from one tank to another one on an Earth-based facility, it is a standard procedure to fill the tank from the bottom and vent out gas from the top. In space, spontaneous capillary driven flows may locate fluid over the vent, thereby venting valuable fuel out of the tank instead of gas. Other routine processes on Earth such as mass gauging, liquid acquisition, and even storage become more difficult in a low gravity environment. In space activities fluid management can be critical; a typical example being the Atlas Centaur flight AC-4, which tumbled out of control due to inadequate settling of liquid hydrogen during venting [1].
Capillarity refers to surface tension driven phenomena appearing at fluid–fluid or fluid–solid interfaces. It is a macromolecular description of the different molecular forces acting between fluid molecules located at the interface with either another fluid or a solid.
Molecules in a liquid attract one another. Therefore, a molecule in a liquid is attracted by the other molecules surrounding it, and as a result, on average, a molecule in the bulk of the fluid does not experience any resultant force. This situation is not valid in the case of a molecule at or near the surface of a liquid, because there the forces of attraction are no longer balanced, and the molecule experiences a resultant force inwards. Because of this effect, the liquid tends to take up a shape having minimum surface area, in the case of a drop under microgravity conditions this would be a sphere. Microgravity conditions can be reached not only in gravity free environments, such as in spacecraft or in free falling conditions, but also in normal gravity conditions. In this case, capillary forces, which are proportional to the surface area, become dominant compared to the volume forces, which obviously are proportional to the volume, provided that the size of the liquid sample, e.g. a drop of liquid, is small enough.
In the case of a liquid in contact with a solid surface, the liquid molecules adjacent to the solid surface experience forces resulting from the interaction with the solid molecules (or atoms), in addition to the forces from other molecules in the liquid. Wettability refers to the tendency of a liquid to spread over the surface of a solid. In general, a drop of liquid placed on a surface will partially deform, producing a contact angle γ with that surface. The value of the contact angle depends on the relative magnitudes of forces of cohesion and adhesion. Cohesion refers to the tendency of the liquid phase molecules to remain together, while adhesion refers to the tendency of the liquid phase molecules to bind to the solid phase molecules (or atoms) [2].
A liquid is said to wet when the adhesive forces predominate over the forces of cohesion. The contact angle is then less than 90° (figure 1). On the other hand, when the cohesive forces predominate, the liquid is said to be non-wetting to the solid. The contact angle is then greater than 90°. Extreme examples of this behaviour are oil or mercury on glass [3].

Figure 1. Sketches of wetting and non-wetting liquids.
Download figure:
Standard image High-resolution imageThe capillary pressure jump across a fluid–fluid interface, Δp, is proportional to the surface tension, σ, and to the radius of curvature:

where R1 and R2 are the radii of curvature of the intercepts of the surface by two orthogonal planes containing the normal to the surface. R1 and R2 must be regarded as quantities with the appropriate sign, taking into account that the contribution to the equivalent pressure on the surface is directed towards the centre of curvature in each case [4].
Since the interface has zero mass, a curved interface can be in equilibrium only if the effective pressure due to surface tension is balanced by an equal and opposite difference between the pressures in the fluids on the two sides of the interface. Thus, at any point of the interface there must be a jump in the fluid pressure of magnitude given by expression (1) when passing towards the side of the surface on which the centre of curvature lies.
Studies related to surface tension driven phenomena involve a large amount of physical parameters to be accounted for. As a result of this drawback, and together with the scientific and technical interest on such kind of problems, some space agencies are promoting amongst universities and colleges different studies where gravitational effects are circumvented by using different tools and procedures [5–10], giving rise to a new field of expertise known as microgravity. Of course, this field of expertise is extremely broad, and probably from an educational point of view some constraints should be imposed in order to keep the learning effort between reasonable boundaries.
In a rough classification of surface tension driven phenomena, two different kinds of problems can be faced: those where thermal convection is the dominant aspect to be considered, and those where thermal convection does not play the main role. The label of 'pure fluid mechanical problems' could be used for the second kind of problems. In this case, since thermal surface forces vanish is conditioned by the interaction between the fluid and the solid surfaces involved, giving rise to concepts widely known such as capillarity, wettability, and similar ones [11, 12].
In the following, only experimental facilities for mechanical experimentation are considered. The reader interested in thermal problems, i.e. combustion or Marangoni convection, can find in [13, 14] excellent reviews of the literature on these topics.
A microgravity environment can be attained in any non-inertial frame in which the d'Alembert forces nearly balance the Earth's (or a planet's) gravitational acceleration. What remains may be conveniently referred to as the residual or effective gravitational acceleration; both its magnitude and direction being dependent on the instantaneous position of the elementary mass in the non-inertial frame and, in general, also on time.
A microgravity environment can be achieved, for different time durations, on any of the following platforms: satellites, orbiting space stations, rockets, aircraft, drop towers, and may be simulated, in certain cases and up to a certain extent, in ground-based laboratories by using the techniques described below.
The attainable g-levels are influenced by the absolute rotation and angular accelerations of the platform, the forces acting on it, and the non-uniformities of external force fields. Optimum conditions are achieved when the rotation of the platform is zero, when the apparatus is as close as possible to the centre of mass of the platform, and when the reaction and surface forces vanish [15].
Nominal gravitational levels and achievable durations with the aforementioned platforms are shown in figure 2.
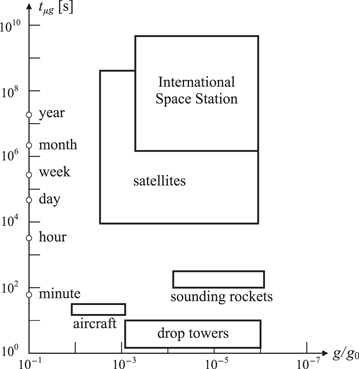
Figure 2. Nominal gravitational levels, g/g0, as a function of durations achievable, tμg , with the main available microgravity platforms [15, 17, 18].
Download figure:
Standard image High-resolution imageAmongst the dimensionless parameters used to define the mechanical properties of liquid interfaces, the Bond number, Bo = Δρal2/σ, measures the ratio of the gravitational forces to the surface tension ones. In this expression Δρ is the difference between the densities of the two fluids defining the interface, a accounts for all accelerations acting on the interface (gravitational acceleration as well as other inertial accelerations), l is a characteristic length associated to the interface geometry, and σ is the interfacial surface tension [16]. Large values of the Bond number imply that gravity forces are dominant (which is the normal situation on Earth); whereas small values of the Bond number mean that capillarity is the dominant action. Since the value of the surface tension, σ, is hard to control on an Earth-based laboratory, in this environment small values of the Bond number can only be reached by decreasing the values of the parameters in the numerator of the Bond number expression. Thus, it could be reduced by using liquids of almost the same density, Δρ → 0, giving rise to the experimental technique known as neutral buoyancy or the Plateau tank technique [19–23], by decreasing the characteristic length l by working with samples of very small size, l → 0 [24–28], or by reducing the global acceleration acting on the sample, a → 0, as it happens in space platforms, in sounding rockets and in drop towers [29–32].
All these techniques have been used at IDR/UPM, where several experimental facilities have been developed to check on Earth theoretical predictions concerning the fluid configuration known as liquid bridge [33].
Nowadays, the interest in capillary problems is still open, and a fairly large number of papers connected to the capillary rise of fluid in corners of liquid reservoirs under microgravity have been published recently [34–42], amongst others. The problem is of great interest from the scientific and technical point of view, and recently a capillary experiment has been performed on the International Space Station (ISS), which dealt with partially open channels aiming to determine the critical flow rate-limiting conditions above which the free surface collapses ingesting bubbles [43, 44].
This problem, known as corner flow, is especially appropriate to check the interaction between surface tension and gravity (or microgravity), since the liquid interface varies dramatically as the acceleration acting on the sample varies. In addition, the theoretical support needed to explain such behaviour is not too complex (see section 4). This fact makes this problem very well suited for university students with knowledge of fluid mechanics and capillarity phenomena.
Probably the most suitable experimental facilities to analyse this fluid configuration are the so-called drop towers. In sections 2 and 3, a short review of existing facilities is first presented, and a very cheap drop tower facility oriented to educational activities is described; in section 4 the experimental results obtained are presented; and in section 5 conclusions are drawn.
2. Current operational drop towers
A drop tower typically produces acceptable levels of reduced gravity, but the testing time is typically short (the maximum test time in the highest drop towers is around ten seconds). However, it is relatively inexpensive to perform tests in a drop tower, and also this kind of facility is easily accessible to researchers, allowing multiple tests to be performed at low to moderate prices. The first operative drop towers were commissioned more than five decades ago. As depicted in table 1, test times for a drop tower vary from less than 1 s to 10 s, with gravity levels of 10−4 g0 to 10−6 g0, where g0 = 9.81 m s−2. One of the main drawbacks of drop towers is the large deceleration stages present at the completion of a test (between 10 g0 and 25 g0), although most of the available electronics can withstand these high decelerations without incurring any damage. In most cases, research is often first conducted in a drop tower, at low cost, to determine if longer duration test times and more expensive facilities are warranted [45].
Table 1. Drop time, t, free fall height, h, microgravity level, g/g0, operation mode and institutions where drop towers are located.
| t [s] | h [m] | g/g0 | Operation mode | Institution | References |
|---|---|---|---|---|---|
| 5.2 | 132 | 10−5 | vacuum chamber | NASA Glenn Research Center, Cleveland, Ohio | [5, 18] |
| 4.7 |
120 | 10−6 | vacuum chamber | ZARM, Bremen | [46, 47] |
| 3.6 | 83 | 10−5 | vacuum drag-shield capsule | Drop Tower Facility of National Microgravity Laboratory of China, Beijing | [17, 48] |
| 2.2 | 24 | 10−5 | drag-shield | NASA Glenn Research Center, Cleveland, Ohio | [5, 18, 49] |
| 2.1 | 22.2 | 10−3 | drag-shield | Dryden drop tower, Portland State University | |
| 2.1 | 21 | 10−3 | drag-shield | INTA, Madrid, Spain | [31] |
| 2.0 | 23.2 | 10−5 | drag-shield | Queensland University of Technology, Brisbane, Australia | [45, 50] |
| 1.6 | 13 | 10−3 | drag-shield | IDR/UPM, Universidad Politécnica de Madrid | |
| 1.4 | 10 | 10−3 | drag-shield | National Institute of Advanced Industrial Science and Technology (AIST), Sukuba |
[51] |
| 1.3 | 10−5 | drag-shield | Purdue University, West Lafayette, Indiana | [37] |
aMicrogravity time can be extended up to 9.5 s by using a catapult system. bThis drop tower was closed in 2010. The higher drop tower (710 m high) at Japan, JAMIC, providing test time up to 10 s was closed some years ago.
Drop towers provide unique capabilities to investigate capillary flow phenomena relevant to terrestrial and space-based capillary applications, such as certain capillary rise flows that result from a combination of wetting forces and system geometry. Such flows are common in nature and industry and are particularly prevalent for small scale systems on Earth where the impact of surface tension is significant. Such flows can also dominate large length scale systems (e.g. on board spacecraft) where the relative impact of gravity is small and surface tension again controls the fluid behaviour.
3. IDR/UPM drop tower
The drop tower located at IDR/UPM has been built by using a decommissioned ventilation chimney spanning from the top flat roof of the building to the lower floor. This chimney is 17.5 m high, although due to geometrical constraints the effective height for free falling is reduced to 13.15 m (2 m are needed for the deceleration system and the drop capsule is 2.35 m high). Almost all equipment needed for the drop tower operation is located at the control room at the bottom floor.
As sketched in figure 3, the drop tower consists of the chimney (whose cross section is roughly 1 m by 1 m), the payload elevation system, the drop capsule and the deceleration device. The chimney is equipped with different CCD cameras which allow visualization of the different elements placed inside, as well as the illumination system. The payload elevation system is a winch equipped with a dc electric motor provided with the necessary control devices to move up and down the release mechanism. The winch is at the bottom of the chimney and it is connected to the release mechanism through a cable and the appropriate pulleys system. The release mechanism consists of a lock driven by a solenoid, mounted on a horizontal bar anchored to the hoist cable. To avoid the rotation of the drop capsule during the ascension phase, the extremes of the horizontal bar slide on vertical steel cables each one of them running from the top of the tower to its bottom. These steel cables are also used to supply electrical power to the release mechanism.
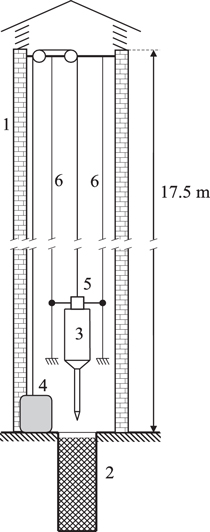
Figure 3. Sketch of the IDR/UPM drop tower. (1) Chimney, (2) sand reservoir, (3) drop capsule, (4) lift system, (5) release mechanism, (6) cable guides for the elevation process.
Download figure:
Standard image High-resolution imageBy using this system, the payload can be elevated at any height between h = 0 and h = hmax (13 m), so that the drop time is controlled through the capsule releasing height. To accurately measure the height, the drop tower is equipped with a distance measurement laser.
The drop package comprises both the drag-shield and the experiment platform. The experiment platform measures 250 mm in diameter and is 600 mm high, and is able to support an experimental apparatus weighting a maximum of 15 kg. All objects mounted on the experiment platform experience reduced gravity conditions.
At the beginning of each test, the drop package is winched to the top of the tower and suspended from the release mechanism. The release mechanism is unlocked and the experiment is released so it can free fall down to the base of the tower, where it is decelerated by a large spike that penetrates in a dry sand reservoir. During a drop, the experiment platform is enclosed within the drag-shield, as shown in figure 4. This protects the experiment against the effects of aerodynamic drag and the large deceleration forces. Excellent levels of reduced gravity can be achieved with the use of a drag-shield.
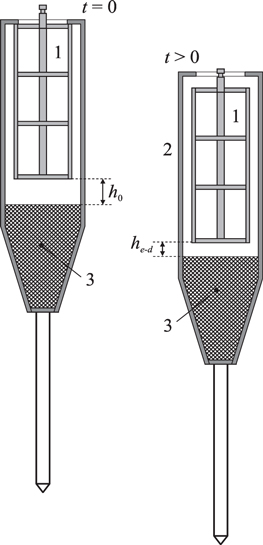
Figure 4. Sketch of the relative positions of the experiment platform (1) and the drag-shield (2) at the release instant, t = 0, and during fall, after release, t > 0. (3) represents the foam housed at the bottom of the drag-shield to damp the impact between the experiment platform and the drag-shield.
Download figure:
Standard image High-resolution imageThe experiment platform is a structure composed of four rectangular vertical bars that support four equally spaced circular trays (although other tray arrangements are also possible). Experimental devices are spread on the trays to meet the experiment specifications.
In the upper tray of the experiment platform there is a vertical bolt centred and aligned with the experiment platform axis. The bolt has a groove where a cotter pin is lodged. The cotter pin is housed in the locking mechanism and is forced to its neutral and safe position, inside the groove, by a spring. The system also includes a solenoid to move back the cotter pin, thus setting free the aforementioned vertical bolt and initiating the experiment platform descent.
The drag-shield is composed of a cylindrical shroud made of aluminium 0.5 mm thick, a truncated cone also made out of aluminium and a steel spike used to decelerate the whole payload. The cone is filled with foam as well as part of the cylindrical shroud, aiming at attenuating as much as possible the deceleration loads on the experiment platform. The spike is screwed at the bottom of the truncated cone, although it can be also directly screwed to the experiment platform, as in these tests the vertical dropping distance is small enough to disregard aerodynamic drag forces. Otherwise the drag-shield must be used. The experiment platform that sits inside the drag-shield is shorter than the available height inside this drag-shield by a distance h0. This variable, h0, is calculated from the relative motion of the aforementioned drag-shield (with drag forces acting on it) in relation to the experiment platform over the test time of 1.6 s.
According to the above reasoning, the acceleration of the drag-shield, a, is given by the gravitational acceleration g and the deceleration due to aerodynamic drag, that is

where m is the drag-shield mass, ρ is the air density, S the frontal drag-shield area and cD the drag coefficient (note that only the vertical velocity and acceleration are considered for the air drag effect).
According to expression (2), the aerodynamic drag decelerates the drag-shield until a maximum drop velocity, which is reached when the body acceleration becomes zero:

with k = ρScD /(2m). The variation of the drag-shield vertical velocity as a function of time, t, directly results from the integration of (2), which can be recast as

and then

The integration of (5) yields the vertical distance run by the drag-shield, sd ,

On the other hand, since the experiment platform that falls inside the drag-shield is slowly moving in relation to the air enclosed in the drag-shield, aerodynamic drag force can be considered negligible, so that in a first attempt, the vertical distance run by the experiment platform, se , is driven only by gravity:

And then, since se = sd + h0 (figure 5), both falling bodies will encounter when

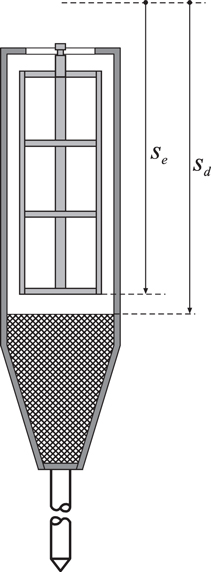
Figure 5. Magnitudes used to describe the free fall of the drop apparatus; sd is the vertical distance run by the drop shield, se the one corresponding to the experiment platform and h0 the initial distance between the two bodies.
Download figure:
Standard image High-resolution imageTypical values at the IDR/UPM drop tower are: ρ ≅ 1.2 kg m−3, A = 0.07 m2, cD = 0.7 and m = 3.8 kg, then k = 0.0078m−1.
For small values of the argument (8) can be written as

To perform an experiment, first of all the equipment required is anchored to the corresponding trays. Then, the experiment platform is vertically introduced inside the cylindrical part of the drag-shield (the diameter of the experiment platform is larger than the circular hole existing at the upper tray of the cylindrical part of the drag-shield), and both the experiment platform and cylindrical shroud are fixed to the lift device. This is achieved by introducing, by hand, the bolt existing in the upper tray of the experiment platform into the lifting mechanism, where it is locked by the cotter pin.
The whole apparatus is lifted a vertical distance enough to screw the nose cone to the cylinder, and the deceleration spike to the nose cone, and then the elevation process starts until the desired height is reached and the drop of the capsule can start. It must be pointed out that the drag-shield design is being modified to reduce the integration time. In the new design the circular hole of the upper plate of the drag-shield will be larger, to allow the experiment platform to pass through, so that the entire drag-shield, spike included, will be mounted onto the experiment platform, and it will be kept in position by three manually actuated horizontal bolts located at the upper plate of the experiment platform.
A fundamental problem that can appear in drop towers is due to the sudden transition from normal gravity to free fall. Under normal gravity both the experiment package and the drag-shield are suspended by a release device, and the equilibrium stresses are distributed through both structures. Upon release, these stresses are relieved and once equilibrium is re-established, the package is in free fall, free of any internal stresses. This process corresponds to the response of a dynamic system to a step load: the release of gravity action as a distributed body force.
However, the response to this relieving process takes a finite amount of time, and requires the dissipation of all of the stored strain energy, which normally implies the appearance of vibrations in both the experiment platform and the drag-shield, which affects the quality or duration of the reduced gravity environment that the facility was capable of generating. To address this problem the experiment platform (supporting the payload) must not be too rigid, so transferred vibrations are limited and can damp out quickly. Because of that, joints in the structure are not welded but bolted, and additionally critical members are made stiffer to increase the overall natural frequency of the framework.
4. Experimental results
When planning space-based operations, it is important to be able to predict the equilibrium locations and configurations that fluids will assume in containers under low-gravity conditions. Currently available mathematical theory applies completely, but only to a few particular configurations such as a partially filled circular cylindrical container with liquid simply covering the base. Behaviour in space for this configuration, although different from what is familiar in common experience with a terrestrial environment, is at least consistent with that experience. For more general containers, however, fluids in reduced gravity can behave in striking, unexpected ways [52].
The classical theory, according to the Young–Laplace–Gauss formulation, characterizes fluid locations as equilibrium configurations for the surface-plus-gravitational mechanical energy. Using this point of view in a mathematical study, it has been shown that for a cylindrical container of general cross-section in zero gravity the surface change arising from small changes in geometry or contact angle can lead to large shifts of the liquid mass. Attempts to observe this behaviour experimentally can be valuable as tests of validity of the concept of macroscopic contact angle used in the classical theory, and thereby of the effectiveness of this classical theory in predicting fluid behaviour (a wide historical review can be found in [53]).
The main mathematical result underlying this behaviour is that for particular cylindrical sections a discontinuous kind of change can be realized as the contact angle γ crosses a critical value γ0 intrinsic to the container. Assuming a partially wetting liquid (0 < γ < π/2), when γ is larger than γ0 there exists an equilibrium configuration of liquid that simply covers the base of the cylindrical container, while for contact angles smaller than γ0 no such equilibrium configuration is possible. In the latter case liquid moves to the walls and can rise arbitrarily high along a part of the wall [52].
The mechanism for capillary flows in interior corners is perhaps best introduced via an illustrative example. Following Weislogel and Lichter [54], in figure 6 a container with a square cross-section partially filled with a liquid in a strong gravitational field is depicted. Most of the interface is flat. However, as it is commonly observed, especially in the corner regions of the container, the interface is deformed in order to satisfy the contact angle wetting condition along the perimeter of the interface. A magnified view of the corner region shows that the local radius of curvature Ri of the meniscus decreases as the corner is approached. Since the pressure drop across the meniscus is inversely proportional to Ri it follows that a pressure gradient along the corner is established in the wetting liquid. If acceleration is suddenly decreased, the balance of this gradient with hydrostatic forces is disrupted and slender columns rise as the fluid is pumped up the corners by capillary forces [54].
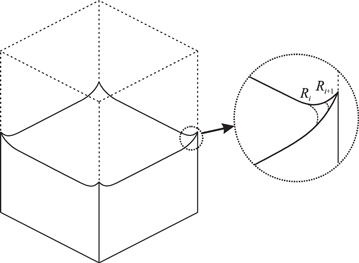
Figure 6. Partially filled square cross-section container in gravity conditions, a = g0. Reproduced with permission from [54]. © 1998 Cambridge University Press.
Download figure:
Standard image High-resolution imageSuch capillary pumping arises in numerous contexts and is particularly prevalent in low-gravity environments encompassing most, if not all, of in-space fluids management processes, including the positioning, control, and transport of liquids, such as fuels in storage tanks, thermal systems such as heat pipes and capillary pumped loops, and the storage and handling of biological fluids and wastes. Examples of terrestrial applications include flows in porous media and the wetting and spreading of fluids on irregular surfaces, flow processes which are commonplace in nature and industry.
To test the above described behaviour different experimental drops have been performed with the aim of evaluating the performance of the IDR/UPM drop tower facility though some simple experiments concerning the behaviour of confined liquids under microgravity conditions. As sketched in figure 7, the experiment platform is equipped with one small, autonomous CCD camera (recording at 25 frames per second speed) and the source of illumination, both mounted on the third tray (starting from the bottom). This third tray has a large central circular hole to allow visual communication with the second tray. The second tray holds an inclined mirror and the liquid container, a parallelepiped box made out of methacrylate whose internal dimensions are 60 mm × 60 mm × 60 mm, partially filled with water.
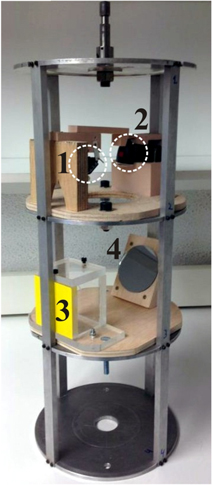
Figure 7. Sketch of the equipment housed in the experiment platform: (1) autonomous CCD camera, (2) illumination source, (3) inclined mirror and (4) liquid container.
Download figure:
Standard image High-resolution imageWater is probably not the most suitable liquid to be used in future experiments because of the variation of the value of its surface tension with free surface contamination, so that surface tension can range between the nominal value σ ≅ 0.072 N m−1 to σ ≅ 0.020 N m−1 when appropriate surfactants are added. Therefore several drops were performed by using different types of water: clean demineralized water (which does not wet methacrylate), and water coloured with a blue colour dye and with a small amount of liquid soap, to decrease the value of the surface tension (this coloured, low surface tension water wets the methacrylate inner surfaces).
The aim of these first experiments was two-fold, to check the wetting conditions in the development of the capillary rising flow known as corner flow, and to check some aspects of the drop module design, mainly those concerned with the drag-shield design. For this purpose the inner surface of the drag-shield cylinder incorporates a vertical scale which allows the determination of the relative movement between the drag-shield and the experiment platform during the drop. In addition, the vertical gap between both elements, drag-shield and experiment platform, was reduced to 70 mm, so that, according to expression (8), the experimental platform would impact with the damping foam housed inside the drag-shield around one second after release (figure 8).

Figure 8. Variation with the time, t, of the vertical distance between the experiment platform and the drag-shield, he−d , according to expression (8). Numbers on the curves indicate the value of the mass of the drag-shield. The values at t = 0 indicate the initial separation between both bodies (0.07 m and 0.21 m).
Download figure:
Standard image High-resolution imageIn the case of high surface tension (non-wetting) water, according to theoretical predictions, no corner flow was observed, whereas when wetting water was used intense corner flows were recorded.
Selected recorded images of a drop run where low surface tension, wetting water was used, are shown in figure 9. As it can be observed, while the experimental platform freely drops inside the drag-shield, the water rises in the vertical corners of the parallelepiped shaped reservoir, and the corner columns reach a height of 40 mm during the first second of free fall. After this time the experimental platform impacts with drag-shield foam and a kind of bounce occurs. Because of that, the capillary rise ceases, and since the drop movement is now driven by drag-shield displacement, which has been decelerated due to the effect of aerodynamic drag, the liquid that previously rose at the reservoir corners starts to flow down to the reservoir bottom, thickening the corner capillary columns. The liquid coming from the corners concentrates in the centre of the reservoir bottom, thus forming a liquid column which impulsively rises up to the ceiling of the parallelepiped reservoir.
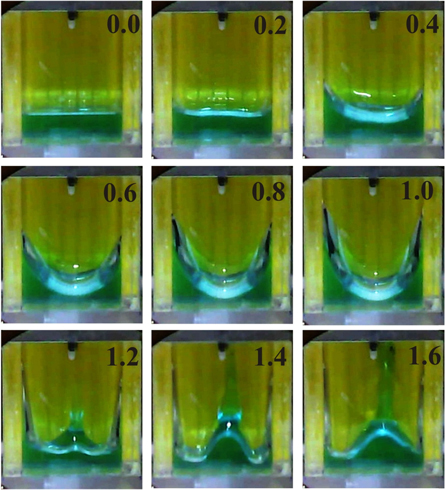
Figure 9. Selected images of the liquid interface of a wetting liquid recorded during the fall of the experiment platform. The time between two consecutive images is 0.2 s.
Download figure:
Standard image High-resolution imageNote that since the CCD camera used is an autonomous low resolution camera, the quality of the images when analysed frame by frame is a little low. In addition, according to the experience of all the experimentalists involved in the visualization of gas–liquid interfaces, the illumination of the subject to be recorded from the front is not the most appropriate choice. All these drawbacks, discovered by students in charge of the experimentation early on, are now circumvented by using a commercial photo-camera which can record video movies with high resolution, and background illumination.
The process ends suddenly when the drag-shield spike reaches the deceleration system (a cylinder filled with dry sand), and the deceleration is so high (around 22 g0) that after the impact the illumination source becomes switched off and the CCD camera misaligned.
Then the CCD camera is recovered and the video images stored in a desktop computer for further analysis. The variation with the drop time of both the height of the capillary corner columns and the vertical separation between the drag-shield and experimental platform are depicted in figure 10. It should also be pointed out that, as explained before, this vertical separation becomes zero at t ≅ 1.1 s, then increases by a small amount during the bounce and becomes zero again when the apparatus reaches the dry sand reservoir located at the bottom of the drop tower (1.6 s after release).
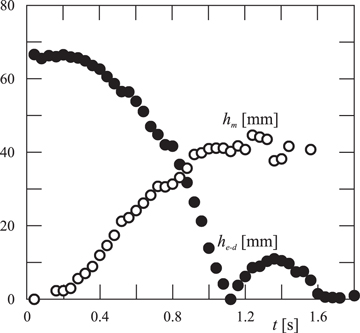
Figure 10. Variation with the falling time, t, of both the height of the liquid meniscus at the corners of the liquid container, hm , and the vertical distance between the experiment platform and the drag-shield, he−d .
Download figure:
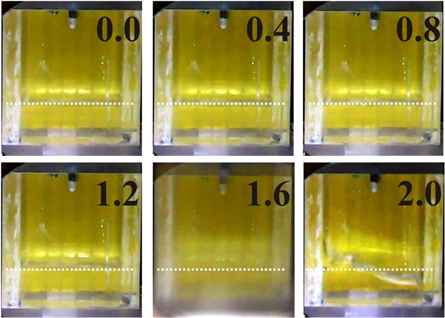
Standard image High-resolution imageTo compare the behaviour under microgravity conditions of wetting and non-wetting liquids, results obtained with a liquid without any surfactant additive are shown in figure 11. In this case the liquid is clean water, which does not wet methacrylate. To ease the interface visualization, a dashed line has been drawn on the images indicating the position at the front side of the container of the liquid interface (at rest). Images show that the liquid interface remains unaltered during all the free fall process, even when the vertical separation between the drag-shield and experimental platform becomes zero. Note that the image corresponding to 1.6 s after release is blurred because of the deceleration shock at the end of the free fall. Obviously, such large perturbation due to impact induces movement on the liquid interface after the free fall stops (the liquid interface oscillates).
Figure 11. Selected images of the liquid interface of a non-wetting liquid recorded during the fall of the experiment platform. The time between two consecutive images is 0.4 s.
Download figure:
Standard image High-resolution image
5. Conclusions
In this paper a quite simple drop tower suitable for capillary phenomena analyses is presented. Such a drop tower has been developed by using an out-of-use chimney, around 15 m high, located at IDR/UPM, Universidad Politécnica de Madrid, equipped with a lifting system, an experiment platform, where experimental apparatus is lodged, and a drag-shield needed to keep the acceleration of the experiment platform constant. Although the falling time is limited to 1.6 s, this drop tower has been used by undergraduate students to study surface tension effects on liquids under microgravity conditions, since the characteristic capillary time of low viscosity liquids is much smaller than this falling time.
One of the main advantages of the drop tower design has been the use of commercial-off-the-shelf, robust and low cost electronic devices, as well as the simplification of the operation procedures, in order to allow undergraduate students to design and operate their own experimental projects, obviously under the supervision of expert personnel.
Although for the time being the work has been focused on the tuning of the drop tower, the associated instrumentation, and the improvement of the safety conditions, some preliminary tests dealing with the so-called corner flow have been performed, the results obtained being in agreement with similar ones published by other authors.
It must be pointed out that close to the drop tower is a workshop where the users can prepare the experiment to be dropped, so that the time between two consecutive drops can be less than 30 min.
Although the drop tower is fully operative, some actions are being undertaken to improve its performance: the height of the experiment platform will be reduced to increase the distance between such a platform and the drag-shield, and a second platform is under fabrication to allow two experimental groups to work in parallel.
Besides, more sophisticated equipment has been incorporated, mainly to improve the definition of the images recorded during the free fall, and a telemetry system is being implemented.
Acknowledgment
The authors are indebted to the undergraduate students Raquel Barral and María Casas for performing the first drop tower experiments concerning the corner capillary rise in a parallelepiped shaped container. Authors are grateful to Cambridge University Press for the permission granted regarding the redrawn figure 1 from 'Capillary flow in an interior corner' by Weislogel and Lichter [54].