


ABSTRACT
Corundum is predicted to be the most abundant refractory circumstellar dust and has been suggested as a candidate emitting the 13 μm feature in infrared spectra of oxygen-rich asymptotic giant branch stars. Crystalline dust has morphologies reflecting the anisotropic crystal structure and formation conditions or processes and may emit characteristic infrared features. In this study, evaporation and condensation experiments of corundum along different crystallographic orientations were performed in vacuum to determine key kinetic parameters controlling morphological anisotropy: evaporation and condensation coefficients (αe and αc), the degrees of kinetic hindrance on evaporation and condensation. Plausible shapes of corundum condensates were estimated from the experimental results to evaluate the infrared features of corundum condensates. The evaporation coefficients of corundum are 0.02–0.2 at 1600–1785°C, which increase with temperature and show notable anisotropy. The order of αe along the crystallographic c, a, and m axes is α ≫ α > α irrespective of temperature. The obtained condensation coefficients along the c, a, and m axes at 1575°C and a supersaturation ratio of ∼4 are 0.04–0.06, 0.06–0.08, and 0.1–0.2, respectively. The morphology of condensed circumstellar corundum expected from our experiments is oblate and slightly flattened to the c axis and is consistent with the fact that no presolar corundum with eccentric shapes has been found. The mass absorption coefficient of oblate corundum slightly flattened to the c axis shows a peak at 13 μm without any accompanying strong peaks. These results strongly indicate that corundum condensed anisotropically in circumstellar environments is a carrier of the unidentified 13 μm feature around oxygen-rich evolved stars.


1. INTRODUCTION
Infrared spectroscopic observations and analyses of primitive chondrites have shown that refractory dust particles condense from high-temperature gas in various circumstellar environments such as in protoplanetary disks, extended atmospheres around asymptotic giant branch (AGB) stars, and ejecta from supernovae. Equilibrium condensation models predict that corundum (the thermodynamically stable form of Al2O3 or α-Al2O3) is one of the first condensates from a gas of solar composition (e.g., Grossman 1972; Wood & Hashimoto 1993; Ferrarotti & Gail 2002; Gail 2004; Ebel 2006). Corundum could thus serve as condensation seeds for dust grains formed at lower temperatures, such as silicates, metallic iron, and amorphous materials, and record the onset of the dust formation process in circumstellar environments. Hundreds of presolar alumina (Al2O3) grains, of which isotopic compositions are attributed to their origin in circumstellar envelopes around evolved stars, have been discovered in primitive chondrites (Huss et al. 1994; Hutcheon et al. 1994; Nittler et al. 1994, 1997, 2008; Floss & Stadermann 2009; Bose et al. 2010; Makide et al. 2009; Gyngard et al. 2010; Takigawa et al. 2014). The crystal structures of only 11 presolar alumina grains have been analyzed, and most of them were confirmed to be corundum (Stroud et al. 2004, 2007; Takigawa et al. 2014).
Comparisons between infrared spectroscopic observations and laboratory spectra of dust analogs have suggested that amorphous alumina or γ-alumina coexist with amorphous silicates around oxygen-rich evolved stars to explain the broad features centered at 11–12 μm (e.g., Little-Marenin & Price 1986; Onaka et al. 1989a, 1989b; Speck et al. 2000). Circumstellar corundum, however, has not yet been clearly confirmed in spite of its presence as presolar grains. Many evolved stars showing the amorphous alumina features also exhibit a single peak at 13 μm (13 μm features; Little-Marenin & Price 1986; Sloan et al. 1996, 2003; Sloan & Price 1998). The most plausible candidates for dust species emitting the 13 μm feature are corundum or spinel, but neither spheres nor a continuous distribution of ellipsoids (CDEs) of these candidate minerals can explain the peak position and width of the 13 μm feature (Begemann et al. 1997; Posch et al. 1999; Speck et al. 2000; Sloan et al. 2003).
Corundum belongs to the trigonal crystal system and shows anisotropy in various properties such as permittivity, thermal expansion, and elasticity. Growth, dissolution, and evaporation of crystals often proceed anisotropically and form specific crystal habits that depend on the formation processes and conditions. For instance, olivine (crystalline SiO4) evaporates anisotropically both in vacuum and in hydrogen gas, and the evaporation anisotropy depends on evaporation temperature and hydrogen pressure (Ozawa et al. 1996, 2012; Yamada et al. 2006; Takigawa et al. 2009). Takigawa & Tachibana (2012) suggested that circumstellar forsterite dust that experienced evaporation under different conditions could be distinguished by infrared spectroscopy because infrared spectral features of forsterite dust strongly depend on a crystallographically anisotropic shape, which is the anisotropic shape related to a specific crystallographic orientation. The processes that determine dust morphologies in circumstellar environments are the condensation of solid from vapor, evaporation of solid into vapor, crystallization from amorphous phases, and chemical reactions between gas and solids. Because the physical and chemical conditions of dust-forming environments change with the expansion of the atmosphere around evolved stars or the evolution of protoplanetary disks, the kinetics of dust-forming processes may control the growth morphology of dust grains.

The evaporation anisotropy of corundum in vacuum was experimentally investigated at temperatures higher than 1650°C in the field of ceramics (Pollock 1961; Sasamoto & Sata 1971; Akulenok et al. 1974), but the reported data shows significant scatter, as we discuss later. Toppani et al. (2006) performed condensation experiments from gases generated by laser ablation of glasses with various compositions (e.g., the solar and CAI compositions) and found that corundum condenses from gases with various Mg/Si and Al/Si ratios. They also showed that condensed corundum grains tend to have platelet shapes. However, there has been no experimental study to quantitatively determine the condensation kinetics of corundum and its anisotropy.
In this study, we conducted evaporation and condensation experiments of corundum in order to obtain anisotropic evaporation and condensation rates and to discuss the morphological changes of corundum dust grains in circumstellar environments due to evaporation or condensation and infrared features of circumstellar corundum condensates as a possible carrier of the 13 μm feature. The evaporation and condensation experiments and their results are described in Sections 2 and 3, respectively. The anisotropic evaporation and condensation coefficients, the parameters representing kinetic hindrances, are evaluated in Section 4. We compare the expected morphology of condensed corundum dust with that of the presolar alumina grains and discuss the infrared spectra of corundum ellipsoids with crystallographically anisotropic shapes if the 13 μm feature can be explained by corundum with the morphology reflected in its formation anisotropy in Section 4. We summarize and conclude in Section 5.
2. EXPERIMENTAL PROCEDURES
2.1. Evaporation Experiments
The lattice structure of corundum () is described with either the rhombohedral or the hexagonal lattice system. The crystal faces and axes of corundum are expressed by using the Miller indices of the hexagonal lattice system in this paper (Figure 1) because the c axis of corundum (the three-fold rotation-inversion axis) in the hexagonal lattice system is identical to one of the two optical axes, which is convenient for a discussion of optical properties. The and orientations of corundum, which are perpendicular to the {0001} and planes, correspond to the crystallographic c and a axes, respectively. The orientation, which is perpendicular to the plane, is referred to as the m axis hereafter, and the {0001}, , and planes are referred to as the c, a, and m planes, respectively. The 〈 0001 〉 * and orientations are perpendicular to each other (Figure 1).


Figure 1. Hexagonal lattice system of corundum ().

Download figure:
Standard image High-resolution imagePlates of single crystals of corundum (10 mm × 10 mm × 0.5 mm) synthesized with the Kyropoulos method (Dalian Keri Optoelectronic Technology Co.) were cut into smaller plates with c, a, and m planes ((2–10) mm × 10 mm × 0.5 mm) and used in evaporation experiments.
Evaporation experiments were conducted in a vacuum chamber made of stainless steel with a tungsten mesh heater (Takigawa et al. 2009, Figure 2). The samples with the largest surfaces of c, a, and m planes were put in the furnace together in each experiment (Figure 2). The chamber was evacuated to ∼10−4–10−5 Pa by a turbomolecular pump and a rotary pump at room temperature and heated at 500°C for 1–12 hr. After the pressure in the chamber decreased below ∼5 × 10⁻⁴ Pa, the samples were heated to 200°C below the experimental temperature at the rate of ∼200°C hr−1 and then heated to the desired temperature of 1600°C, 1675°C, or 1785°C at ∼20°C minute−1. The thermocouple was calibrated against the melting temperatures of metallic iron (1535°C) and platinum (1768°C) and a eutectic temperature of Rh–C (1657°C). The relationship between sample temperature and heater power was determined with an uncertainty of ±5°C by a molybdenum-sheathed thermocouple (WRe5–WRe26%) placed at the sample location. Because the sheath of the thermocouple also evaporates at experimental temperatures, the thermocouple was removed during the experiments, and the temperature of the furnace was controlled within ±1°C by keeping the output power of the heater constant. The samples were heated for the desired duration, ranging from 24 to 200 hr, and then rapidly cooled by turning off the heater. The sample sizes and weights are summarized with the experimental conditions in Table 3.

Figure 2. Schematic illustration of experimental setup for evaporation of corundum in vacuum. The thermocouple was removed during experiments.
Download figure:
Standard image High-resolution imageAfter the experiments, the weight losses of the samples were measured by a microbalance (±1 μg). The samples were then observed with a field emission scanning electron microscope (FE-SEM; JEOL JSM-7000F) and analyzed with energy-dispersive X-ray spectroscopy (EDS).
2.2. Condensation Experiments
Condensation experiments were conducted in another vacuum chamber with a tungsten mesh heater, the design of which is basically the same as that for the evaporation experiments (Figure 3). The chamber was evacuated using a turbomolecular pump and a rotary pump to high vacuum (∼10−4 Pa). A pellet made of alumina (α-Al2O3) powder (11.5 mm in diameter and 5 mm in thickness) was put at the bottom of an iridium crucible (15 mm in diameter and 60 mm in length) as a gas source (Figure 3). The weight of the pellet was measured before and after each experiment to obtain the evaporation flux from the pellet, and the same pellet was used throughout all of the experiments.

Figure 3. Schematic illustration of experimental setup for condensation of corundum. (a) An iridium crucible and a W mesh heater. (b) An iridium pedestal and a corundum substrate.
Download figure:
Standard image High-resolution imagePlates of a single crystal of corundum ((1–10) mm × 10 mm × 0.5 mm) with the widest {0001}, , and planes were used as substrates for condensation (C, A, and M substrates, respectively). The single-crystal plates were the same as those used in the evaporation experiments. In each experiment, one to three corundum substrates were put on an iridium pedestal set at 40 mm from the bottom of the crucible (Figure 3). The Ir crucible was put in the vacuum chamber, pre-evacuated at 500°C, and heated at a constant rate of 20°C min−1 to 1575°C (Table 4).


The temperature of the furnace was controlled by a thermocouple (TC1, WRe5–WRe26%) set near the heater (50 mm in diameter and 100 mm in length) within ±1°C during the experiments (Figure 3). In order to determine the evaporation temperature of the pellet (Tsrc) and the temperatures of the substrates (Tsbst), a vertical temperature gradient at the center of the crucible from the bottom of the crucible up to the outside of the thermal shields was measured with an R-type thermocouple (TC2, Pt–Pt13%Rh) connected to a vacuum manipulator before a series of condensation experiments (Figure 3). The temperature of TC1 was controlled at 1810°C, which gives Tsrc and Tsbst of 1705°C and 1575°C, respectively.
The mean free paths of gas molecules under the present experimental conditions are much longer than the size of the crucible. Even at such a molecular flow condition, the gas molecules from the gas-source pellet hit not only the front surface of the substrate facing the gas source but also the back and side surfaces because of conductance of the crucible (Figure 3(b)). The contribution of condensation on the back and side surfaces was evaluated by using substrates with various surface areas. Iridium ribbons were set together with corundum substrates in some experiments to examine if corundum condenses on the back surface and the surface covered with the Ir pedestal (Figure 3(b)). An experiment with an Ir wire (0.3 mm φ) hung inside the crucible (#45) was also done to confirm the onset temperature of corundum condensation in the crucible (Figure 3(a)).
The weight changes of the substrates were measured by a microbalance (±1 μg), and the condensates were observed with FE-SEM (JEOL JSM-7000F). Their chemical compositions and crystallographic orientations were determined with EDS and electron back-scattered diffraction (EBSD).
3. RESULTS
3.1. Anisotropy in Evaporation Rates of Corundum
No residual phase was found on the sample surfaces in all of the runs, and corundum evaporates congruently as predicted in the thermodynamic calculations. Shallow steps were observed on the C, A, and M substrates with the FE-SEM. In the case of the evaporation of forsterite (e.g., Takigawa et al. 2009; Ozawa et al. 2012), evaporation pits with characteristic shapes and clear bunched-step structures were observed on individual crystallographic surfaces after evaporation. The difference between the evaporated surfaces of forsterite and corundum may be due to smaller evaporated fractions of corundum than those of forsterite (Takigawa et al. 2009; Ozawa et al. 2012). The typical weight loss of a corundum sample in this study was about 1% (Table 3), which corresponds to an evaporation thickness of ∼1 μm. In the evaporation experiments of forsterite by Takigawa et al. (2009), the evaporated fractions of forsterite were at least 10% of the initial weight, corresponding to the evaporation thickness of more than several tens of micrometers. The early stage of evaporation is affected by the initial surface condition in previous studies on forsterite, but this was not the case in the present study because the surfaces of the starting materials had been mechanochemically polished to be very flat (±<0.5 nm) and the surface crystal structures were not destroyed, which was confirmed by EBSD. Evaporation without initial surface effects is supported by the fact that the weight changes of the samples are fitted with a linear function of heating duration passing through the origin.
Evaporation rates along the c, a, and m axes (vevp, C, vevp, A, and vevp, M, mm s−1) were calculated from the weight losses and the original dimensions of the three starting samples (Nagahara & Ozawa 1996; Takigawa et al. 2009):
where w0 and w1 are the weights of the sample before and after evaporation; t is the heating duration; and lC, lA, and lM are the initial sizes of the starting material along the c, a, and m axes. The vevp, C, vevp, A, and vevp, M were obtained by simultaneously solving Equation (1) for three samples heated at the same time.
The averaged anisotropic evaporation fluxes (jevp, C, jevp, A, and jevp, M) at each temperature, which are found by dividing the evaporation rates (vevp, C, vevp, A, and vevp, M) by the density of corundum, are listed in Table 1, and their temperature dependences are shown in Figure 4. We also summarize jevp, C, jevp, A, and jevp, M in all of the experiments at 1600°C–1790°C in Table 3. The evaporation rate along the m axis is largest, and that along the c axis is smallest (jM ≫ jA > jC). The degree of anisotropy in evaporation rates seems not to change largely with temperature within the experimental temperature range, and the ratios of jC/jA and jM/jA are 0.53–0.72 and 1.8–2.3, respectively.

Figure 4. Arrhenius plot of evaporation fluxes of corundum along the c, a, and m axes (jC, jA, and jM) and their 2σ error bars.
Download figure:
Standard image High-resolution imageTable 1. Anisotropic Evaporation Fluxes and Evaporation Coefficients of Corundum
| T | jevp, C | jevp, A | jevp, M | jevp, C/jevp, A | jevp, M/jevp, A | αe | ||
|---|---|---|---|---|---|---|---|---|
| (°C) | (g m−2 s−1) | (g m−2 s−1) | (g m−2 s−1) | //c | //a | //m | ||
| 1785 | 1.01 × 10⁻⁴ (0.02 × 10⁻⁴) | 1.47 × 10⁻⁴ (0.15 × 10⁻⁴) | 3.29 × 10⁻⁴ (0.26 × 10⁻⁴) | 0.69 | 2.2 | 0.055 | 0.081 | 0.181 |
| 1675 | 1.03 × 10⁻⁵ (0.08 × 10⁻⁵) | 1.42 × 10⁻⁵ (0.08 × 10⁻⁵) | 3.27 × 10⁻⁵ (0.27 × 10⁻⁵) | 0.72 | 2.3 | 0.042 | 0.059 | 0.135 |
| 1600 | 1.43 × 10⁻⁶ (0.21 × 10⁻⁶) | 2.69 × 10⁻⁶ (0.52 × 10⁻⁶) | 4.96 × 10⁻⁶ (0.35 × 10⁻⁶) | 0.53 | 1.8 | 0.027 | 0.050 | 0.093 |
Note. jevp, C, jevp, A, and jevp, M: evaporation flux along the c, a, and m axes; 2σ uncertainties are shown in parentheses; αe: evaporation coefficient.
Download table as: ASCIITypeset image
3.2. Anisotropy in Condensation Rates of Corundum
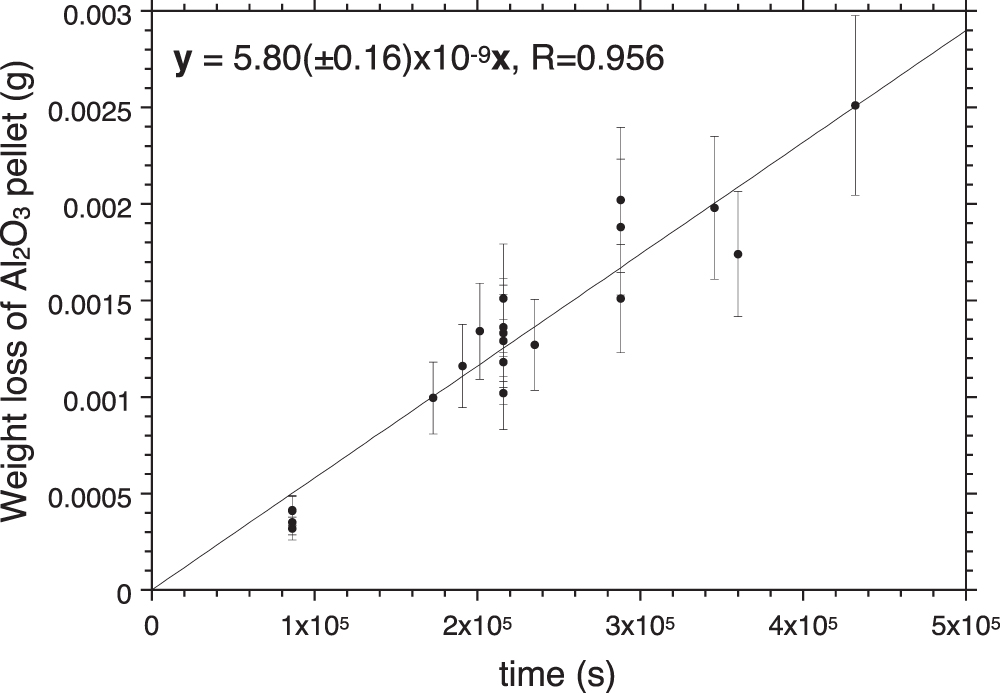
The weight losses of the alumina pellet (gas source) increased linearly with time (Figure 14), suggesting a steady supply rate of Al- and O-bearing gases onto the substrates. The gas supply rate from the alumina pellet was found to be 3.29 × 10⁻³ g cm−2 s−1 by dividing the weight-loss rate of the pellet (Figure 14) by a cross section of the crucible (15 mm in diameter).
Shallow steps were observed on the front surfaces of substrates facing the gas source (Figure 3(b)) after 48 hr of condensation (Figure 5). Step structures were also observed on the back surfaces of the substrates, but these steps were not as high as those formed on the front surfaces. Nucleation islands were observed only near the edges of the sample, where very small amounts of tungsten or iridium condensed and probably helped the nucleation of corundum. Therefore, two-dimensional nucleation did not occur, or very slowly, and condensation proceeded without two-dimensional nucleation.

Figure 5. Secondary electron images of the surfaces of substrates after condensation experiments (ex #41; substrate temperature of 1575°C, 48 hr) with the largest surface of the c plane, a plane, and m plane (from left to right). Images were taken by tilting the SEM stage 70° to enhance the topography. The scale bar represents the length scale along the horizontal direction.
Download figure:
Standard image High-resolution imageIridium ribbons were placed in some experiments together with corundum substrates to examine if corundum condenses on the back surface and the surface covered with the Ir pedestal. Figure 6 shows secondary electron images of the Ir ribbon set together with corundum substrates for 100 hr. Corundum polycrystalline grains covered the front surface of the Ir ribbon facing the gas source. Only a tiny amount of condensates was found on the front surface of the Ir ribbon covered with the Ir pedestal (Figures 3(b) and 6), and no condensate was observed on the back surface of the ribbon. This strongly indicates that little or no condensation occurred on the back surface and the front surface covered by the Ir pedestal. The effective surface areas for condensation (Sfront) are summarized in Table 4.

Figure 6. Secondary electron image of the front face of an iridium ribbon (ex #33; substrate temperature of 1575°C, 100 hr), and high-magnification images of (a) a region A and (b) a region B. The EDS analyses showed that corundum condensed only on B regions, and no condensation occurred on A regions, which were covered with the iridium pedestal. No condensate was observed on the back face of the iridium ribbon.
Download figure:
Standard image High-resolution imageThe weight-gain rates of the substrates as a function of Sfront are shown in Figure 7. The weight-gain rates of M substrates are the largest, and those of C substrates are slightly smaller than those of A substrates regardless of Sfront, which indicates that the growth of corundum from vapor is anisotropic, as is evaporation.

Figure 7. Weight-gain rates of corundum substrates as a function of the front surface area (Sfront). Open symbols represent weight-gain rates of C and A substrates with large side faces of the m plane (Figure 3(a)). A horizontal line shows the contribution of weight gains at the side faces of the m plane for C and A substrates in the case that condensation on the side of m planes occurs at the same rate as on the front face of the M substrate.
Download figure:
Standard image High-resolution imageFigure 8 shows the condensates obtained on the Ir wire set inside the crucible in the experiment for 60 hr (#45). No condensate was observed near the bottom of the crucible. Corundum condensates appeared at ∼2 mm below the Ir pedestal (substrates), where the condensates were sparsely distributed. The grain size and density of condensates increased with the distance from the bottom. The surface of the Ir wire was totally covered with condensed corundum near the upper end of the crucible. These observations indicate that the substrates were located at the position satisfying a supersaturated condition for corundum during the experiments and that the degree of supersaturation was not significantly large. The inner wall of the crucible above the substrate location is likely to be a considerable sink of Al- and O-bearing gas species.

Figure 8. Schematic image and secondary electron images (a)–(e) of the Ir wire put inside the Ir crucible (ex #45; gas-source temperature of 1705°C, 60 hr). The locations of the outlet of the crucible, the corundum substrates on the Ir pedestal, and the beginning of condensation are indicated by arrows. No condensate was observed at the location of (a), and the grain size of condensates increased with the distance from the gas source.
Download figure:
Standard image High-resolution image4. EVAPORATION AND CONDENSATION COEFFICIENTS OF CORUNDUM
4.1. Evaporation Coefficients and Anisotropy
When corundum evaporates congruently in vacuum, its ideal (maximum) evaporation flux (jevp) is given by the Hertz–Knudsen equation with equilibrium vapor pressures of Al- or O-bearing gas species over corundum (Paule & Margrave 1967):
where v is a stoichiometric factor representing the number of Ali or Oj in gas species (i or j), peq and m are the equilibrium vapor pressure of gas species at an absolute temperature (T) and the molecular weight, and R is the gas constant. The factors of 1/2 and 1/3 represent the stoichiometry of Al2O3 evaporation.
The equilibrium vapor pressures of Al- and O-bearing gas species can be calculated thermodynamically. The dominant gas species in the system are Al, AlO, Al2O, AlO2, O, and O2, and the evaporation reactions are given as follows:

The equilibrium constants for the above reactions are obtained from the Gibbs free energies of the reactions (NIST-JANAF, 1998):
In the case of free evaporation in a vacuum, Equation (2) requires that the equilibrium vapor pressures of Al- and O-bearing species satisfy the following relation (Tsuchiyama et al. 1999):
By solving Equations (4) and (5) for a given temperature, of the gas species can be obtained (Figure 9). The most abundant Al- and O-bearing gas species are Al and O under the present temperature conditions. The discussion above is based on the assumption of no Al- and O-bearing gas species in the surrounding gas (free evaporation) satisfying = = 0, where and represent partial pressures of all of the O- and Al-bearing gas species. If is much larger than (equilibrium pressures of O-bearing gas species) in Figure 9, the actual oxygen partial pressure could be buffered by , and Equation (5) would be no longer satisfied. The continuous evacuation of the chamber is likely to result in = 0. The residual gas in the high-temperature region of the furnace contains O ( 0) due to decomposition of H2O, which outgases from the chamber wall and thermal shields. Assuming that all of the residual gas in the chamber during experiments was H2O and that H2O decomposes into H2 and O in equilibrium at the experimental temperatures, is estimated to be ∼5 × 10⁻⁵ Pa, which is smaller than at 1785 and 1675°C and slightly smaller than at 1600°C. This is not a strict free-evaporation condition but sufficiently satisfies the condition of free evaporation.


Figure 9. Equilibrium vapor pressures of Al- and O-bearing species on corundum.
Download figure:
Standard image High-resolution imageThe free evaporation flux of corundum can simply be expressed as for Al because the dominant Al-bearing molecule is Al (Figure 9):


The evaporation flux expressed by Equation (6) is obtained from the kinetic theory of gases, where any kinetic effects on evaporation from surface processes or conditions, such as bond-breaking, surface diffusion of adatoms, desorption of adatoms, and the number of kink sites, are not included. All of the kinetic effects of surface processes are usually included in a single parameter as an evaporation coefficient (αe), and the actual evaporation rate is represented by


where is the ideal evaporation flux without kinetic hindrances (Equation (6)). The evaporation coefficient (αe) is between zero and unity, and no kinetic hindrance is present when αe = 1 (ideal evaporation).

The obtained , jC, jA, and jM for each examined surface (Figure 4) gives αe ranging from 0.2 to 0.02, which includes anisotropy and temperature dependence (Figure 10). The evaporation coefficients slightly increase with temperature within the temperature range of 1590°C–1790°C. The temperature dependence of αe is consistent with previous work by Pollock (1961), Sasamoto & Sata (1971), and Akulenok et al. (1974), where evaporation experiments of alumina were performed in vacuum using single crystals of corundum at 1650°C–2000°C.


Figure 10. Temperature dependence of evaporation coefficients of single crystals of corundum obtained in this study (solid symbols) and in previous works (open symbols). The circle, triangle, and square symbols represent αe along the c, a, and m axes, respectively.
Download figure:
Standard image High-resolution imageEvaporation rates by Pollock (1961) and Sasamoto & Sata (1971) were obtained by dividing the net evaporated weights by the total surface areas of the samples. The extrapolated evaporation coefficients by Sasamoto & Sata (1971) are considerably lower than our results in spite of a similar temperature dependence (Figure 10). The pressures in their experiments were higher (3–8 × 10⁻³ Pa) than that of the present work (<10−4 Pa) and may provide a higher partial pressure of oxygen. The residual oxygen, however, may not largely suppress the evaporation rates, except for the experiments at <1900°C. They also performed Knudsen-cell evaporation experiments of corundum and obtained an equilibrium vapor pressure about one order of magnitude lower than what we used to calculate αe in Figure 10 (JANAF, 1998). If αe is calculated based on their lower equilibrium vapor pressures, our αe is consistent with those reported by Pollock (1961) and Akulenok et al. (1974). Thus, the small αe by Sasamoto & Sata (1971) could be due to an overestimation of the temperature by about one hundred degrees. Alternatively, evaporation might be suppressed in their experiments because of the presence of O- and Al-bearing gas near samples originating from an alumina sample holder used to suspend a corundum sample.
Akulenok et al. (1974) obtained anisotropic evaporation rates by measuring the thickness of the evaporated layers parallel to the {0001}, , and faces. The same order of anisotropy of as our results was obtained in their series of experiments, but the evaporation rates are about two times higher than ours with large data scattering (Figure 10). We have done various sets of experiments of different durations, but the scatter is much less. The uncertainty of temperature in Akulenok et al. (1974) is ±10°C, whereas that in the present work is ±5°C. The temperature difference of 20°C changes the vapor pressure by a factor of 1.5, which may explain the scatter of the evaporation rates in Akulenok et al. (1974) and the difference from our results.


The kinetic hindrance of corundum evaporation is much larger than that of metallic iron (αe ∼ 1; Tachibana et al. 2011), but similar to that of forsterite (αe = 0.1–0.01; Takigawa et al. 2009; Ozawa et al. 2012). The kinetic hindrance generally becomes smaller with increasing temperature, but this significant difference may be attributed to the difference in the bond characteristics constituting the crystal structures of these minerals, for example, ionic-covalent bonds for silicates and oxides and metallic bonds for metallic iron.
The activation energies of evaporation along the c, a, and m axes in vacuum are 730, 687, and 706 kJ mol−1, respectively. These values are larger than the value of 609 kJ mol−1 that is a thermodynamic driving force of evaporation obtained from Equation (4) and indicates that the activation energy of surface kinetic processes is ∼100 kJ mol−1.
4.2. Anisotropic Condensation Coefficients and Supersaturation Ratios
The condensation fluxes along the c, a, and m axes (jC, jA, and jM) can be obtained from the slopes of Figure 7, which are (4.97 ± 0.31) × 10−10, (7.06 ± 0.33) × 10−10, and (15.3 ± 0.31) × 10−10 g s−1 cm−2, respectively, and the flux ratios are jC/jA = 0.70 and jM/jA = 2.2.
If condensation on the side surfaces of the substrates contributes to the weight gain, the anisotropy in the weight gain by the C, A, and M substrates (Figure 7) may not be real. In particular, contribution by the side faces of the C and A substrates would not be negligibly small because the condensation rate along the m axis is roughly five times larger than those along the c and a axes (Figure 7). The weight-gain rates of the C and A substrates with the largest side m faces (2 × 10 × 0.5 mm2; open symbols) are compared with those having smaller side m faces (closed symbols) in Figure 7, where no clear difference in condensation rates is observed between the open and closed symbols. The contribution of the weight gains by the side m faces (2 × 10 × 0.5 mm2) is estimated (dashed line in Figure 7) assuming the condensation flux along the m axis to be 15.3 × 10⁻⁹ g s−1 cm−2. Although some open symbols of the C substrates with small Sfront (<22 mm2) show smaller condensation rates than the expected contribution of condensation on the side faces, the overall data of the C and A substrates can be fitted with the lines running through the origin. Consequently, condensation on the side surfaces of substrates did not contribute to the overall weight gains, and the differences in the weight gain of the C, A, and M substrates represent different condensation efficiencies for the different crystallographic surfaces, i.e., anisotropy in condensation.
The obtained condensation fluxes are the net fluxes including evaporation from the substrates, which will be quantitatively discussed below with the supersaturation ratio and anisotropic condensation coefficients. As mentioned in Section 3.2, the lack of detectable condensate on the Ir wire below the substrate position (Figure 8) indicates that the supersaturation ratio just above the substrates was not large. In order to quantitatively determine the supersaturation ratio and condensation coefficients of corundum, we evaluated the flux of the gas molecules hitting the substrates.
The partial pressures of Al- and O-bearing gases from the gas source should be similar to or smaller than their equilibrium vapor pressures of corundum at the gas-source temperature. This provides a much longer mean free path of the gas molecules than the size of the crucible, and a molecular flow condition should be achieved inside the crucible. There is a pressure gradient inside the crucible because the upward and downward pressures vary at different heights of the crucible (Figure 11) because of the conductance of the crucible under the molecular flow condition. The Ir pedestal and the substrates themselves are also sources of conductance.

Figure 11. A schematic illustration of the inside of the Ir crucible during condensation experiments: di and ui are downward and upward pressures, and pevp is the upward pressure due to evaporation of the pellet; AC and AS are the cross section of the crucible and the open area at the location of the Ir pedestal, respectively.
Download figure:
Standard image High-resolution imageThe alumina pellet for the gas source evaporates at the bottom of the crucible. The molar evaporation flux from the gas source (jevp) is obtained from the weight-loss rate of the source (Figure 6) divided by the cross section of the crucible and is expressed by
where d1 is a downward pressure of Al at the surface of the gas source (Figure 11), is determined by Equation (6) for alumina at the gas-source temperature, αe and αc are evaporation and condensation coefficients, and pevp represents the pressure of Al produced by evaporation of the pellet. At a steady state, the upward and downward gas pressures of Al above the gas source (u1 and d1), those at the front surface of the substrates (u2 and d2), and those behind the substrates (u3 and d3) satisfy the following relations (Paule & Margrave 1967):


where WA and are the Clausing factors of the cylindrical crucible below and above the substrates, respectively, representing the transmission probability of gas molecules (0 ≤ WA, ). The parameter f gives the fraction of gas molecules that pass through the open spaces between the substrates and the Ir pedestal (Figure 11) given by f = WBAS/AC. Here, AC and AS are the cross section of the crucible and the area of the open spaces, respectively (Figure 11), and WB is the Clausing factor for the open spaces. The parameter β is the fraction of gas flux condensed inside the upper part of the Ir crucible (Figure 8) and is regarded as a free parameter here (0 ≤ β ≤ 1). Condensation onto the wall of the crucible below the substrates is negligible because no condensate was observed >2 mm below the substrates (Figure 8).


The Clausing factor of a cylindrical tube is given by

where L is the length of the tube and r is the radius (Santeler 1986), and WA and are obtained as 0.18 and 0.30 for r = 7.5 mm and L = 40 and 20 mm, respectively; WB is also obtained from Equation (10) with a reduced disk radius r that satisfies AS = 4πr2 and L = 1.5 mm (the thickness of the Ir pedestal). The AS of each experiment ranged from 85 to 115 mm2, which corresponds to a WB of 0.75–0.79. In the following discussion, the median of AS = 100 mm2 and WB = 0.77 are used, which gives an f of 0.33.

The supersaturation ratio (S) on the front surface of the substrates is the ratio between the flux hitting the front surfaces and the ideal evaporation flux from the substrates . Assuming that the temperature of the gas molecules hitting the substrates instantaneously becomes equilibrated with that of the substrates, S is given by , where is the equilibrium pressure of corundum at the substrate (Tsbst = 1575°C, Figure 9), and u2 is obtained from Equation (9) as


The S in the present experiments is evaluated to be 3.4–6.0 for a β of 0–1 (Table 2). We should note that condensation onto the substrates also changes the gas flux inside the crucible and the value of S by a few percent at most, which is estimated from the weight gain of the substrates. This is much smaller than the uncertainty of the condensation fraction onto the wall of the crucible (β).
Table 2. Pressures of Al at Different Locations in the Crucible and Anisotropic Condensation Coefficients of Corundum
| β | u1 | u2 | u3 | d1 | d2 | d3 | S | Sb | αc | ||
|---|---|---|---|---|---|---|---|---|---|---|---|
| (10−9 atm) | (10−9 atm) | (10−9 atm) | (10−9 atm) | (10−9 atm) | (10−9 atm) | (u2/peq) | (d3/peq) | //c | //a | //m | |
| 0 | 3.32 | 1.80 | 1.13 | 2.99 | 1.47 | 0.80 | 5.8 | 2.6 | 0.032 | 0.046 | 0.099 |
| 0.1 | 3.11 | 1.58 | 0.92 | 2.77 | 1.25 | 0.58 | 5.1 | 1.9 | 0.036 | 0.053 | 0.11 |
| 0.3 | 2.85 | 1.33 | 0.66 | 2.51 | 0.99 | 0.33 | 4.3 | 1.0 | 0.043 | 0.063 | 0.13 |
| 0.5 | 2.71 | 1.19 | 0.52 | 2.37 | 0.85 | 0.18 | 3.8 | 0.6 | 0.048 | 0.070 | 0.15 |
| 0.7 | 2.61 | 1.09 | 0.43 | 2.28 | 0.76 | 0.09 | 3.5 | 0.3 | 0.052 | 0.076 | 0.16 |
| 1 | 2.52 | 1.00 | 0.34 | 2.19 | 0.67 | 0.00 | 3.2 | 0.0 | 0.057 | 0.083 | 0.18 |
Note. β: fraction of gas molecules condensed inside the upper part of the crucible; ui and di: upward and downward pressures of Al at a location i (Figure 11); S and Sb: supersaturation ratios of corundum at front and back surfaces; αC: condensation coefficient.
Download table as: ASCIITypeset image
The αc of the corundum substrates (1575°C) can be determined from the equation

where jin is the incoming flux of gas onto the front surface of the substrates calculated from jcond is the molar condensation flux obtained from the weight gains of substrates (Figure 7), and α along each axis can be estimated from peq at the substrate temperature and αe (Figure 4). The obtained αc along the c, a, and m axes are 0.030, 0.044, and 0.095 for β = 0, whereas they are 0.055, 0.080, and 0.17, respectively, for β = 1 (Table 2).

The absence of condensate on the back surface of the Ir ribbon suggests that the supersaturation ratio at the back surface of the substrate (Sb) was smaller than unity. The lower limit of d3 is constrained to satisfy Sb ≤ 1 at the back surface of the substrate, and thus β should be larger than 0.3. The obtained ranges of αc for β = 0.3–1 are 0.04–0.06, 0.06–0.08, and 0.1–0.2 along the c, a, and m axes, respectively, at 1575°C and an S of 4.3–3.2 (Table 2). We also conclude that the anisotropy of αc is present irrespective of the value of β. Both the anisotropy and absolute values of αc at 1575°C and S ∼ 4 are similar to those of αe at 1600°C–1790°C (S ∼ 0), suggesting that common atomistic processes are involved under similar surface conditions both in evaporation and condensation, at least at ∼1600°C. The anisotropy in condensation found in this study indicates that corundum condensates could have a crystallographically anisotropic shape: an oblate-like shape slightly flattened along the c axis (aspect ratio of ∼0.7) due to a smaller growth rate along the c axis than along the a axis.
5. GROWTH FORM OF CIRCUMSTELLAR CORUNDUM AND ITS APPLICATION TO ASTROMINERALOGY
5.1. Presolar Corundum Grains
Here we compare a possible growth form of circumstellar corundum with presolar corundum, which are survivors of the real circumstellar corundum grains formed around oxygen-rich evolved stars.
The condensation anisotropy shown in this experimental study suggests that circumstellar condensates of corundum would have an oblate-like shape slightly flattened along the c axis because the growth rate is slower along the c axis than along the a axis. Even if the morphology of corundum were affected by the anisotropic evaporation of condensed corundum, it will not have an eccentric shape with extreme aspect ratios.
The morphological information currently available for presolar corundum grains is limited, but none of the observed presolar alumina grains was either whisker- or platy-shaped corundum. Takigawa et al. (2014) made a detailed observation of the morphology of presolar alumina grains chemically isolated from unequilibrium ordinary chondrites prior to destructive isotopic measurements. They found five presolar alumina grains with aspect ratios of 0.6–0.7 and two relatively flat alumina grains with an aspect ratio of ∼0.3 (Table S1 in Takigawa et al. 2014). The surfaces of three grains with an aspect ratio of ∼0.7 and one grain with an aspect ratio of ∼0.3 were very rough, and no clear facet to determine the crystal habits was observed. Two other grains (RC075 58-09 and RC075 59-22) showed subhedral shapes, and RC075 58-09 was crystalline, but its surface crystallinity was too low to determine the crystal phase with the EBSD technique. RC075 59-22 was an equant-shaped corundum grain, but the orientation of the c axis seems not to correspond to the semiminor axis. One relatively flattened presolar corundum grain was polycrystalline. Although there are no clear characteristics of crystal surfaces in presolar corundum grains, the observation is at least consistent with the condensation and evaporation anisotropy in our experiments.
5.2. IR Spectra of Various Shaped Corundum and Spinel Grains
Corundum grains formed in space should have a crystallographically anisotropic shape that reflects their formation process. The crystallographically anisotropic shape of dust grains changes peak wavelengths, relative intensities, and detectable peak numbers in their infrared spectral features (e.g., Takigawa & Tachibana 2012). A kinetic effect from the surrounding gas is also a possible factor that controls the anisotropy of crystalline dust formation. Hydrogen may especially affect the anisotropy of evaporation and condensation, as in the evaporation of forsterite (Takigawa et al. 2009). Although the role of hydrogen should be investigated quantitatively, it is expected that the effect may not be so large in the pressure range of mass-loss winds. We thus propose that the most probable morphology of circumstellar corundum is an oblate-like shape slightly flattened along the c axis, based on the growth anisotropy in the present study.
Corundum and spinel have been proposed as a carrier of the 13 μm unidentified feature around evolved stars, but neither spheres nor CDEs of these minerals can reproduce the peak position of the 13 μm feature without any additional strong peaks at other wavelengths (Posch et al. 1999; Speck et al. 2000). In order to examine whether corundum can explain the 13 μm feature when the crystallographically anisotropic shape is taken into consideration, we calculated mass absorption coefficients (MACs) of ellipsoidal corundum with various aspect ratios (Figure 12; Bohren & Huffman 1983; Takigawa & Tachibana 2012). Although MACs of dust also depend on size, edge, and temperature, we simply assume that the grain shape is an ellipsoid and that the size is smaller than the wavelength (within the Rayleigh limit). The optical constants by Barker (1963) measured at room temperature were used in this study. The effects of size and edge have been discussed in detail in Takigawa & Tachibana (2012).
The MACs depend both on shape and crystal orientation:
where is the absorption cross section, ρ is the density of the grain, V is the volume of the grain, ω is the frequency of light, and  j is the complex dielectric function along the j axis. Here, Lj is a geometric factor that determines the shape of grains satisfying the relation L1 + L2 + L3 = 1 (Bohren & Huffman 1983).

Because corundum belongs to the trigonal crystal system, any directions perpendicular to the c axis are optically identical. The morphology of corundum is assumed to be spheroidal with its rotation axis corresponding to the crystallographic c axis. The MACs of spheroidal corundum are shown in Figure 12(a), where the geometric factors along and perpendicular to the c axis ( and LC⊥) satisfy + 2LC⊥ = 1. A spectrum of CDEs (CDE; Bohren & Huffman 1983), which is an ensemble of ellipsoids with all possible aspect ratios (rc/ra; the scale ratio of the symmetric axis (rc) to the equatorial axis (ra)), is also shown in Figure 12(a). The spectrum of CDEs is known to reproduce laboratory spectra obtained from powders ground by a mortar, and it shows two broad peaks at <19 μm and one at >19 μm. Spherical corundum shows strong and weak peaks at 12.7 and 13.2 μm, respectively, but displays no significant peak at >19 μm (Figure 12(a)). On the other hand, grains with eccentric shapes (needle- or disk-like shapes) show peaks at >19 μm as strong as those at <19 μm (Figure 12(a)). Thus, the strong feature at >19 μm in the CDE spectrum is due to the presence of grains with eccentric shapes.


Figure 12. Mass absorption coefficients (MACs) of spheroidal corundum and spinel with various aspect ratios (rsym/requ). (a) Spectra of prolate corundum elongated along the c axis (top) and spectra of oblate corundum flattened to the c axis (bottom). The MACs for spherical corundum and the CDEs, which is multiplied by 50, are also shown for comparison. (b) Spectra of prolate (top) and oblate (bottom) spinel grains. Optical constants in Tropf & Thomas (1991) were used for the calculation, and rsym and requ represent the symmetric and equatorial axes of the spheroid.
Download figure:
Standard image High-resolution imageWith an increasing degree of elongation (rc/ra > 1), the peak position of spheres at 12.7 μm shifts to the shorter wavelength (Figure 12(a)). The intensity of the 13.2 μm peak of the spheres does not change with the degree of elongation, but the peak shifts to the longer wavelength. Another peak appears at >19 μm for extremely elongated grains. With an increasing degree of flattening (rc/ra < 1), the positions of the 12.7, 16, and 21 μm peaks of the spheres shift to the longer wavelengths, and the 13.2 μm peak shifts to shorter wavelengths and becomes less intense (Figure 12(a)). Extremely flattened grains show even stronger peaks at ∼16–17.5 and at 21–22.4 μm than at 12–16 μm.
A clear peak at 13 μm appears without any accompanying strong peaks for oblate grains with the aspect ratio of rc/ra ∼ 0.7 (Figure 12(a)), which is exactly the ratio obtained in this study (αc of 0.04–0.06 and 0.06–0.08 along the c and a axes, respectively). This strongly indicates that corundum dust condensed from vapor is a carrier of the unidentified 13 μm peak. Ellipsoidal spinel grains also show a peak at 13 μm, but only with other accompanying strong peaks irrespective of the aspect ratios (Figure 12(b)).
Circumstellar corundum grains may not have a uniform shape (aspect ratio), but they are likely to be in a certain range of shape variations (Takigawa & Tachibana 2012). The shape variation makes the peak width broader, as well as those in grain temperature and size (e.g., Zeidler et al. 2013). The infrared features of grain ensembles of corundum with the dominance of specific crystallographically anisotropic shapes (LDE, limited distribution of ellipsoids; Figure 13) assume an equal probability of shapes within the LDE as in the CDEs (Takigawa & Tachibana 2012).
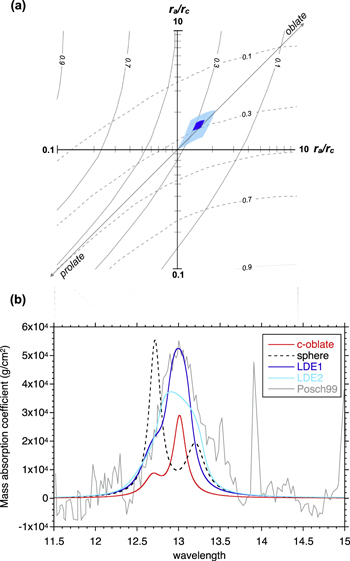
Figure 13. (a) Range of aspect ratios of ellipsoidal grains for LDE1 (blue) and LDE2 (light blue). Solid and dashed contours show the geometric factors of LC⊥1 and LC⊥2, which satisfy = 1. (b) Mass absorption coefficients of oblate grains with the aspect ratio of ra/rc = 0.7 (red), spheres (black), LDE1 (blue), and LDE2 (light blue) at 11–15 μm. The observed 13 μm feature by Posch et al. (1999) is also shown for comparison (in arbitrary units).
Download figure:
Standard image High-resolution imageWe consider two LDEs with shapes slightly scattered from the aspect ratio of rc/ra = 0.7. The geometric factors of the spheroid with rc/ra = 0.7 is (LC//, LC⊥1, LC⊥2) ∼ (0.43, 0.285, 0.285), and LDE1 and LDE2 are assumed to consist of grains with (LC//, LC⊥1, LC⊥2) = (0.46–0.4, 0.27–0.30, 0.27–0.30) and (LC// , LC⊥1, LC⊥2) = (0.52–0.34, 0.24–0.33, 0.24–0.33), respectively, which correspond to the ranges of aspect ratios shown in Figure 13(a). The MACs of LDE1 and LDE2 show peaks at 12.9–13.0 μm, and the FWHMs of the peak are 0.36 and 0.73 μm for LDE1 and LDE2, respectively (Figure 13(b)). The obtained FWHMs are comparable to the observed width of 0.5–0.8 μm for the 13 μm feature (Posch et al. 1999; Figure 13(b)). Note that LDEs with a much larger range of aspect ratios, including highly flattened oblates (rc/ra < ∼0.3), have a broader peak at the longer wavelength than does the observed 13 μm peak.
These calculations indicate that the prolate grains with the aspect ratio of rc/ 0.7 can reproduce the peak position of the observed 13μm feature even with a certain degree of shape variation as long as very flattened oblates are not present. Moreover, the peak width of the feature is well reproduced by the shape distribution (i.e., about 30% dispersion of the aspect ratio). The aspect ratio required to explain the 13 μm feature is close to the one expected for anisotropic condensation, and we thus conclude that corundum condensates are the carrier of the circumstellar 13 μm feature.

5.3. Implication for Acceleration of Outflows from SRb and Mira Variables
The relative strength of the 13 μm feature to the total dust emission is higher in semiregular variables (SRbs) than in Mira variables (Speck et al. 2000; Sloan et al. 2003). The SRbs are characterized by lower mass-loss rates and slower terminal velocities of the outflows than are Mira variables (Knapp et al. 1998).
Corundum can form in the innermost regions of the circumstellar envelopes because of its highly refractory nature, and homogeneous nucleation of corundum is expected to predate its vapor growth. The absence of more refractory phases within presolar alumina grains, unlike some presolar graphite grains containing carbide subgrains (Bernatowicz et al. 1996), supports the homogeneous nucleation of corundum. Although a high supersaturation ratio is generally required for homogeneous nucleation, the supersaturation ratio should drop once the nucleation of corundum takes place. If a sufficient amount of Al molecules remains in the gas phase after nucleation, the growth form of corundum is determined by the growth anisotropy obtained in this present study. The presence of micrometer-sized presolar corundum grains from AGB stars, which are much larger than seed nuclei, strongly suggests that the vapor growth of corundum dominates the formation of corundum after homogeneous nucleation in mass-loss winds. The morphology of presolar corundum grains (Section 5.1), where eccentric shapes such as whiskers along screw dislocations are absent, also suggests that the vapor growth occurs at relatively low supersaturation ratios.
The present study and the morphological observation of presolar corundum thus suggest that corundum grows in outflows at low supersaturation ratios without large supercooling. The anticorrelation between the 13 μm feature and the mass-loss rate may indicate that oxygen-rich AGB stars with low terminal velocities and low mass-loss rates have slower cooling rates of the gas in the dust-free innermost regions, which allow the condensation of corundum.
If corundum is the first condensate in a circumstellar envelope, the cooling rate of the gas may change after corundum condensation, and the radiation pressure to corundum dust drives the acceleration of gas due to gas drag (dust-driven wind; Sedlmayr & Dominik 1995; Woitke 2006). Amorphous silicate and oxide dust then condense under high supersaturation conditions in the accelerated outflows, where the cooling rate is large. The size of presolar Al2O3 grains are <1.5 μm and typically ∼1 μm in diameter (Nittler et al. 1997; Takigawa et al. 2014), which is the most efficient size to scatter the stellar light and accelerate the surrounding gas (Höfner 2008). This meteoritic observation supports the idea of gas acceleration by condensed corundum dust.
The dominant amorphous silicate features without the 13 μm feature of oxygen-rich Mira variables (Sloan et al. 2003) would be the result of the condensation of amorphous silicates rather than corundum due to a larger cooling rate of the gas in the dust-free region by acceleration of the outflow of the Mira variables more efficiently than SRbs.
6. CONCLUSIONS
The morphology of crystals often reflects the crystal structures and anisotropy of their formation processes, and crystalline dust with a specific morphology shows characteristic observable infrared features. Corundum is a highly refractory dust species, and the presence of presolar corundum grains indicates that they condense around oxygen-rich AGB stars. Circumstellar corundum is also one of the candidates for the common but unidentified 13 μm feature of oxygen-rich AGB stars.
In this study, we performed evaporation and condensation experiments on corundum, focusing on the anisotropy in evaporation and condensation in order to understand the formation kinetics of corundum dust in circumstellar environments and to evaluate the crystallographically anisotropic shape of corundum condensates and their infrared features for a comparison with the observed 13 μm feature.
- 1.Evaporation coefficients (αe), a parameter that represents kinetic hindrances for evaporation, along the crystallographic c, a, and m axes show a clear anisotropy of within the range of 0.02–0.2 at 1600–1785°C in vacuum.
- 2.Condensation coefficients of corundum (αc) were quantitatively determined for the first time. The obtained ranges of αc along the c, a, and m axes are 0.04–0.06, 0.06–0.08, and 0.1–0.2, respectively, at 1575°C, and the supersaturation ratio (S) was 4.3–3.2. The obtained αc and the anisotropy at 1575°C and S ∼ 4 are similar to those of αe at 1600°C–1785°C in vacuum (S ∼ 0), suggesting similar atomistic processes for the kinetic hindrances of evaporation and condensation.
- 3.The crystallographically anisotropic shape of corundum condensates expected from our condensation experiments is not a whisker or a disk with an extreme aspect ratio but an oblate-like shape slightly flattened along the c axis with an aspect ratio of ra/rc ∼ 0.7. This morphology is not affected by evaporation unless it is extensive. The fact that presolar corundum grains, which are the survivors of circumstellar condensates, do not have eccentric shapes (Takigawa et al. 2014) is consistent with the predicted growth morphology of condensed corundum in this study.
- 4.The calculation of MACs of corundum and spinel spheroids with various aspect ratios shows that oblate corundum grains with an aspect ratio of ra/rc ∼ 0.7 well reproduce the 13 μm peak without any accompanying strong peaks. If the grains with ra/rc ∼ 0.7 have about 30% shape variations, not only the peak position but also the peak width of the observed 13 μm feature are also well reproduced.

The common presence of the 13 μm feature around oxygen-rich AGB stars requires a carrier formed by a common formation process. The consistency between the condensation anisotropy of corundum and a crystallographically anisotropic shape of corundum reproducing the 13 μm feature leads to a conclusion that corundum dust formed by anisotropic condensation from vapor emits the 13 μm feature. The anticorrelation between the intensity of the 13 μm feature and the mass-loss rate suggests that corundum effectively condenses in the innermost region of slowly expanding gaseous envelopes and may slightly accelerate the outflows of the low mass-loss AGB stars.
We are grateful to Aya Okubo for her help in condensation experiments. We also appreciate constructive and helpful comments from an anonymous reviewer. This work was supported by Grant-in-Aid for JSPS Fellows (12J02495) (AT).
APPENDIX A: CONDITIONS AND RESULTS OF EVAPORATION AND CONDENSATION EXPERIMENTS
Here we summarize the details of the conditions and results of the evaporation and condensation experiments for corundum (Tables 3, 4, and Figure 14 ).

Figure 14. Weight loss of the gas source (Al2O3 pellet) during condensation experiments. The same pellet was used for all of the experiments.
Download figure:
Standard image High-resolution imageTable 3. Experimental Conditions and Results for Evaporation of Corundum
| sample C {0001} | |||||||||||||
|---|---|---|---|---|---|---|---|---|---|---|---|---|---|
| Run# | T | t | lC | 2σ | lA | 2σ | lM | 2σ | W0 | 2σ | W1 | 2σ | jC |
| (°C) | (hr) | (mm) | (mm) | (mm) | (g) | (g) | (g m−2 s−1) | ||||||
| 8 | 1787 | 49 | 0.517 | <0.001 | 10.011 | 0.002 | 4.897 | 0.001 | 0.097894 | 1 × 10⁻⁶ | 0.0954939 | 1 × 10⁻⁶ | 1.04 × 10⁻⁴ |
| 12 | 1787 | 24 | 0.526 | <0.001 | 9.926 | 0.003 | 3.512 | 0.013 | 0.071193 | 1 × 10⁻⁶ | 0.0702718 | <1 × 10⁻⁶ | 1.00 × 10⁻⁴ |
| 13 | 1787 | 74 | 0.522 | <0.001 | 9.924 | 0.001 | 3.034 | 0.027 | 0.065260 | 1 × 10⁻⁶ | 0.0624268 | <1 × 10⁻⁶ | 1.01 × 10⁻⁴ |
| 9 | 1677 | 99 | 0.516 | <0.001 | 10.020 | 0.001 | 6.439 | 0.028 | 0.131719 | 1 × 10⁻⁶ | 0.1311384 | <1 × 10⁻⁶ | 0.95 × 10⁻⁵ |
| 10 | 1677 | 73 | 0.513 | <0.001 | 9.979 | 0.005 | 7.098 | 0.057 | 0.143160 | 1 × 10⁻⁶ | 0.1426458 | <1 × 10⁻⁶ | 1.09 × 10⁻⁵ |
| 11 | 1677 | 186 | 0.498 | 0.001 | 6.299 | 0.021 | 6.362 | 0.016 | 0.078124 | <1 × 10⁻⁶ | 0.0773692 | <1 × 10⁻⁶ | 1.04 × 10⁻⁵ |
| 20 | 1598 | 96 | 0.500 | 0.001 | 2.577 | 0.016 | 10.042 | 0.003 | 0.050203 | <1 × 10⁻⁶ | 0.0501626 | <1 × 10⁻⁶ | 1.44 × 10⁻⁶ |
| 21 | 1598 | 125 | 0.500 | <0.001 | 2.340 | 0.018 | 10.037 | 0.002 | 0.045637 | 1 × 10⁻⁶ | 0.0455902 | <1 × 10⁻⁶ | 1.56 × 10⁻⁶ |
| 22 | 1598 | 162 | 0.531 | 0.001 | 10.070 | 0.002 | 2.426 | 0.041 | 0.049628 | 1 × 10⁻⁶ | 0.0495494 | <1 × 10⁻⁶ | 1.58 × 10⁻⁶ |
| 23 | 1598 | 200 | 0.529 | 0.001 | 10.067 | 0.002 | 2.443 | 0.034 | 0.050238 | 1 × 10⁻⁶ | 0.0501558 | <1 × 10⁻⁶ | 1.13 × 10⁻⁶ |
| sample A {11–20} | |||||||||||||
| Run# | T | t | lC | 2σ | lA | 2σ | lM | 2σ | W0 | 2σ | W1 | 2σ | jA |
| (°C) | (hr) | (mm) | (mm) | (mm) | (g) | (g) | (g m−2 s−1) | ||||||
| 8 | 1787 | 49 | 5.280 | 0.034 | 0.449 | 0.001 | 9.838 | 0.002 | 0.090012 | 1 × 10⁻⁶ | 0.087261 | 1 × 10⁻⁶ | 1.32 × 10⁻⁴ |
| 12 | 1787 | 24 | 4.307 | 0.019 | 0.446 | <0.001 | 10.010 | 0.001 | 0.075121 | <1 × 10⁻⁶ | 0.073790 | <1 × 10⁻⁶ | 1.57 × 10⁻⁴ |
| 13 | 1787 | 74 | 2.728 | 0.018 | 0.446 | 0.001 | 9.982 | 0.001 | 0.046795 | 1 × 10⁻⁶ | 0.044212 | <1 × 10⁻⁶ | 1.52 × 10⁻⁴ |
| 9 | 1677 | 99 | 5.886 | 0.017 | 0.534 | <0.001 | 10.052 | 0.001 | 0.124033 | <1 × 10⁻⁶ | 0.123372 | 1 × 10⁻⁶ | 1.34 × 10⁻⁵ |
| 10 | 1677 | 73 | 7.030 | 0.043 | 0.533 | <0.001 | 10.046 | 0.001 | 0.147492 | <1 × 10⁻⁶ | 0.146871 | <1 × 10⁻⁶ | 1.45 × 10⁻⁵ |
| 11 | 1677 | 186 | 6.529 | 0.009 | 0.534 | <0.001 | 6.542 | 0.009 | 0.088918 | 1 × 10⁻⁶ | 0.087879 | <1 × 10⁻⁶ | 1.48 × 10⁻⁵ |
| 20 | 1598 | 96 | 2.834 | 0.056 | 0.500 | 0.001 | 9.998 | 0.001 | 0.053910 | 1 × 10⁻⁶ | 0.053838 | 1 × 10⁻⁶ | 3.37 × 10⁻⁶ |
| 21 | 1598 | 125 | 2.363 | 0.014 | 0.498 | 0.001 | 9.989 | 0.001 | 0.045802 | 1 × 10⁻⁶ | 0.045744 | 1 × 10⁻⁶ | 2.25 × 10⁻⁶ |
| 22 | 1598 | 162 | 2.388 | 0.041 | 0.499 | 0.001 | 9.991 | 0.001 | 0.045594 | <1 × 10⁻⁶ | 0.045503 | 1 × 10⁻⁶ | 2.80 × 10⁻⁶ |
| 23 | 1598 | 200 | 2.579 | 0.052 | 0.534 | <0.001 | 9.955 | <0.001 | 0.052395 | 1 × 10⁻⁶ | 0.052294 | 1 × 10⁻⁶ | 2.32 × 10⁻⁶ |
| sample M {10–10} | |||||||||||||
| Run# | T | t | lC | 2σ | lA | 2σ | lM | 2σ | W0 | 2σ | W1 | 2σ | jM |
| (°C) | (hr) | (mm) | (mm) | (mm) | (g) | (g) | (g m−2 s−1) | ||||||
| 8 | 1787 | 49 | 5.055 | 0.102 | 10.055 | 0.004 | 0.540 | 0.001 | 0.105440 | 1 × 10⁻⁶ | 0.099781 | 1 × 10⁻⁶ | 3.09 × 10⁻⁴ |
| 12 | 1787 | 24 | 3.783 | 0.010 | 10.068 | 0.002 | 0.508 | 0.009 | 0.076109 | 1 × 10⁻⁶ | 0.073854 | 1 × 10⁻⁶ | 3.25 × 10⁻⁴ |
| 13 | 1787 | 74 | 3.056 | 0.010 | 10.063 | 0.002 | 0.511 | 0.005 | 0.061283 | 1 × 10⁻⁶ | 0.055226 | <1 × 10⁻⁶ | 3.52 × 10⁻⁴ |
| 9 | 1677 | 99 | 5.618 | 0.068 | 9.944 | 0.002 | 0.530 | <0.001 | 0.116352 | 1 × 10⁻⁶ | 0.115078 | <1 × 10⁻⁶ | 3.08 × 10⁻⁵ |
| 10 | 1677 | 73 | 7.326 | 0.029 | 10.035 | 0.002 | 0.530 | 0.001 | 0.152646 | 1 × 10⁻⁶ | 0.151362 | 1 × 10⁻⁶ | 3.22 × 10⁻⁵ |
| 11 | 1677 | 186 | 6.251 | 0.023 | 6.315 | 0.004 | 0.527 | <0.001 | 0.081449 | <1 × 10⁻⁶ | 0.079503 | 1 × 10⁻⁶ | 3.53 × 10⁻⁵ |
| 20 | 1598 | 96 | 2.375 | 0.010 | 10.043 | 0.001 | 0.510 | 0.001 | 0.047271 | 1 × 10⁻⁶ | 0.047187 | <1 × 10⁻⁶ | 4.74 × 10⁻⁶ |
| 21 | 1598 | 125 | 2.047 | 0.016 | 10.042 | 0.001 | 0.508 | 0.001 | 0.040000 | <1 × 10⁻⁶ | 0.039910 | <1 × 10⁻⁶ | 4.58 × 10⁻⁶ |
| 22 | 1598 | 162 | 2.896 | 0.020 | 10.036 | 0.001 | 0.508 | 0.001 | 0.057405 | 1 × 10⁻⁶ | 0.057218 | 1 × 10⁻⁶ | 5.23 × 10⁻⁶ |
| 23 | 1598 | 200 | 2.490 | 0.011 | 10.046 | 0.002 | 0.533 | 0.004 | 0.051487 | 1 × 10⁻⁶ | 0.051290 | <1 × 10⁻⁶ | 5.28 × 10⁻⁶ |
Note. T: evaporation temperature; t: experimental duration; lC: initial dimension perpendicular to the c plane; lA: initial dimension perpendicular to the a plane; lM: initial dimension perpendicular to the m plane; W0: initial weight; W1: weight after the experiment.
Download table as: ASCIITypeset image
Table 4. Experimental Conditions and Results for Condensation of Corundum
| {0001) | |||||||
|---|---|---|---|---|---|---|---|
| Run# | Tgas | Tsbst | t | Sfront | σSfront | Δw | σw |
| (°C) | (°C) | (hr) | (mm2) | (mm2) | (g) | (g) | |
| 34 | 1705 | 1575 | 56 | 44.714 | 0.098 | 3.21E-05 | 1.1E-06 |
| 35 | 1705 | 1575 | 144 | 31.036 | 0.166 | 6.98E-05 | 9.6E-07 |
| 40 | 1705 | 1575 | 96 | 9.157 | 0.234 | 1.86E-05 | 3.2E-07 |
| 41 | 1705 | 1575 | 48 | 19.795 | 0.230 | 1.90E-05 | 4.7E-07 |
| 44 | 1705 | 1575 | 60 | 21.043 | 0.095 | 1.86E-05 | 4.5E-07 |
| 49 | 1705 | 1575 | 60 | 28.553 | 0.013 | 3.34E-05 | 4.5E-07 |
| 49 | 1705 | 1575 | 60 | 16.708 | 0.126 | 2.12E-05 | 3.2E-07 |
| 52 | 1705 | 1575 | 24 | 69.182 | 0.016 | 2.63E-05 | 9.6E-07 |
| 56 | 1705 | 1575 | 80 | 13.903 | 0.085 | 1.86E-05 | 4.5E-07 |
| 59 | 1705 | 1575 | 24 | 70.232 | 0.021 | 3.70E-05 | 9.8E-07 |
| {11–20} | |||||||
| Run# | Tgas | Tsbst | t | Sfront | σSfront | Δw | σw |
| (°C) | (°C) | (hr) | (mm2) | (mm2) | (g) | (g) | |
| 39 | 1705 | 1575 | 80 | 30.998 | 0.194 | 4.51E-05 | 3.89E-07 |
| 40 | 1705 | 1575 | 96 | 28.225 | 0.054 | 5.04E-05 | 5.48E-07 |
| 41 | 1705 | 1575 | 48 | 19.970 | 0.164 | 2.02E-05 | 3.74E-07 |
| 44 | 1705 | 1575 | 60 | 19.203 | 0.070 | 1.90E-05 | 3.46E-07 |
| 47 | 1705 | 1575 | 60 | 28.075 | 0.042 | 3.43E-05 | 5.21E-07 |
| 47 | 1705 | 1575 | 60 | 12.567 | 0.046 | 1.62E-05 | 3.74E-07 |
| 47 | 1705 | 1575 | 60 | 8.919 | 0.054 | 1.32E-05 | 5.48E-07 |
| 50 | 1705 | 1575 | 24 | 68.970 | 0.011 | 4.90E-05 | 7.49E-07 |
| 51 | 1705 | 1575 | 80 | 28.543 | 0.035 | 5.52E-05 | 4.47E-07 |
| 51 | 1705 | 1575 | 80 | 13.492 | 0.067 | 2.62E-05 | 3.16E-07 |
| 51 | 1705 | 1575 | 80 | 10.489 | 0.014 | 2.12E-05 | 2.00E-07 |
| 58 | 1705 | 1575 | 60 | 70.596 | 0.029 | 1.10E-04 | 6.24E-07 |
| {1–100} | |||||||
| Run# | Tgas | Tsbst | t | Sfront | σSfront | Δw | σw |
| (°C) | (°C) | (hr) | (mm2) | (mm2) | (g) | (g) | |
| 39 | 1705 | 1575 | 80 | 34.715 | 0.053 | 1.37E-04 | 3.89E-07 |
| 40 | 1705 | 1575 | 96 | 29.640 | 0.321 | 1.49E-04 | 5.48E-07 |
| 41 | 1705 | 1575 | 48 | 17.745 | 0.052 | 4.98E-05 | 5.48E-07 |
| 44 | 1705 | 1575 | 60 | 20.739 | 0.013 | 5.94E-05 | 3.16E-07 |
| 48 | 1705 | 1575 | 53 | 27.973 | 0.032 | 8.14E-05 | 7.75E-07 |
| 48 | 1705 | 1575 | 53 | 12.906 | 0.161 | 4.04E-05 | 4.24E-07 |
| 48 | 1705 | 1575 | 53 | 10.389 | 0.089 | 2.88E-05 | 2.00E-07 |
| 53 | 1705 | 1575 | 24 | 70.765 | 0.006 | 9.66E-05 | 1.10E-06 |
| 56 | 1705 | 1575 | 80 | 9.648 | 0.162 | 4.40E-05 | 3.46E-07 |
Note. Tgas and Tsbst: temperatures of the gas source and substrates; t: experimental duration; Sfront: surface area of the front face; Δw: weight change after the experiment.
Download table as: ASCIITypeset image
APPENDIX B: POSSIBLE CAUSES OF ANISOTROPY IN EVAPORATION AND CONDENSATION OF CORUNDUM
Terrestrial corundum generally has scalenohedral shapes elongated to the crystallographic c axis or hexagonal tabular shapes flattened along the c axis. The growth form of corundum is controlled by both surface energy and growth kinetics (Hartman 1980a, 1980b; Mackrodt et al. 1987). The equilibrium and theoretical growth forms of corundum are characterized by developed planes. Synthetic corundum, however, generally develops {0001} planes and does not have developed planes (e.g., Chase & Osmer 1970; Watanabe & Sumiyoshi 1977; Franke & Ghobarkar 1981).


The lowest condensation and evaporation rates of corundum along the c axis would result in the development of the {0001} plane during condensation and evaporation. The appearance of the {0001} plane is explained by the slow growth rate of the (0001) plane due to adsorption of Al atoms. Surface layers of the (0001) plane consist of either Al or O atoms. When the top surface layer of the (0001) plane consists of only Al atoms, which tend to adsorb adatoms due to a high density of long unsaturated bonds, foreign Al adatoms have to be removed for a step to move forward (Hartman 1980a, 1980b). Alternatively, surface relaxation could make the (0001) plane energetically stable (Mackrodt et al. 1987), but Rohl & Gay (1995) showed that it has a negligible effect on the growth morphology of corundum.
The {0001} and faces can be regarded as flat faces that have at least two periodic bond chains (PBCs), which are uninterrupted periodic chains of strong bonds (Hartman & Bennema 1980). On the other hand, the face is a kinked face that has no PBC (Hartman & Bennema 1980). The binding energy of an atom at the kink position is half of the internal atoms, and thus kinks are energetically favored sites for atoms to break bonds or to be incorporated into a crystal lattice.


The anisotropy in evaporation and condensation rates along the c, a, and m axes may also be explained by the difference in the attachment energy, Eatt, which is the energy released when a new slice of thickness dhkl crystallizes on an already existing crystal face (hkl) (Hartman 1980a, 1980b; Hartman & Bennema 1980). The growth rate of a face (hkl) generally increases with the attachment energy, and the linear relation between the growth rate and of a face (hkl) was assumed to determine the relative importance of flat faces and to predict a crystal habit (Hartman 1980a, 1980b; Hartman & Bennema 1980).

The of the c and m faces of corundum are estimated to be 0.69–0.75 times smaller and 2.3–2.6 times larger than that of the a face, respectively (Hartman 1989, references therein). Surface relaxation is a positional change of atoms and ions in the surface layer to reduce the surface energy (Tasker 1984; Mackrodt et al. 1987; Hartman 1989). Even considering the surface relaxation, the of the relaxed c and m faces are 0.45–0.62 times smaller and 1.54–1.89 times larger than that of the a face (Hartman 1989, references therein). The averaged αe and αc of corundum along the c axis obtained in this study are 0.65 and 0.68 times smaller than those along the a axis, whereas the αe and αc of corundum along the m axis are 2.3 and 2.1 times larger than those along the a axis, respectively (Tables 1 and 2). These results are rather consistent with the values of unrelaxed surface models, although Hartman (1989) argued that the effect of surface relaxation is largest at the vacuum–crystal boundary.


In the case of forsterite, the evaporation anisotropy changes when the temperature exceeds the roughening transition temperature of each face of forsterite or when kinetic roughening occurs in the presence of hydrogen gas (Takigawa et al. 2009; Ozawa & Nagahara 2000; Ozawa et al. 2012). The shallow steps observed on the c{0001} and faces of corundum after evaporation at 1680°C–1790°C indicate that evaporation from kinks on the steps was dominant and that thermal roughening does not occur on those surfaces at 1790°C. The presence of such condensation steps also indicates that thermal roughening occurs on neither the {0001} nor faces. Akulenok et al. (1974) observed smooth {0001} and faces with clear steps after evaporation at 2000°C and showed that the order of evaporation anisotropy along the c, a, and m axes is . The same order of anisotropy was observed at lower temperatures in this study. These results indicate that roughening of the c and a faces does not occur even at 2000°C, which is only 50°C below the melting temperature of corundum. Because the m face is a kink face that is covered with kinks (Hartman 1980b), the condensation and evaporation rates of the m face are likely to be the highest at temperatures lower than 1600°C.


