


ABSTRACT
The astronomical emission features, formerly known as the unidentified infrared bands, are now commonly ascribed to polycyclic aromatic hydrocarbons (PAHs). The laboratory experiments and computational modeling done at the NASA Ames Research Center to create a collection of PAH IR spectra relevant to test and refine the PAH hypothesis have been assembled into a spectroscopic database. This database now contains over 800 PAH spectra spanning 2–2000 μm (5000–5 cm−1). These data are now available on the World Wide Web at www.astrochem.org/pahdb. This paper presents an overview of the computational spectra in the database and the tools developed to analyze and interpret astronomical spectra using the database. A description of the online and offline user tools available on the Web site is also presented.
1. INTRODUCTION
The family of emission features, formerly known as the unidentified infrared (UIR) bands, which were discovered in 1973 (Gillett et al. 1973) and attributed to molecular-sized species by Sellgren (1984), is now generally attributed to polycyclic aromatic hydrocarbons (PAHs; e.g., Puget & Leger 1989; Allamandola et al. 1989; van Dishoeck 2004; Peeters et al. 2004a; Draine & Li 2007; Tielens 2008, and references therein). The features that comprise this universal spectrum contain a wealth of information about the physical conditions in the emitting regions and the nature of the PAH carriers (e.g., Joblin et al. 1994; Li & Draine 2001; Hony et al. 2001; Peeters et al. 2002; van Diedenhoven et al. 2004; Mulas et al. 2006; Bauschlicher et al. 2008, 2009; Galliano et al. 2008; Boersma et al. 2009, 2010; Mattioda et al. 2009; Ricca et al. 2010, and references therein). However, exploitation of these features as astrophysical and astrochemical probes has been slow in developing because the IR properties of PAHs under interstellar conditions were largely unknown for at least twenty years after the bands were discovered.
From the early 1990s and onward, experimental and computational data have been collected at the NASA Ames Research Center to test and refine the PAH hypothesis. At this point, there are some 800 experimentally measured and/or theoretically computed spectra in the collection. These spectra have been assembled into a database that currently comprises about 600 theoretically computed spectra spanning 2–2000 μm (5000–5 cm−1) and 200 laboratory measured spectra from 2 to 25 μm (5000–400 cm−1). Besides the computational spectra of species that are also in the experimental collection, the computational set of spectra includes species that could be formed easily in the interstellar medium (ISM) and be quite common in space, yet very difficult to create and measure in a laboratory. This database parallels that described by Malloci et al. (2007), which contains a collection of theoretical spectra and molecular information of 40 PAHs in four different charge states.
This paper describes the information in the NASA Ames PAH IR Spectroscopic Database, focusing on the computational spectra. The collection of experimental spectra will be described elsewhere (A. L. Mattioda et al. 2011, in preparation). The uniform database of collected spectra, currently at version 1.11, is accessible on the Web at www.astrochemistry.org/pahdb. Tools that allow the user to (1) interrogate the database, (2) plot, compare, and co-add spectra, and (3) adjust parameters such as bandwidth, etc., are also available at this site. The database can also be downloaded in its entirety along with software to work with it. Newly developed tools and new sets of spectra will be added to the database periodically and the version number will be updated accordingly.
We ask that those who use the theoretical or experimental information in the PAH IR Spectroscopic Database refer to this paper or the experimental database paper (A. L. Mattioda et al. 2011, in preparation), as appropriate, as this will justify site maintenance. First time users will be asked to provide their contact information enabling us to send updates when data and tools are added to the Web site.
The paper is outlined as follows. Section 2 introduces the computational method (Section 2.1) and the content of the computational PAH database (Section 2.2). In Section 3, (Web-)access to the database is discussed. Section 4 demonstrates the use of the database to interpret astronomical data with the tools available at the Web site. The paper is concluded in Section 5. In the Appendix, a detailed account of modeling the single photon excitation process and subsequent emission spectrum is given.
2. THE COMPUTATIONAL PAH DATABASE
2.1. Computational Method
The synthetic spectra in database, version 1.11, have been computed using density functional theory (DFT) predominantly making use of the hybrid (Becke 1993) B3LYP (Stephens et al. 1994) approach in conjunction with the 4-31G basis set (Frisch et al. 1984). While the B3LYP/4-31G approach has been successfully applied to almost 600 species, for a few of the open-shell systems, the B3LYP functional yields unexpected results, such as a total intensity that is significantly larger than that for other species of the same size and the same charge, or an intensity of a single band that is much larger than the intensity of an analogous band in similar species. This can occur when a molecule has two electronic states with essentially the same energy and becomes more common with increasing PAH size. For the fluoranthene (C16H10) cation, the B3LYP calculation produced a spectrum with an exceptionally large intensity that did not agree well with experiment, whereas using the Becke–Perdew86 (BP86; Becke 1988; Perdew 1986) functional (with a scale factor of 0.986) yielded results that were consistent with experiment (Bauschlicher et al. 1999). In those few cases where the B3LYP appeared unreliable, the database contains the scaled BP86 results
In both approaches, geometries are fully optimized and harmonic frequencies are computed using analytic second derivatives. All of the DFT calculations are performed using the Gaussian 03 program system (or earlier versions; Frisch et al. 2004).
DFT-calculated frequencies differ systematically from experiment and need to be scaled (Bauschlicher & Langhoff 1997). The scaling factor depends on the level of theory (the correlation treatment and basis set), and it is common that C–H stretches will have a different scaling factor from the non-C–H stretch modes (i.e., all the bands excluding the C–H stretching modes) because of the large anharmonic effects for hydrogen stretching motions.
Comparing several computed spectra with the spectra of the same species measured using laboratory matrix isolation techniques shows that at the B3LYP/4-31G level of theory a single scale factor of 0.986 brings both the computed C–H stretching and non-C–H stretching modes into good agreement with experiment. The accuracy of these scaled frequencies has been tested for many molecules, and overall, most of the computational and experimental peak positions fall within 5 cm−1 of each other, a few within 15 cm−1; and in the worst cases, we have found a few bands that differ by up to 30 cm−1 (Langhoff 1996; Bauschlicher & Langhoff 1997). Intensities are unscaled, despite the potential factor of 2 overestimation of the computed intensity for the C–H stretching modes for neutrals (Bauschlicher & Langhoff 1997; Hudgins et al. 2001). Figure 1 compares the ∼3–20 μm (3200–500 cm−1) spectrum of neutral coronene computed using DFT at the B3LYP level to the spectrum of its matrix-isolated counterpart. This figure demonstrates the good agreement between the theoretically computed and experimentally measured mid-IR spectra; we should note here that the agreement for most other species is generally somewhat better.

Figure 1. Computed integrated cross sections of coronene (theoretical) compared to the absorbance (−log(I/I0)) spectrum of coronene isolated in an argon matrix at 15 K (laboratory). The two horizontal brackets indicate the 5–6 μm region. The PAH bands here are due to overtone and combination modes, which are not computed when using the harmonic approximation (Boersma et al. 2009). The two stars indicate contributions from matrix-isolated water impurities.
Download figure:
Standard image High-resolution image2.2. The Content of the Computational PAH Database
About 600 spectra from a large variety of PAHs are currently in the computational database. They cover a range in size from 6 to 130 carbon atoms. For most molecules, spectra were calculated for their neutral as well as their singly charged (±) states. The spectra of multiply charged PAHs were calculated for a handful of molecules. While "pure" PAHs comprised of only carbon and hydrogen dominate the database, PAHs containing nitrogen, oxygen, and silicon; PAHs with side groups; PAHs with extra hydrogens; and PAHs complexed with metal ions are also included. Table 1 shows the distribution of molecules in the database, broken down by size, charge, and composition. The information is presented graphically in Figures 2 and 3, which show the size breakdown by composition and charge, respectively. Figure 4 summarizes the charge and PAH-type distribution of PAHs in the complete database in two pie charts. The database also includes molecular information such as the optimized geometry, mass, zero-point vibrational energy, total energy, symmetry, and hydrogen adjacency classes (the number of neighboring hydrogens on a peripheral aromatic ring) for each species. The downloadable geometries are those used to compute the vibrational frequencies and hence should be consulted when interpreting the symmetry labels of the vibrational modes. The comment field describes the original orientation used for the calculation of the frequencies to help understand the modes without downloading geometries. We should note that molecules on the Web have been rotated to a consistent orientation that gives the easiest viewing of the molecules, i.e., the molecules "lay flat" on the screen. The downloadable geometries for versions 1.00 and 1.10 correspond to these rotated geometries and should not be used to interpret the vibrational modes.

Figure 2. Size distribution, in terms of the number of carbon atoms, of the PAHs in the computational database by composition; "pure" PAHs contain only carbon and hydrogen, nitrogen/oxygen/magnesium and iron refer to PAHs containing these elements as well.
Download figure:
Standard image High-resolution image
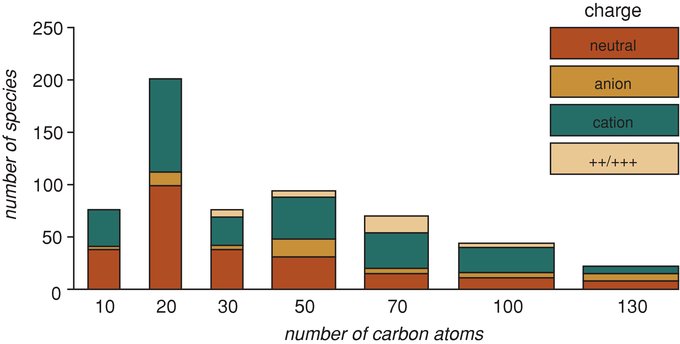
Figure 3. Charge distribution by size, in terms of the number of carbon atoms, of the PAHs in the computational database.
Download figure:
Standard image High-resolution image
Figure 4. Percentages of charge composition and types of PAHs in the computational database. Nitrogen refers to PAHs containing one or two nitrogen atoms in the hexagonal framework, "pure" refers to PAHs comprised solely of carbon and hydrogen, oxygen refers to PAHs containing one or more oxygen atoms, mostly in side groups, and other refers to PAHs containing other metals complexed to the hexagonal framework, e.g., magnesium, iron, etc.
Download figure:
Standard image High-resolution imageTable 1. Breakdown of the Molecules in Version 1.10 of the Computational Database by Charge, Composition, and Size
| Number of carbon atoms | ||||||||
|---|---|---|---|---|---|---|---|---|
| Charge | 1–130 | 1–10 | 11–20 | 21–30 | 31–50 | 51–70 | 71–100 | 101–130 |
| All molecules | ||||||||
| All | 583 | 76 | 201 | 76 | 94 | 70 | 44 | 22 |
| Neutral | 240 | 38 | 99 | 38 | 31 | 15 | 11 | 8 |
| Anion − | 54 | 3 | 13 | 4 | 17 | 5 | 5 | 7 |
| Cation + | 256 | 35 | 89 | 27 | 40 | 34 | 24 | 7 |
| ++/+++ | 33 | 0 | 0 | 7 | 6 | 16 | 4 | 0 |
| PAHs with only carbon and hydrogen | ||||||||
| All | 359 | 26 | 111 | 49 | 79 | 42 | 30 | 22 |
| Neutral | 157 | 11 | 56 | 26 | 30 | 15 | 11 | 8 |
| Anion − | 50 | 3 | 9 | 4 | 17 | 5 | 5 | 7 |
| Cation + | 128 | 12 | 46 | 15 | 26 | 12 | 10 | 7 |
| ++/+++ | 24 | 0 | 0 | 4 | 6 | 10 | 4 | 0 |
| PAHs with nitrogen | ||||||||
| All | 111 | 10 | 48 | 18 | 9 | 18 | 8 | 0 |
| Neutral | 37 | 5 | 22 | 10 | 0 | 0 | 0 | 0 |
| Anion − | 4 | 0 | 4 | 0 | 0 | 0 | 0 | 0 |
| Cation + | 64 | 5 | 22 | 8 | 9 | 12 | 8 | 0 |
| ++/+++ | 6 | 0 | 0 | 0 | 0 | 6 | 0 | 0 |
| PAHs with oxygen | ||||||||
| All | 84 | 40 | 42 | 0 | 0 | 2 | 0 | 0 |
| Neutral | 43 | 22 | 21 | 0 | 0 | 0 | 0 | 0 |
| Anion − | 0 | 0 | 0 | 0 | 0 | 0 | 0 | 0 |
| Cation + | 41 | 18 | 21 | 0 | 0 | 2 | 0 | 0 |
| ++/+++ | 0 | 0 | 0 | 0 | 0 | 0 | 0 | 0 |
| PAHs with magnesium or iron | ||||||||
| All | 27 | 4 | 0 | 4 | 4 | 4 | 6 | 1 |
| Neutral | 0 | 0 | 2 | 0 | 0 | 0 | 0 | 0 |
| Anion − | 0 | 0 | 0 | 0 | 0 | 2 | 1 | 0 |
| Cation + | 21 | 2 | 0 | 2 | 4 | 4 | 6 | 0 |
| ++/+++ | 2 | 0 | 0 | 2 | 6 | 4 | 0 | 0 |
Download table as: ASCIITypeset image
In spite of its size, as with databases in general, there are limitations. All transitions correspond to fundamental vibrational modes, not hot bands, overtones, or combination bands. Although the species in the sample span a wide size range, as shown in Figures 2 and 3 and Table 1, more than half of the PAHs contain fewer than 21 carbon atoms, about 25% contain between 25 and 50 carbon atoms, and some 20% span the range from 50 to 130 carbon atoms. This distribution reflects the history of computational capabilities over the past 25 years. Initially, it took roughly three weeks of CPU time to compute the spectrum of coronene (C24H12) on a workstation. Due to improvements in computational methods and in computing power, it is now possible to compute the spectra of PAHs containing more than one hundred carbon atoms in reasonable amounts of time. Figures 3 and 4 and Table 1 show that the vast majority of the PAHs in the computational database are neutral and positively charged, while negatively charged PAHs comprise less than 10% of the database. This aspect reflects historical interest. Current studies focus on increasingly larger PAH species, where the neutral, cation, and anion forms are routinely determined. When these new sets of spectra become available, they will be added to the database and the version number will be updated.
As an illustration of the type of information available for each species, Figure 5 presents an overview of some of the information in the computational database for coronene (C24H12). Due to the complexity of large PAHs, chemical names are only available for a small number of the PAHs in the database.

Figure 5. Screen shot displaying the available information in the database for coronene, illustrating the content and presentation of the first screen for each species.
Download figure:
Standard image High-resolution imageThe spectroscopic data in the database can be downloaded in various forms. The scaled frequency, ν(cm−1), the integrated absorption cross section, σ0,ν(km mol−1), and symmetry are given for each transition. As an example, these are 863.9 cm−1, 175.63 km mol−1, and B3u for the strongest mode in coronene.
3. DATABASE AND (WEB-)ACCESS
The computational spectra have been gathered into a database with accompanying tools that allow the user to survey the spectra as well as convert them to emission spectra on the site itself. Individual spectra or the entire database can be downloaded in XML format. The Web site that hosts the data and allows the user to perform certain operations also provides a set of IDL scripts and object classes that simplify tasks for users working with the downloaded database on their own machine. First time users will be asked to provide their contact information to enable us to send updates to the database and Web site.
The Web-portal allows access to the database and provides tools to search the data and work with the spectra. Web-technologies such as PHP and MySQL are used to facilitate fast and reliable access. The most computationally intensive tasks are the generation of the synthetic spectra when using the tools. Therefore, these have been implemented in C++, around a framework that allows newly developed tools to be easily added.
A quick survey of the site follows. The Web-portal (Figure 6(a)) allows users to find and select data with simplified queries. For example, the search string "carbon >10 and carbon <50 and nitrogen >0 and charge = 0," will return the spectra of the neutral PAH molecules that have more than 10 and less than 50 carbon atoms and 1 or more nitrogen atoms. The search engine also handles alternative phrasings.

Figure 6. Four screen shots of the Web-portal demonstrating the "welcoming screen" (a), the "search result window" (b), the "tool window" (c), and the "results window" (d). See Sections 3 and 4 for details.
Download figure:
Standard image High-resolution imageAn "advanced search" is available, which adds wider search criteria such as seeking bands in a certain wavelength range and greater than a given intensity. The outcome of the search is a list of two-dimensional molecular structures and spectra (Figure 6(b)). Additional information including rotatable three-dimensional structures, references to the literature (when available), comparison with the counterpart experimental data, transition tables, an interactive spectrum, and molecular properties are also available for each PAH molecule.
Once a set of spectra is selected, several tools are available with which one can work with the data (example shown in Figure 6(c)). Since the computations provide the integrated cross sections for the transitions in an individual molecule, these are equivalent to absorption spectra. These transition frequencies must be convolved with a specific band shape, line width, and emission temperature to convert them into an emission spectrum (see the Appendix). Lorentzian band shapes are used, while the line width, emission temperature, and desired spectral window can be specified by the user. A tool that can co-add individually weighted spectra and two tools that compare spectra in a stack plot are available. Of these last two, the first is capable of comparing up to 10 different PAH spectra directly and the second allows one to compute up to 5 different emission spectra, corresponding to 5 different emission temperatures, of a single species. The resulting spectra are presented together with those from earlier exercises to allow comparison. For example, Figure 6(d) shows the result of co-adding uniformly weighted spectra of the species selected in Figure 6(b). Summarizing, the four screen shots in Figure 6 demonstrate the "welcoming screen," "search result window," "tool window," and "result window."
The IDL scripts and object classes also provided through the site simplify using the database when one downloads the database. These include operations such as reading of the XML data, plotting spectra to the screen and/or a file, convolving spectra, co-adding spectra, and applying an emission temperature to the spectrum as a single blackbody temperature which depends on the absorbed energy and heat capacity of the molecule (see the Appendix). The online search algorithms are available and IDL object graphics provide rotatable three-dimensional structures. Listing 1 shows an IDL code snippet demonstrating how the absorption spectrum of coronene can be converted into an emission spectrum for comparison with astronomical observations. The results of Listing 1 are shown in Figure 7. The IDL scripts and object classes also allow one to implement additional tools that are not available on the Web site.

Figure 7. Converting the coronene absorption spectrum into an emission spectrum for comparison with an astronomical PAH spectrum. These are the three resulting plots from the code snippet in Listing 1. Left: stick absorption spectrum of coronene. Middle: stick emission spectrum of coronene after absorbing a 4 eV photon, corresponding to a temperature of 1001 K. Right: emission spectrum of coronene with the bands convolved with Lorentzian profiles having an FWHM of 30 cm−1. See Section 3 and the Appendix for details.
Download figure:
Standard image High-resolution imageBelow we List one IDL code snippet. Screen shots of the results are shown in Figure 7.
- ; read in the database XML file
- interface = OBJ_NEW('AmesPAHInterface',
- File = 'theoretical.xml')
- ; get the integrated cross–sections for coronene
- transitions = interface–>GetTransitionsById (18)
- ; plot the stick spectrum
- transitions–>Plot
- ; calculate the emission spectrum at the
- ; temperature reached after absorbing a 4 eV
- ; (CGS units) photon
- transitions–>Temperature,4D * 1.603D-12
- ; plot the stick spectrum at that temperature
- transitions–>Plot
- ; convolve the bands with a Lorentzian with
- ; FWHM of 30 cm^−1
- convolved = transitions–>Convolve(FWHM=30D)
- ; plot the convolved spectrum
- convolved–>Plot
- ; clean up
- OBJ_DESTROY,[convolved, transitions, interface]
4. APPLYING THE DATABASE AND TOOLS TO ASTRONOMICAL SPECTRA
In this section, using tools available at the Web site, we demonstrate how one can extract spectra from the database to compare with astronomical observations. For the purpose of this illustration, the role of size and charge on the spectra of PAHs in three separate size ranges: C16–C60, C60–C90, and C90–C130 are explored.
For the group of molecules with less than 60 carbon atoms, one obtains a screen similar to that in Figure 6(b). For this example, the spectra of this subset of species are co-added (uniformly weighted) to facilitate comparison between the effects of size and charge on the spectra of different PAH mixtures. To do so, one selects "tools" from the navigation menu, obtaining the "tool window" shown in Figure 6(c). Here, the user starts by specifying bandwidth, wavelength range in μm or cm−1, and emission temperature. For this example, 20 cm−1 is chosen for the Lorentzian bandwidth (FWHM), 5–15 μm for the wavelength range, and the option to include an emission temperature is disregarded. By choosing "co-add" and "uniform" as the weighting scheme, all spectra are summed uniformly weighted. The resulting spectrum appears in the "results window," (e.g., Figure 6(d)), where it can be saved, printed, and/or downloaded.
Repeating this sequence with the search strings appropriate for the C60–C90 and C90–C130 range, one obtains the co-added spectra of the species in each of the other two PAH size ranges. By adding "charge = −1" and "charge = 1" to the search string for each size range, one obtains the resulting spectra of the anion and cation forms of these PAHs, respectively. Figure 8 presents the spectra produced after selecting the "Download Postscript" button and arranging them by size and charge.

Figure 8. Co-added (uniformly weighted) spectra produced after querying the PAH spectral database by size and charge. Column 1 shows the spectra produced by co-adding uniformly weighted spectra of all PAHs in the database containing between 16 and 60 carbon atoms broken down by charge. The panels show how each uniformly weighted co-added spectrum depends on PAH charge from neutral (top) to anion (middle) to cation (bottom). Columns 2 and 3 show the corresponding spectra for the PAHs in the database containing between 60 and 90, and more than 90 carbon atoms, respectively.
Download figure:
Standard image High-resolution imagePerusal of the spectra in Figure 8 shows that the co-added (uniformly weighted) spectrum of the largest PAHs comes the closest to resembling the salient features of the astronomical PAH emission spectrum and, of these, the cation and anion forms are most in agreement with the relative intensity of the astronomical bands between 5 and 10 μm. Neutral PAHs appear to be required to account for the astronomical 11.2 μm band intensity.
To illustrate the "stack-tool," we focus on the 10–15 μm region. To look deeper into the spectroscopic details of the 10–15 μm spectra of PAHs in this size range, one returns to the "results window." Focusing on the cations, Figure 9 compares the individual spectra from the set making up the largest molecules. The figure is obtained using the "stack" tool in the "tools window," Figure 6(c). The PAH structures and their corresponding spectra in Figure 9 illustrate the important role PAH edge structure plays in determining the details in the 10–15 μm region (Hudgins & Allamandola 1999; Hony et al. 2001). Figure 9 shows that large PAHs with the most symmetric, compact structures have spectra in the 10–15 μm region which most closely resembles that of the astronomical emission spectrum, while large PAHs with irregular edge structures fail to reproduce the main aspects of the observed spectrum. A full discussion of the complete mid-IR spectroscopic properties of these large PAHs and their application to the astronomical problem is given in Bauschlicher et al. (2008, 2009).

Figure 9. "Stack" plot for the species found with the search string "C > = 90 N = 0 O = 0 Fe = 0 Si = 0 Mg = 0 charge = 1."
Download figure:
Standard image High-resolution imageThe role temperature plays in determining the emission spectrum can also be investigated using the tools on the site or downloading the IDL-suite. The Web site implements the approach by multiplying every band with the blackbody intensity at a given excitation temperature (see the Appendix). The effect of temperature will be most important for relative band intensities. Figure 10 compares the synthesized absorption spectrum of coronene with its emission spectrum at 1001 K, corresponding to the temperature attained after absorption of a 4 eV photon (see the Appendix).

Figure 10. Comparison of the synthesized absorption spectrum of coronene (bottom frame) with its emission spectrum after absorption of a 4 eV photon, both when approximating the attained temperature (at 1103 K) and exactly calculating the attained temperature (at 1001 K).
Download figure:
Standard image High-resolution image5. SUMMARY
The family of astronomical emission features at 3.3, 6.2, 7.7, 8.6, and 11.2 μm, formerly known as the UIR bands, is now generally attributed to PAHs. Laboratory experiments and computational modeling at the NASA Ames Research Center generated a large collection of PAH IR spectra relevant to test and develop the PAH hypothesis. These have been assembled into a spectroscopic database. This database now contains over 800 PAH spectra spanning 2–2000 μm (5000–5 cm-1).
This paper describes the computational spectra in the database and the user tools accessible on the Web at www.astrochemistry.org/pahdb. These tools allow the user to review and download the spectra in the database as well as to work with the spectra online or with more extensive tools which can also be downloaded. First time users will be asked to provide contact information which will be used to send updates as new data and tools are added to the Web site. We ask that those who use the theoretical or experimental information in the NASA Ames PAH IR Spectroscopic Database refer to this paper or the experimental database paper (A. L. Mattioda et al. 2011, in preparation), as appropriate, as this will justify site maintenance.
We express our sincere appreciation to the anonymous referee who very carefully read the manuscript, explored the Web site and made very detailed suggestions to improve both. The changes we have made in response to the referee's comments and suggestions significantly improved the paper and Web site. We also acknowledge the critical contributions of J. D. Smith, Will Costa, and Aigen Li who tested the Web site and whose suggestions have also led to significant improvements. This work was supported through NASA's Astrophysics Data Analysis, Astrophysics Theory and Fundamental Physics, Long Term Space Astrophysics, Laboratory Astrophysics, Astrobiology and The Spitzer Space Telescope Archival Research Programs. C.B. acknowledges support from the Netherlands Organization for Scientific Research (NWO; grant R 78405). F.S.d.A. and G.P.S. acknowledge support from the INTEGRANTS program, sponsored by the Spanish Ministry of Science and Innovation. G.P.S. also thanks for the additional financial support from the NASA Astrophysics Data Analysis program. Finally, we are extremely grateful to Xander Tielens for many insightful discussions on astronomical PAHs and encouragement during the long course of this work.
APPENDIX: CONVERTING ABSORPTION SPECTRA INTO EMISSION SPECTRA
When comparing astronomical emission spectra to computed PAH absorption spectra, band shape, natural line width, band shifts inherent to the emission process, and relative band intensities must be taken into account. Each of these is discussed in the following.
Band shape. Two schools of thought exist on the origin of the observed emission band shapes. All agree that true isolated harmonic oscillators have Lorentzian emission profiles. One school also considers Lorentzian profiles as the final composite profile of the astronomical emission features. However, since intermolecular energy transfer is fast compared to emission timescales, the emitting atoms of an individual PAH molecule find themselves in a constantly changing interaction potential. This leads to anharmonic shifts in peak position, that likely contributes to the red-shaded, distinctly non-Lorentzian, observed profiles (Barker et al. 1987; Cook & Saykally 1998; Pech et al. 2002). The other school considers Gaussian emission profiles. In this approach, the astronomical PAH features are believed to be the blending of slightly different relatively narrow Lorentzian profiles. The peak positions of the harmonic oscillators contributing to a feature are then randomly distributed around a mean position. This requires the presence of a large and diverse family of PAH molecules. Support for both schools of thought exist (cf. Tielens 2008). Consistent with both schools, we adopt a Lorentzian profile for each PAH individual transition:

where Γ(cm−1) is the FWHM and νi(cm−1) is the frequency of mode i.
Line width. The FWHM of the profiles observed in astronomical spectra vary substantially for the different wavelength regions. For the mid-IR PAH emission features, a line width of 10–30 cm-1 is characteristic (see Peeters et al. 2004b), while for the bands between 15 and 20 μm, a range between 4 and 8 cm-1 is more typical (e.g., van Kerckhoven et al. 2000; Moutou et al. 1998; J. Cami 2011, in preparation). Depending on the wavelength region considered, those values are adopted here in Figures 8 and 10.
Band position. Since a small (anharmonic) redshift is intrinsic to the emission process, a redshift must be applied to the computed absorption spectra. A value of 15 cm−1 is consistent with the shifts measured in a number of experimental studies in the mid-IR (Cherchneff & Barker 1989; Flickinger et al. 1990, 1991; Colangeli et al. 1992; Brenner & Barker 1992; Joblin et al. 1995; Williams & Leone 1995; Cook & Saykally 1998). Recently, this has been summarized by Bauschlicher et al. (2009). However, the PAH emission process is complicated and not yet fully understood and 15 cm−1 may be somewhat overestimated. In reality, the redshift depends on the (non-constant) anharmonicity of the individual mode's contribution to the emission and can be different for each mode and molecule. Therefore, no single "true" value can be given for the redshift and this uncertainty has to be kept in mind when evaluating the results. Here, the computed spectra in Figure 10 are not red shifted.
Relative band intensities. Relative emission band intensities depend on the excitation energy (temperature) and should also be taken into account when considering the entire mid-IR emission spectrum. Several approaches exist (Puget & Leger 1989; Allamandola et al. 1989), the most simple approximation being multiplying the intensity in each mode with a blackbody at an average emission temperature:

where νi(cm−1) is the frequency of mode i, is the average emission temperature, h(erg s) is Planck's constant, c(cm s−1) is the speed of light, and k(erg K) is Boltzmann's constant. In the following section, a slightly more sophisticated model is described in which the heat capacity of the individual PAH is taken into account to determine the emission temperature.

A.1. Single Excitation Photon, Single PAH Emission Model
Although several, generally more sophisticated, models could be conceived, here the focus is on the single excitation photon, single PAH emission process. Given the current state of our knowledge regarding the molecular physics of the emission process and the very large number of different PAHs involved, a detailed, more sophisticated model is not warranted at this time.
The attained temperature of the PAH molecule is directly related to the energy of the absorbed ultraviolet/visible photon through the following relation:

where CV(T) ≡ [dE/dT]V(erg K−1) is the heat capacity of the PAH.
The heat capacity of a molecular system is given, in terms of isolated harmonic oscillators, by

where g(ν) is known as the density of states and describes the distribution of vibrational modes. Due to the discrete nature of the modes, the density of states is just a sum of δ-functions, which turns the improper integral into a finite sum:

where n is the number of modes.
Given that the database contains all n vibrational modes, a closed mathematical system is obtained and the spectrum can be calculated precisely. This is what has been made implemented in the IDL-suite, used to make, for example, Figure 10, which can be obtained from the "download window." One can also choose to approximate the heat capacity using overall PAH properties. One approach is that by Stein (1978), i.e., the group additive method. This approach has been further worked out by Dwek et al. (1997) and resulted in the following approximation, valid for T ⩽ 2000 K:

where NC is the number of carbon atoms constituting the PAH molecule. Making use of a root finding algorithm, the indefinite integral form of this relation can be used to calculate the maximum attained temperature:

where Erf is the error function.
The initial PAH temperature is taken to be 2.73; the temperature of the cosmic microwave background. It should be noted though, that in astrophysical environments, the background temperature is likely to be somewhat higher, but still low. However, a PAH molecule at such low temperatures contributes little to the overall emission. For the absorbed ultraviolet/visible photon, an average value , representative for the (inter)stellar radiation field considered, should be taken. Keep in mind that any estimate of the average energy of absorbed photons by a PAH requires knowledge of (and/or assumptions about) the ambient UV/VIS/NIR radiation field and the photo-absorption cross section of the given PAH. See Li & Draine (2001) and Draine & Li (2007) for an approximation of the UV/VIS absorption cross sections for PAHs; Mattioda et al. (2005b) for an experimental study of the NIR absorption properties of ionized, moderately sized PAHs; and Mattioda et al. (2005a) for a modification of the Draine & Li approximation to include PAH NIR absorption properties.

For the following example, we do not consider the entire absorption cross section nor a UV/VIS/NIR pumping radiation field. Rather, we consider the case of an individual PAH excited by a 4 eV photon to illustrate the method. A 4 eV photon is used as an estimate of the vibrational energy content of the molecule that is more properly determined by taking the whole cooling cascade into account. In such a cascade, different bands are preferentially emitted at different temperatures as the molecule relaxes. We are currently developing tools to allow the user to compute the full cascade emission spectrum from a given PAH and expect to add it to this site by the end of 2010. Here, we take 4 eV as a compromise between an initial interstellar excitation photon of, say, 8–10 eV and the final energy content of the molecule (a fraction of an eV) after most of the emission cascade has occurred.
Having put together a model framework, let us apply it to neutral coronene (Figure 5). Upon the absorption of a 4 eV photon, its maximum attained temperature equals 1001 K and 1103 K when exactly calculating the full heat capacity and when using the approximation from Dwek et al. (1997), respectively. The approximations are less computationally intense and therefore, require less CPU time. Comparing the emission spectrum obtained using the exact method to that with the approximation in Figure 10 shows the approximation is reasonably good.
The effect of the cascade is particularly important for far-IR bands, which are expected to dominate the emission near the end of the cooling cascade. PAHs that are not sufficiently highly excited to emit in the mid-IR can only relax via emission of their far-IR modes (C. Boersma et al. 2011, in preparation).