

Abstract
Histotripsy, a form of therapeutic ultrasound that uses the mechanical action of microbubble clouds for tissue ablation, is under development to treat chronic deep vein thrombosis (DVT). We hypothesize that combining thrombolytic agents with histotripsy will enhance clot lysis. Recombinant tissue plasminogen activator (rt-PA) and rt-PA-loaded echogenic liposomes that entrain octafluoropropane microbubbles (OFP t-ELIP) were used in combination with highly shocked histotripsy pulses. Fully retracted porcine venous clots, with similar features of DVT occlusions, were exposed either to histotripsy pulses alone (peak negative pressures of 7–20 MPa), histotripsy and OFP t-ELIP, or histotripsy and rt-PA. Microbubble cloud activity was monitored with passive cavitation imaging during histotripsy exposure. The power levels of cavitation emissions from within the clot were not statistically different between treatment types, likely due to the near instantaneous rupture and destruction of OFP t-ELIP. The thrombolytic efficacy was significantly improved in the presence of rt-PA. These results suggest the combination of histotripsy and rt-PA could serve as a potent therapeutic strategy for the treatment of DVT.
Export citation and abstract BibTeX RIS
Introduction
Deep vein thrombosis (DVT) is a major public health problem, affecting 5% of the population (Wells et al 2014) with an estimated $10 billion healthcare cost in the United States (Grosse 2012). The standard of care for DVT is anticoagulation therapy (Beckman et al 2010). Acute thrombus formation can occur in hypercoagulable patients (Patel et al 2000). The most severe acute consequence of DVT is phlegmasia cerulea dolens, a critical obstruction of iliofemoral venous return, which is prevalent in 4% of DVT patients (Lin et al 2005, Oguzkurt et al 2012). Clinical presentation of phlegmasia cerulea dolens requires amputation in 15% of patients due to venous gangrene (Patel et al 1998), and has a 25% mortality rate (Hood et al 1993, Lin et al 2005). For critical venous obstructions, catheter-directed thrombolytic drugs (Augustinos 2004) are the frontline therapy for recanalization (Kalagher and Kane 2014). However, thrombi formed in the deep veins have chronic components that are fibrous and stiff (Hirsh and Hoak 1996), retracted (Strandness and Van Breda 1994), and unresponsive to thrombolytic drugs (Weisel 2007). Mechanical embolectomy as an adjuvant to catheter-directed thrombolytics has also been employed for the treatment of DVT (Mumoli et al 2012). Chronic thrombi can fragment during mechanical embolectomy (Marder et al 2006, Kassas 2013, Worku et al 2015), causing incomplete thrombus removal (Donaldson et al 2015), pulmonary embolization, and a high likelihood of re-thrombosis (Watson et al 2009). Improved clinical outcomes and a reduction in re-thrombosis are associated with the complete removal of the thrombus (Aziz and Comerota 2012, Gibson et al 2014, Avgerinos et al 2015).
Histotripsy is a form of therapeutic ultrasound that employs the mechanical action of microbubble clouds to ablate tissue (Xu et al 2006), including thrombi (Zhang et al 2015b). The development of histotripsy to ablate thrombi appears promising in vitro (Maxwell et al 2009). Recanalization with histotripsy was demonstrated successfully in only 7 of 12 thrombi in a porcine femoral DVT model in vivo (Maxwell et al 2011a). Residual thrombus is associated with increased rates of post thrombotic syndrome (Avgerinos et al 2015), and reoccurrence of thrombus formation in DVT (Watson et al 2009). Histotripsy as a stand-alone therapy neglects the known synergy between ultrasound and thrombolytic drugs (Bader et al 2015a). The addition of a thrombolytic would further break down thrombus debris generated during the histotripsy ablation, minimizing the potential for pulmonary embolism or thrombogenic particulates.
Echogenic liposomes (ELIP) have previously been developed as a carrier for therapeutic drugs (Laing et al 2012). Thrombolytic-loaded ELIP (t-ELIP) target fibrin (Tiukinhoy-Laing et al 2007), and can be acoustically activated for localized drug delivery (Shaw et al 2009a, Smith et al 2010). Encapsulation of the thrombolytic drug recombinant tissue plasminogen activator (rt-PA) may reduce systemic toxicity compared to direct intravenous injection (Turi et al 1993), and protect rt-PA from plasminogen activator inhibitors present in vivo (Shaw et al 2007). Gas microbubbles entrained within ELIP can act as cavitation nuclei (Bader et al 2015b), and may serve as sites for shock wave scattering to initiate microbubble cloud formation (Tran et al 2005).
The objective of this study is to determine the thrombolytic efficacy of histotripsy in combination with rt-PA or t-ELIP for simultaneous mechanical ablation and enzymatic lysis of venous porcine clots in vitro. A new formulation of t-ELIP encapsulating octafluoropropane (OFP) gas microbubbles was employed. This high molecular weight gas is thought to promote sustained microbubble activity for ultrasound enhancement of thrombolysis (Bader et al 2015b). The number density, shell properties, and enzymatic activity of rt-PA-loaded ELIP entrained with OFP microbubbles, OFP t-ELIP, were characterized. Thrombolytic efficacy for ablation of venous porcine blood clots was evaluated with and without OFP t-ELIP or with and without rt-PA. The spatial location and power of cavitation activity were gauged using passive cavitation imaging (Gyöngy et al 2008, Salgaonkar et al 2009, Haworth et al 2012). Finally, the expansion of OFP t-ELIP under excitation by a histotripsy pulse was investigated by numerical integration of the Marmottant model (Marmottant et al 2005) and compared to an analytic model for endogenous cavitation nuclei (Bader and Holland 2016).
Materials and methods
Venous clot formation
Porcine venous blood was collected aseptically from donor hogs (Lampire Biologicals, Pipersville, PA USA), anticoagulated with a citrate–phosphate–dextrose solution (final concentrations in blood: 16.1 mM sodium citrate, 17.6 mM D-glucose, 1.96 mM citric acid, and 2.3 mM NaH2PO4) and shipped on ice overnight to the University of Cincinnati. Before coagulation, the blood was incubated at 37.3 °C for 20 min while exposed to room air to equilibrate gas content, as confirmed with a dissolved oxygen meter (DO110, Oakton Instruments, Vernon Hills, IL USA). The blood was recalcified with CaCl2 to a final concentration of 16.1 mM and mixed with BaSO4 (11.1% w/v), a radio-opaque agent that allows for visualization of the clot under computed tomography angiography. The blood/BaSO4 solution was pipetted into a borosilicate glass Pasteur pipet (Fisher Scientific, Pittsburgh, PA USA) primed with bovine thrombin (13.2% v/v). The pipets were incubated at 37.3 °C for 3 h during coagulation, and placed in a laboratory refrigerator at 4 °C for a minimum of 3 d before experimental treatment to allow for consistent clot retraction. The clot diameter was 4.05 ± 0.35 mm, and clots were cut to 1 cm length prior to treatment. These methods of clot formation were similar to those implemented in other thrombolysis studies (Datta et al 2006, Holland et al 2008, Hitchcock et al 2011, Sutton et al 2013). Furthermore, rt-PA lytic efficacy of these fully retracted clots was limited (9.4 ± 1.5% mass loss), similar to the chronic thrombi found in DVT.
Preparation of rt-PA
Recombinant tissue-type plasminogen activator (rt-PA) was obtained from the manufacturer (Activase®, Genentech, San Fransisco, CA, USA) as lyophilized powder. Each vial was mixed with sterile water to a concentration of 1 mg ml−1 per manufacturer instructions, aliquoted into 1.0 ml centrifuge tubes, and stored at −80 °C. The enzymatic activity of rt-PA is stable over a period of at least 7 years using this protocol (Shaw et al 2009b).
OFP t-ELIP formulation
ELIP were prepared at the University of Texas Health Sciences Center (Houston, TX, USA) using methods similar to those previously reported (Laing et al 2012). The lipid composition was DPPC:DOPC:DPPG:Chol in a 46:23:23:8 molar ratio (DPPC = 1,2-dipalmitoyl- sn-glycero-3-phosphocholine; DOPC = 1,2-Dioleoyl-sn-glycero-3-phosphocholine; DPPG = 1,2-dipalmitoyl-sn-glycero-3-phosphoglycerol; Chol = Cholesterol). Component lipids were dissolved in chloroform and the solution evaporated. The resulting film was placed under vacuum for complete removal of the chloroform overnight, and then rehydrated with 200 μl of rt-PA (1 mg ml−1) and 300 μl of Mannitol (0.32 M) for each 5 mg of lipid. Free rt-PA was separated from the entrapped rt-PA within ELIP by centrifugation at 16 000 rpm for 20 min at room temperature (25 °C). The resultant liposomal pellet was resuspended with 0.32 M Mannitol and kept at −70 °C for 2 h. The samples were lyophilized for 48 h and then kept at 4 °C overnight. The air headspace was evacuated from vials containing the final lipid/rt-PA samples, and reloaded with 2 ml (1 atm partial pressure) of OFP.
Vials of OFP t-ELIP containing 4 mg of lipid and 160 μg of rt-PA were shipped to the University of Cincinnati on ice. Prior to reconstitution, the vials were evacuated for 60 s at 10 mmHg (1.33 kPa) and filled with OFP to attain a partial pressure of 2 atm. Three hours after pressurization with OFP, a 22-gauge needle was used to equilibrate the partial pressure of OFP to 1 atm, and the OFP t-ELIP were reconstituted with 400 μl of 0.2 μm filtered, deionized, air saturated (100% dissolved oxygen) water (NANOPure, Barnstead Inernational, Dubuque, IA, USA), and diluted into porcine plasma to obtain a final lipid concentration of 1.2 mg ml−1.
OFP t-ELIP characterization
A sample of the reconstituted OFP t-ELIP suspension was diluted (1:40 000 v/v) into room temperature, air-saturated phosphate-buffered saline (Sigma-Aldrich) and the size distribution was measured using an impedance-based particle sizer (Multisizer 4, Beckman Coulter, Brea, CA USA). Each measurement analyzed 100 μl of the diluted sample through a 30 μm aperture over 30 s. Each measurement produced a number density histogram, which was corrected for the amount of dilution, with bins spaced between 0.65 μm and 18 μm (0.08 μm bin size). This histogram was transformed into a volume-weighted distribution for further analysis. The results from three measurements, each using a fresh vial of OFP t-ELIP, were averaged to produce a final volume-weighted size distribution.
The frequency-dependent attenuation coefficient, α(f) in dB cm−1, was determined using a broadband substitution technique as described in Raymond et al (2014). Briefly, OFP t-ELIP were diluted (1:200) into a reservoir containing aerated phosphate-buffered saline and 0.5% bovine serum albumin, stirred, and allowed to flow by gravity into a sample chamber with acoustically transparent polycarbonate film windows (CLINIcell 25, Mabio, Tourcoing, France). The reservoir, sample chamber, and transducers were mounted in a test tank filled with deionized water maintained at 37 °C ± 0.5 °C using a circulating water bath (Neslab EX, Newington, NH, USA). A pair of broadband transducers (PI-20, Olympus NDT, Waltham, MA, USA) were used to acquire the through-transmission spectrum over the frequency range 2–25 MHz (31 kPa peak negative pulse pressure). The attenuation spectrum was computed from the received amplitude spectra in the absence (diluent alone) and the presence of the OFP t-ELIP, respectively. Acoustic attenuation measurements were made using five separate vials of OFP t-ELIP. The elasticity and viscosity of the OFP t-ELIP shell were determined by minimizing the sum-squared difference in errors between the estimated and measured attenuation coefficients, as described in Raymond et al (2014).
The enzymatic activity of rt-PA and OFP t-ELIP were measured using a spectrophotometric method (Verheijen et al 1985). Thawed rt-PA or reconstituted OFP t-ELIP were diluted into a solution of phosphate buffer solution (Sigma-Aldrich, St. Louis, MO, USA) and 1% Triton-X (Sigma-Aldrich, St. Louis, MO, USA) to achieve target concentrations of rt-PA between 0.3 and 3 μg ml−1 in disposable cuvettes used for spectrophotometric measurement. The amount of Triton-X employed in the solution exceeded the critical micelle concentration (0.015%) (Triton-X Product Information Sheet, Sigma-Aldrich, St. Louis, MO, USA) to ensure rupture of the lipid shell surrounding t-ELIP and release of the associated rt-PA. The solution with released rt-PA was subsequently diluted into a pre-warmed solution (37 °C) of 0.5% phosphate buffer solution and a chromogenic substrate (S-2288, Chromogenix, DiaPharma Group, Inc., Westchester, OH, USA). The chromogenic substrate was hydrolyzed by rt-PA and allowed spectrophotometric measurement of the change of absorbance at 405 nm over time, which was proportional to the enzymatic activity of rt-PA. A spectrophotometer (UV-1700, Shimadzu, Japan) with temperature controller (TCC-240A, Shimadzu, Japan) was used to record the absorbance of the solution over the course of 5 min at 37 °C. The rt-PA activity was measured in terms of the change in absorbance over time (ΔAbs min−1).
Histotripsy insonation
Histotripsy pulses were generated with a 1 MHz, 8 annular element array with a 10 cm aperture and 9 cm focal length (Imasonic, Voray sur l'Ognon, France). All elements of the transducer were simultaneously driven in parallel by a custom designed and built class D amplifier and matching network (Hall and Cain 2006). The transducer had previously been calibrated at the focus for shock wave amplitudes up to 107 MPa peak positive pressure (18.3 MPa peak negative pressure) with a fiber optic hydrophone (FOPH 2000, RP Acoustics, e.K., Leutenbach, Germany) (Bader and Holland 2016). In this study, histotripsy pulses were generated for pulse durations of 5 μs, 20 Hz pulse repetition frequency (PRF), and peak negative pressures based on the free field calibration between 7 and 20 MPa. Peak negative pressures greater than 18 MPa were estimated by an element-by-element calibration following Maxwell et al (2013). The pulse duration for these insonations are consistent with previous studies of clot lysis with histotripsy (Maxwell et al 2009), and the PRF is similar to that used for histotripsy insonation of exogenous cavitation nuclei (Vlaisavljevich et al 2013).
Passive cavitation imaging
A passive cavitation image (PCI) spatially maps a specified frequency bandwidth of acoustic emissions generated by cavitation (Gyöngy et al 2008, Salgaonkar et al 2009). Each pixel (image location) of the PCI is proportional to the power of the acoustic emissions. To form PCIs, cavitation emissions were passively recorded during the histotripsy insonation with an L7-4 imaging array (ATL, Bothell, WA, USA) using a Verasonics ultrasound research scanner (Vantage 256, Verasonics, Inc., Kirkland, WA, USA). The imaging array was oriented to monitor cavitation activity along the axial-lateral plane of the histotripsy transducer at a distance of 30 mm from the focus (see figure 1). Peak cavitation emissions occurred during the 5 μs insonation. Cavitation emissions were beamformed in the frequency domain using a delay, sum, and integrate method (Haworth et al 2012). Briefly, the power spectra of the passively detected emissions were computed. The frequency domain data was phase-shifted based on the time-of-flight from a location in the imaging plane to each element of the imaging array. The phase-shifted data was then summed over each element of the array. The frequency-dependent power in the summed waveform was computed and used to assign pixel values in the PCI. The magnitude of the pixel was proportional to the averaged acoustic power received in the frequency range of interest with units of mV2. The cavitation emissions generated by the histotripsy-induced microbubble clouds were observed to have a broad frequency spectrum (figure 2). Thus, the recorded spectra were processed between 2.5 and 8.5 MHz to generate a PCI (Haworth et al 2012). The same L7-4 imaging array was also employed to acquire plane wave B-mode images.

Figure 1. Overhead view of experimental set up for histotripsy ablation of porcine clots. The L7-4 imaging array was oriented to monitor cavitation activity along the axial/elevational plane of the histotripsy transducer. The elevational dimension, not shown, is perpendicular to both the lateral and axial dimensions (into the page).
Download figure:
Standard image High-resolution image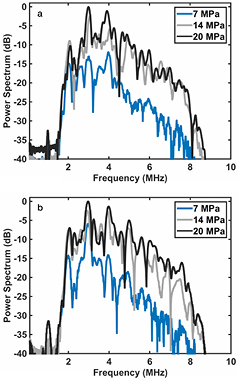
Figure 2. Representative scattered power spectra acquired from acoustic emissions generated by histotripsy-induced microbubble clouds within a porcine whole blood clot without OFP t-ELIP (a) and with OFP t-ELIP (b) (1-MHz fundamental frequency, 5 μs pulse duration, 20 Hz pulse repetition frequency). The peak negative pressures for each insonation are indicated in the legend. Each power spectrum was normalized by the maximum power while insonifying with a peak negative pressure of 20 MPa either without (a) or with (b) OFP t-ELIP.
Download figure:
Standard image High-resolution imageExperimental protocol
The porcine clot was cut to 1 cm length, blotted (Sutton et al 2013), and then weighed with a laboratory balance. The clot was inserted into a 6 mm diameter, 0.1 mm thick low-density polyethylene (LDPE) tube filled with either porcine plasma alone (Lampire Biologicals, Pipersville, PA, USA), porcine plasma and OFP t-ELIP, or porcine plasma and rt-PA. The LDPE tube has an acoustic impedance similar to that of a vessel wall (Hoskins 2007, Maev 2008). The rt-PA concentration was 24 μg ml−1, which is consistent with previous studies employing porcine clots for sonothrombolysis (Datta et al 2008, Holland et al 2008). The concentration of OFP t-ELIP (1.2 mg ml−1 lipid concentration) was adjusted to have equivalent enzymatic activity to the unencapsulated rt-PA after complete release with Triton-X. The LPDE tube was affixed to a three-axis positioning system (TDC001, Thorlabs Inc., Newton, NJ, USA) and submerged within a tank of deionized, degassed (20% dissolved oxygen), filtered (10 μm pore size) water. The water temperature was maintained at 37.3 ± 0.5 °C with a custom heating system. The clot was positioned in the focus of the histotripsy transducer, such that the axis of the clot was perpendicular to the central axis of the histotripsy transducer (see figure 1). The clot was translated laterally in 1 mm increments, and 2000 histotripsy pulses were applied at each location (10 total locations). Cavitation emissions were passively acquired at the first insonation location with the L7-4 imaging array every fifth histotripsy pulse (400 total frames). Emissions at this location were assumed to be representative at all 10 insonation locations. A plane wave B-mode image was also acquired after passive acquisition of cavitation emissions. The total treatment time was approximately 20 min, after which the residual clot segment was removed from the tube, blotted, and then weighed. Thrombolytic efficacy of the treatment was recorded by computing the percent mass loss. In a subset of each treatment type, a 200 μl sample of porcine plasma containing clot debris, or clot debris and residual rt-PA and lipid, was collected and diluted into phosphate buffered saline (1:2000 v/v). The size distribution was measured between 0.65 μm and 18 μm using an impedance-based particle sizer (Multisizer 4, Beckman Coulter, Brea, CA, USA). Each measurement analyzed 100 μl of the diluted sample through a 30 μm aperture over 30 s. A total of 6 clots were used for each given treatment type and peak negative pressure of the histotripsy pulse (72 clots in total).
For each passively acquired cavitation data set, the emissions were processed offline to form 400 PCIs. The pixel intensity is proportional to the acoustic power. The averaged acoustic power within the clot and the location of the maximum acoustic power along the axial dimension of the histotripsy transducer were computed for each data set (N = 6). To determine the average acoustic power within the clot for a given data set, all 400 PCI frames were averaged temporally. The clot location was manually segmented based on the plane wave B-mode image (figure 3), and the temporally averaged PCI was integrated along the axial dimension at a fixed elevational location. The axial and elevational dimensions are in reference to the histotripsy field (figure 1). The acoustic power was only integrated along the axial dimension because of the limited elevational resolution of the delay, sum, and integration method (Coviello et al 2015). Within the clot, the location of the maximum acoustic power along the axial dimension of the histotripsy transducer was also recorded for each pulse, and was found to have a Gaussian distribution (p > 0.05 for Lilliefors test). The variability of the axial location of the largest PCI pixel amplitude for each data set was evaluated as the full width, half maximum of the Gaussian distribution. To maximize the dynamic range visible in figure 3, the color bar uses a decibel scale where 0 dB represents the maximum pixel amplitude in the PCI.
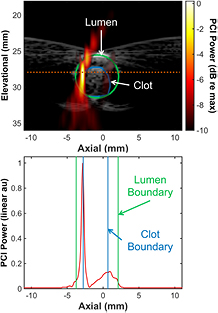
Figure 3. (Top panel) For a given data set, all 400 PCI frames were temporally averaged (hot colormap). The axial and elevational directions are in reference to the histotripsy transducer (figure 1). The histotripsy pulse is propagating along the axial dimension (from left to right) in the image. The artifact along the elevational direction of the histotripsy transducer occurs because of the elongated point spread function in the direction normal to the face of the linear array (Haworth et al 2012). A duplex averaged PCI/plane wave B-mode image (grayscale) allowed comparison of the temporally averaged acoustic power within the clot. The dotted and dashed line notes the elevational position of the maximum pixel amplitude of the PCI. (Bottom panel) The temporally averaged PCI amplitude as a function of the axial dimension at a fixed elevational location (dotted and dashed line in top panel). The boundaries of the lumen are denoted in green, and the clot boundaries are noted in blue.
Download figure:
Standard image High-resolution imageStatistical analysis
Statistical analysis was performed using the MATLAB Statistical Toolbox (The Mathworks, Natick, MA, USA). Statistical differences in means of the thrombolytic efficacy and the acoustic power within the clot, and the variability of the location of the maximum acoustic power along the axial dimension of the histotripsy source were determined by one-way unbalanced ANOVA with an α level of 0.05. Adjusted p values based on Tukey's honest significant difference test were calculated to elucidate significant differences between the means of treatment cohorts. The correlation between the thrombolytic efficacy, acoustic power within the clot, variability of the acoustic power along the axial dimension of the histotripsy transducer, and peak negative pressure were calculated using the Pearson's linear correlation coefficient in MATLAB® (The Mathworks, Natick, MA, USA). A p-value less than 0.05 was used as a requirement for significant correlation.
Numerically calculated response of OFP t-ELIP to histotripsy pulses
The radial oscillations of encapsulated cavitation nuclei in response to histotripsy excitation were calculated by numerical integration of the Marmottant model (Marmottant et al 2005). An adaptive fourth-order Runga–Kutta algorithm was implemented in MATLAB® (The Mathworks, Natick, MA, USA) to carry out the integration. The Marmottant model has the form:

where R is the time dependent bubble radius, the diacritic dot denotes the temporal derivative, c is the sound speed of the medium (1540 m s−1), μ is the dynamic viscosity (0.005 kg m−1· s−1 (Holland and Apfel 1989)), κ is the polytropic exponent of OFP (1.09 (Sarkar et al 2009)) and ρ is the medium density (1000 kg m−3). The terms χ and κS depend upon the shell elasticity and dilation viscosity, respectively, derived from the measured shell parameter of OFP t-ELIP from the attenuation measurements described above. The time-dependent source term in (1), pAC, was implemented with calibrated histotripsy waveforms with peak negative pressures of 7.1, 13.9, and 18.3 MPa. The maximum size of a cavitation nucleus without a shell were computed analytically following Bader and Holland (2016), and compared to the numerical calculations for encapsulated microbubbles.
Results
OFP t-ELIP characterization
The results of the enzymatic activity assay revealed that each reconstituted vial of OFP t-ELIP contained 200 μg ml−1 active rt-PA. The volume-weighted size distribution and attenuation spectrum for OFP t-ELIP are shown in figures 4(a) and (b), respectively. The size distribution peaks at 1.7 μm diameter, consistent with previous measurements of other ELIP formulations (Raymond et al 2014). The attenuation coefficient increases with frequency up to 15 MHz, with an asymptote of 31 dB cm−1. The dashed line in figure 4(b) indicates the predicted attenuation as a function of frequency based on the de Jong model using the best fits for the shell parameters of OFP t-ELIP (κS = 2.15 N m−1, χ = 1.64 × 10⁻⁸ N m−1). The coefficient of determination of the fit to the data was 0.91, consistent with previous measurements of other ELIP formulations (Raymond et al 2014).
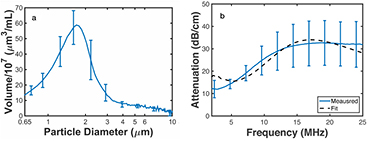
Figure 4. (a) The mean volume-weighted size distribution measurements of OFP t-ELIP between 0.65 and 10 μm. The error bars represent one standard deviation (N = 5). (b) The measured attenuation coefficient as a function of frequency (solid line) and theoretical fit to the de Jong model (dashed line) based on the estimated shell parameters of OFP t-ELIP. The error bars represent one standard deviation (N = 5). The coefficient of determination of the fit to the data was 0.91. The number density of liposomes employed for the attenuation measurement was 1.9 × 10⁸ liposomes ml−1. Following Raymond et al (2014), the estimated number density of bubbles for the attenuation measurement was 5.4 × 10⁶ bubbles ml−1.
Download figure:
Standard image High-resolution imageThrombolytic efficacy
The mass loss as a function of the peak negative pressure of the histotripsy insonation is shown in figure 5. For all treatment arms, the thrombolytic efficacy increased with the peak negative pressure of the histotripsy pulse. As indicated in table 1, the combination of histotripsy and rt-PA or OFP t-ELIP significantly increased the thrombolytic efficacy compared to histotripsy alone, except for OFP t-ELIP and histotripsy compared to histotripsy alone at 20 MPa peak negative pressure. The combination of histotripsy and rt-PA was significantly better than the all other treatment groups at peak negative pressures 14 and 20 MPa. It is notable that histotripsy insonation of the clot at 20 MPa in the presence of either rt-PA or OFP t-ELIP did not significantly improve the thrombolytic efficacy compared to that obtained at 14 MPa for these treatments. The spectrophotometric method was used also to measure the enzymatic activity of rt-PA alone (no clot) after histotripsy exposure. The rt-PA sample was diluted to 1 μg ml−1, and the enzymatic activity recorded. No degradation of the enzymatic activity of rt-PA was observed by exposure to histotripsy between 0 MPa and 20 MPa peak negative pressure (supplemental figure 1) stacks.iop.org/PMB/61/5253/mmedia.
Table 1. The Tukey's honest significance test adjusted p values comparing the treatment arms for the thrombolytic efficacy, shown in figure 5. The peak negative pressure of the histotripsy pulse is reported in the upper left corner of each row. Bold values indicate a significant difference between the treatment arms.
| 0 MPa | Histotripsy + rt-PA | Histotripsy + OFP t-ELIP |
| Histotripsy | 0.00 | 0.00 |
| Histotripsy + rt-PA | — | 0.65 |
| 7 MPa | Histotripsy + rt-PA | Histotripsy + OFP t-ELIP |
| Histotripsy | 0.00 | 0.00 |
| Histotripsy + rt-PA | — | 0.05 |
| 14 MPa | Histotripsy + rt-PA | Histotripsy + OFP t-ELIP |
| Histotripsy | 0.00 | 0.01 |
| Histotripsy + rt-PA | — | 0.00 |
| 20 MPa | Histotripsy + rt-PA | Histotripsy + OFP t-ELIP |
| Histotripsy | 0.00 | 0.34 |
| Histotripsy + rt-PA | — | 0.01 |
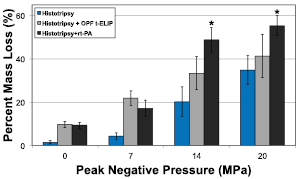
Figure 5. Thrombolytic efficacy for histotripsy alone, histotripsy and OFP t-ELIP, and histotripsy and rt-PA reported in terms of percent clot mass loss. The p values between treatment arms are indicated in table 1. The asterisks (*) indicate that the thrombolytic efficacy of that treatment arm is greater than all other treatment arms for that particular peak negative pressure (p < 0.05). The error bars represent one standard deviation (N = 6).
Download figure:
Standard image High-resolution imageParticulate debris
The size distribution of debris collected after treatment is shown in figure 6. Over 99.7% of the particulates were less than 5 μm for all treatment arms, and over 99.99% of the debris was less than 10 μm for all treatment arms. This range of particulate size distribution is consistent with previous observations of histotripsy induced thrombolysis (Maxwell et al 2009, Zhang et al 2015b).
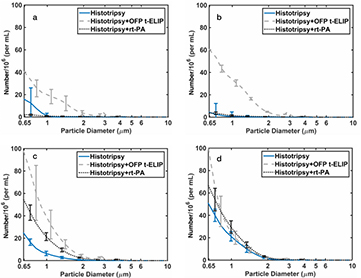
Figure 6. Size distribution of debris measured after treatment at 0 MPa (a), 7 MPa (b), 14 MPa (c), and 20 MPa (d) peak negative pressure. The error bars represent one standard deviation (N = 3). Note that residual lipid and rt-PA may be present in addition to clot debris for the rt-PA and OFP t-ELIP arms.
Download figure:
Standard image High-resolution imagePassive cavitation imaging
Each pixel (i.e. image location) of the computed PCI represents the acoustic power between 2.5 and 8.5 MHz. The acoustic power within the clot increased with the insonation pressure for all treatment arms, as depicted in figure 7. For a given peak negative pressure, the bubble activity generated within the different treatment arms was equivalent, except for histotripsy and histotripsy and rt-PA at 7 MPa peak negative pressure. The variability of the location of the maximum PCI pixel amplitude along the axial dimension of the histotripsy source decreases significantly decreases with increasing peak negative pressure for histotripsy and histotripsy and OFP t-ELIP (figure 8). At 20 MPa peak negative pressure, the combination of rt-PA and histotripsy had a greater axial variability than the other two treatment arms (histotripsy with and without OFP t-ELIP). No significant differences were observed amongst the treatment arms for the other histotripsy pulse amplitudes.

Figure 7. The acoustic power within the clot for each treatment arm. The error bars represent one standard deviation (N = 6). The acoustic power within the clot significantly increased with the peak negative pressure of the histotripsy pulse for all treatment arms. At a given peak negative pressure, there was no significant difference between the treatment arms.
Download figure:
Standard image High-resolution image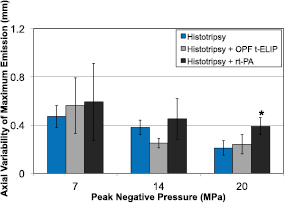
Figure 8. The variability of the location of the maximum PCI pixel amplitude along the axial dimension of the histotripsy source as a function of the peak negative pressure of the histotripsy pulse. The error bars represent one standard deviation (N = 6). The variability significantly decreases with the peak negative pressure for histotripsy and histotripsy and OFP t-ELIP. The asterisks (*) indicate that the axial variability of that treatment arm is greater than all other treatment arms for that particular peak negative pressure of the histotripsy pulse.
Download figure:
Standard image High-resolution imageNumerical computation
The response of a single encapsulated OFP gas bubble to histotripsy excitation was numerically calculated with the Marmottant equation for initial diameters between 15 nm and 5 μm. The measured shell elasticity and viscosity of microbubbles within OFP t-ELIP (κS = 2.15 N m−1, χ = 1.64 × 10⁻⁸ N m−1) were employed in equation (1). A representative measured histotripsy pulse and the corresponding calculated response of a 1.7 μm diameter microbubble and the excitation histotripsy pulse are shown in figure 9. The microbubble expands and undergoes an inertial collapse over the first cycle of the pulse. During the subsequent cycles, the dynamics of the microbubble are dominated by the tensile portion of the histotripsy pulse. The impact of the compressive shock waves only slightly retards the microbubble growth. The microbubble continues to grow after the completion of the histotripsy pulse due to the momentum of the bubble wall, and collapses under atmospheric pressure.
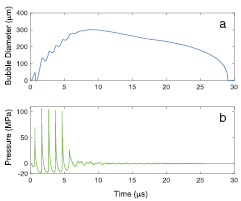
Figure 9. The response of a shelled microbubble using the Marmottant equation (Marmottant et al 2005), equation (1), is shown in panel (a). The viscoelastic shell properties of OFP t-ELIP derived from the attenuation measurements were used in the calculation. The experimentally measured waveform used as the excitation source in the computation is shown in panel (b). The initial diameter of the cavitation nucleus was 1.7 μm.
Download figure:
Standard image High-resolution imageMicrobubble cloud formation is initiated after the first cycle of the histotripsy pulse (Maxwell et al 2011b), when expansion of the precipitating microbubble is large enough to scatter a significant portion of the incident shock wave. The maximum size of the encapsulated OFP microbubble was numerically computed using only the first fully developed shock wave of the histotripsy pulse (i.e. the second cycle of the histotripsy pulse) as the excitation source. In addition, the maximum size of an OFP bubble without a viscoelastic shell was computed analytically following Bader and Holland (2016). For nuclei larger than 500 nm in diameter, the maximum diameter was observed to be only weakly dependent on the initial diameter (figure 10). The maximum diameters after histotripsy exposure of the shelled OFP nano- and microbubbles were slightly less than that of the unshelled OFP nano- and microbubbles, likely due to the added damping and elasticity of the shell.

Figure 10. Maximum size of the bubble as a function of initial size for shelled microbubbles calculated by numerical integration of the Marmottant model (symbols) and unshelled microbubbles without shell encapsulation using the analytic theory of Bader and Holland (2016) (solid lines). The peak negative pressure of the histotripsy pulse is shown in the legend.
Download figure:
Standard image High-resolution imageDiscussion
Thrombolytic efficacy
Combinatory approaches have previously been employed for the treatment of acute DVT (Chinsakchai et al 2010). Here, we reported on the use of histotripsy as a potential adjuvant therapy to the established clinical protocol of catheter-directed thrombolytics (Patel et al 1998, Mewissen et al 1999) for the ablation of chronic thrombi resistant to pharmomechanical intervention (Whittaker and Przyklenk 2009). The thrombolytic rt-PA was administered in our static in vitro model using fully retracted clots with and without liposomal encapsulation.
The combination of rt-PA and histotripsy was more efficacious than histotripsy alone (figure 5). The thrombolytic efficacy correlated with the peak negative pressure of the histotripsy pulse for all treatment arms. Maxwell et al (2009) observed that the lytic rate increased linearly with the peak negative pressure of histotripsy pulse between 6 and 12 MPa. The percent mass loss of clots treated with rt-PA and OFP t-ELIP without histotripsy exposure was equivalent (0 MPa peak negative pressure). Shaw et al (2009a) also observed increased thrombolytic efficacy (fractional clot loss) for rt-PA and air-filled t-ELIP treated human clots in the absence of ultrasound compared to plasma alone. Mass loss for clots exposed to OFP t-ELIP in the absence of ultrasound may be due to localized passive release of the drug. In addition, some rt-PA could be intercalated within the lipid bilayer and lytically active (Smith et al 2010).
It is not apparent why the histotripsy and rt-PA arm is more efficacious than the histotripsy and OFP t-ELIP at peak negative pressure greater than 14 MPa. The enzymatic activity and cavitation activity are equivalent between the two treatment arms. One potential is that the addition of the encapsulated microbubbles would create a two-phase medium (i.e. bubbly liquid) surrounding the clot. The high frequency components of the shock wave would be rapidly attenuated when propagating through the bubbly liquid (Watanabe and Prosperetti 1994). Mitigation of the shock wave amplitude decreases the propensity for cloud activity (Maxwell et al 2011b), potentially limiting the ablative qualities of the histotripsy pulse (Duryea et al 2015). It is also possible that low encapsulation of rt-PA into the liposome reduces the efficacy of histotripsy and OFP t-ELIP.
Measurement of particulate debris
The size of particles after treatment were predominately less than 10 μm for all treatment arms (figure 6), which is consistent with previous observations of histotripsy induced thrombolysis (Maxwell et al 2009, Zhang et al 2015b). The combination of histotripsy and thrombolytic resulted in a significantly larger number of particulates less than 5 μm. A portion of these particles are likely fibrin degradation products resulting from cleaving of the fibrin mesh resulting from rt-PA acting on the clot. Additionally, the ruptured amphiphilic lipid particulates will preferentially form micelles (Basu and Basu 2002) which would be present for insonation of OFP t-ELIP.
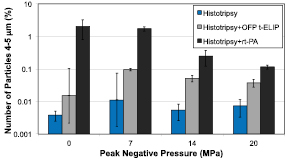
Over 99% of the particle debris was less than 5 μm for all treatment arms. Porcine red blood cells are between 4–5 μm (Lewis 1996). Interestingly, the combination of histotripsy insonation and rt-PA or OFP t-ELIP generated significantly more particles in this size range than histotripsy insonation alone (figure 11). The ablative qualities of histotripsy primarily result in acellular debris (Maxwell et al 2009). Our results suggest the addition of thrombolytic to histotripsy may result in a decrease in hemolysis, which would decrease the likelihood of acute renal failure due to massive hemolysis (Arslan et al 2007). Future studies are required to determine the degree of hemolysis.
Figure 11. Percent of debris measured after treatment between 4–5 μm, the typical size of porcine red blood cells, compared to the total number of particles measured (0.65–18 μm). The error bars represent one standard deviation (N = 3). The addition of thrombolytic significantly increased the number of particulates in this range, suggesting preservation of red blood cells for the combined histotripsy and thrombolytic treatment arms.
Download figure:
Standard image High-resolution image
Cavitation activity
PCIs were employed to monitor the acoustic power scattered during the histotripsy excitation. Both B-mode images (Hall et al 2007) and color Doppler (Zhang et al 2015a) have been employed to monitor cavitation activity during histotripsy pulses. However, these imaging modalities provide only spatial information of cavitation activity, and do not elucidate information on the mechanical action of the cavitation known to be responsible for the ablative qualities of histotripsy (Xu et al 2006). The resultant cavitation-generated acoustic emissions can be mapped directly with passive cavitation imaging (PCI).
The acoustic power within the clot was not significantly different between the treatment arms, even with the addition of OFP gas entrained within the OFP t-ELIP. This may be due in part to near instantaneous rupture of the OFP microbubbles by the first histotripsy pulse (Marmottant et al 2005). The likelihood of rupturing the shell of encapsulated microbubbles is quantified by the cavitation index (Bader and Holland 2012), which is defined as the ratio of the peak negative pressure to the center frequency of the insonation. Shell rupture becomes more likely as the cavitation index exceeds 0.02. For the insonation parameters employed in this study the cavitation index ranged from 7–20, indicating a strong likelihood of rupture. Numerical integration of the Marmottant equation (Marmottant et al 2005) for OFP t-ELIP microbubbles indicated a several hundred fold expansion of the initial microbubble (figures 9 and 10). The predicted expansion ratio of the shelled microbubble would suggest the initial cavitation nuclei were likely destroyed within the first pulse and did not result in sustained microbubble activity. The addition of flow to the model would allow replenishment of the cavitation nuclei (Hitchcock et al 2011, Bader et al 2015c).
The fate of the residual OFP gas cores is unknown. Unshelled bubbles with an OFP gas core smaller than 0.5 μm diameter would dissolve into solution within 50 ms (Sarkar et al 2009), which is less than the period between histotripsy pulses in the present study. The attenuation spectrum of OFP t-ELIP is most prominent above 15 MHz (figure 4(b)), which would indicate a large number of acoustically active ELIP less than 0.4 μm diameter (Marmottant et al 2005). Coalescence of the bubbles may also occur (Postema et al 2004, Bader et al 2015c). Alternatively, complex dynamics of the microbubble cloud that are not properly modeled here may contribute. Regardless, the response of a cavitation nucleus appears independent of the initial conditions (e.g. shelled or unshelled), as indicated in figure 10.
Vlaisavljevich et al (2015) employed perfluoropentane nanodroplets as exogenous nuclei for histotripsy-generated microbubble cloud formation. Using high-speed videography and passive cavitation detection, copious cavitation was initially observed. However, no cavitation was observed after 16 pulses for 1.5 MHz pulse delivered at 1 Hz. Equivalent cavitation activity was detected throughout all 2000 histotripsy pulses in this study, even without the addition of exogenous nuclei. The sustained bubble activity observed might be due in part to the relatively higher PRF compared to that employed by Vlaisavljevich et al (20 Hz versus 1 Hz). The presence of the LDPE tube containing the clot might have obviated the need for the addition of exogenous cavitation nuclei (Xu et al 2007).
Numerical computation of OFP microbubble response
The growth of the initial microbubble nucleus is the precipitating event for the formation of the ablative microbubble cloud (Maxwell et al 2011b). Without exogenous nuclei, microbubble clouds are hypothesized to form from endogenous nanometer-sized nuclei present in the tissue (Maxwell et al 2013). Copious cavitation nuclei are likely present in this study from the tube surface and plasma, which were in the pre-focal region of the histotripsy field (Xu et al 2007). The calculated maximum size of a microbubble exposed to a histotripsy pulse is nearly independent of its initial size and is not strongly affected by the presence of the shell (figure 10), consistent with previous computations of microbubbles excited by shock waves (Church 1989, Iloreta et al 2008, Bader and Holland 2016).
Study limitations
The in vitro clot model used in this study allowed an in-depth study of thrombolytic mechanisms. However, several aspects of this in vitro study limit the applicability of these findings. The static fluid system used in this study neglected a continuous reperfusion of the thrombolytic, as would occur for catheter-directed thrombolytics (Patel et al 1998). In addition, some flow would occur even for a nearly occlusive thrombus (White et al 1989), which may contribute to both the replenishment of cavitation nuclei and the lytic rate (Bajd et al 2010).
Cavitation emissions were only recorded at the first insonation location of the clot, and were assumed to be representative of the insonation at all locations. Over the 20 min duration of the treatment, heating effects were negligible for the low duty cycle histotripsy insonation (Parsons et al 2006). Partial diffusion of the OFP gas through the encapsulating shell would occur over the 20 min treatment duration in the absence of histotripsy pulses (Raymond 2015). Once the encapsulated microbubble were exposed to histotripsy pulses, however, the lipid shell ruptured, followed by a rapid loss of echogenicity (Bader and Holland 2012, Radhakrishnan et al 2013).
The arrangement of the imaging array allowed for resolution of cavitation along the central axis of the histotripsy transducer. However, this geometry would be difficult to implement for in vivo studies depending on the available acoustic paths. In the future, an imaging array that is in-line with the central axis of the histotripsy transducer would be more practical for PCI guidance of histotripsy. The delay, sum, and integration method used to process the PCI has larger range resolution than azimuthal resolution. Although very computationally intensive, using robust Capon beamforming to process the PCI would provide improved spatial resolution (Coviello et al 2015).
A relatively low dose of histotripsy pulses were applied in each arm of the study, which allowed elucidation of subtle differences between the treatment groups. The efficacy of histotripsy as a stand-alone treatment can be optimized through modifying the insonation scheme (e.g. PRF, pulse duration, and amplitude) (Xu et al 2007). Further studies are required to determine the optimal parameters for histotripsy in combination with rt-PA.
The clinically administered dose of rt-PA in humans is 3.15 μg ml−1 (Tanswell et al 1991). Porcine blood has a much lower concentration of plasminogen compared to human blood (Lewis 1996), and therefore is less responsive to rt-PA. The concentration of rt-PA used in these studies (24 μg ml−1) was larger than the dose administered clinically, but is within the range employed for porcine thrombolysis studies (Datta et al 2008, Holland et al 2008).
Only clot debris less than 18 μm diameter was measured in this study. Particulates larger than a few micrometers are sparse for clots exposed to histotripsy pulses (Maxwell et al 2009, Zhang et al 2015b). The clinical scenario of an occluding thrombus was not modeled here (Liebeskind et al 2011). Encapsulation of the thrombolytic within an echogenic liposome may reduce systemic exposure of rt-PA of patients, decreasing the risk of bleeding. The systemic toxicity and side effects of the treatment could also not be ascertained in this in vitro model. Further in vivo studies are needed to assess the potential reduction of adverse bioeffects in vivo.
The enzymatic activity of OFP t-ELIP was only assessed after the addition of the surfactant Triton-X, which ensured the release of any encapsulated lytic. Future studies will explore the efficiency of encapsulation of thrombolytic in OFP t-ELIP, and the release profile after histotripsy exposure.
Summary
Histotripsy is a promising ultrasound ablative therapy for the treatment of DVT. This study employed histotripsy in combination with a thrombolytic for clot lysis. In addition, histotripsy was used to trigger localized release of the potent thrombolytic rt-PA from ELIP. Passive cavitation imaging was employed to monitor microbubble cloud formation. Improved thrombolytic efficacy was generally observed for the combination of rt-PA and histotripsy. No significant differences were observed in the power of cavitation emissions or the spatial location of cavitation for histotripsy insonation of OFP t-ELIP versus insonation of plasma or plasma and rt-PA. However, numerical studies of the oscillations of encapsulated OFP microbubbles entrained within OFP t-ELIP suggest near instantaneous rupture of the lipid shell when exposed to histotripsy pulses. Nevertheless, these results suggest that the synergistic effects of histotripsy combined with the administration of rt-PA could be a compelling technique for treating highly retracted clots typical of DVT.
Acknowledgments
This work was funded in part by the Focused Ultrasound Foundation (319R1) and the National Institutes of Health (R01 NS047603).