
 reté Nucléaire (IRSN), Pôle Radioprotection de l'Homme, BP17, 92260 Fontenay-aux-Roses, France
Abstract
The purpose of this study is to characterize the stray neutron radiation field in scanning proton therapy considering a pediatric anthropomorphic phantom and a clinically-relevant beam condition.
Using two extended-range Bonner sphere spectrometry systems (ERBSS), Working Group 9 of the European Radiation Dosimetry Group measured neutron spectra at ten different positions around a pediatric anthropomorphic phantom irradiated for a brain tumor with a scanning proton beam. This study compares the different systems and unfolding codes as well as neutron spectra measured in similar conditions around a water tank phantom.
The ten spectra measured with two ERBSS systems show a generally similar thermal component regardless of the position around the phantom while high energy neutrons (above 20 MeV) were only registered at positions near the beam axis (at 0°, 329° and 355°). Neutron spectra, fluence and ambient dose equivalent, H *(10), values of both systems were in good agreement (<15%) while the unfolding code proved to have a limited effect. The highest H *(10) value of 2.7 μSv Gy−1 was measured at 329° to the beam axis and 1.63 m from the isocenter where high-energy neutrons (E ⩾ 20 MeV) contribute with about 53%. The neutron mapping within the gantry room showed that H *(10) values significantly decreased with distance and angular position with respect to the beam axis dropping to 0.52 μSv Gy−1 at 90° and 3.35 m. Spectra at angles of 45° and 135° with respect to the beam axis measured here with an anthropomorphic phantom showed a similar peak structure at the thermal, fast and high energy range as in the previous water-tank experiments. Meanwhile, at 90°, small differences at the high-energy range were observed.
Using ERBSS systems, neutron spectra mapping was performed to characterize the exposure of scanning proton therapy patients. The ten measured spectra provide precise information about the exposure of healthy organs to thermal, epithermal, evaporation and intra-nuclear cascade neutrons. This comprehensive spectrometry analysis can also help in understanding the tremendous literature data based rem-counters while also being of great value for general neutron shielding and radiation safety studies.
Export citation and abstract BibTeX RIS
For more information on this article, see medicalphysicsweb.org
1. Introduction
Technical advances in beam production and delivery have rendered proton therapy a rapidly growing cancer treatment technique (Durante and Loeffler 2010, PTCOG 2013). However, unavoidable stray neutrons created in the beam line elements, gantry room construction materials, and the patient himself, are the known drawbacks of proton therapy as they increase the risk of secondary cancers (Zacharatou-Jarlskog and Paganetti 2008, Newhauser and Durante 2011, NCRP 2012).
To properly evaluate secondary doses delivered to normal tissues, it is necessary to determine the neutron energy distribution and fluence rates to the patient with measurement tools capable of accurately detecting high energy neutrons, possibly reaching 250 MeV. The Bonner sphere spectrometer (Bramblett et al 1960) system with an extended detection capability of high-energy neutrons (E > 20 MeV)—extended-range Bonner sphere spectrometer (ERBSS)—allows such a characterization and it has been increasingly used to measure proton therapy's stray neutron environment (Yan et al 2002, Kim et al 2008, Farah et al 2014, Howell and Burgett 2014).
Passive scattering proton therapy has been the main focus of such spectrometry studies, being to this date the most commonly used delivery technique which also involves the highest exposure levels due to secondary neutrons (Yan et al 2002, Kim et al 2008, Farah et al 2014, Howell and Burgett 2014). The literature data for passive scattering documents neutron spectra measured with different proton beam energies (75–250 MeV), field sizes (3–5.5 cm diameter, 5 × 5 cm2), target volumes (water tank, slab or anthropomorphic phantoms), measurement positions (near or far from the target volume) and irradiation conditions (open or closed final collimator, clinically relevant or large field sizes). Spectra showed large variability among the different studies owing to the strong dependence of external neutrons with the beam line design and shielding.
Meanwhile, spectrometry measurements in scanning proton therapy are still scarce. Working Group 9 of the European Radiation Dosimetry Group (EURADOS) recently reported the results of a large measurement campaign where neutron spectra, generated by a scanning proton beam targeting a water tank phantom, were recorded using two extended-range ERBSS systems (Farah et al 2015). This study showed that the thermal component of the neutron spectra is roughly identical at four angular positions around the phantom (0°, 45°, 90° and 135°), while intra-nuclear cascade neutrons (>20 MeV) largely dominate the measured spectra (up to 60%) along the beam axis and quickly drop with angular position to the beam axis (reaching only 2% at 135°).
The previous EURADOS study, however, involved some limitations and challenges that needed to be addressed. These included the use of a water tank phantom to represent the patient and the consideration of a large treatment field (10 × 10 × 10 cm3). A new characterization of the neutron environment in scanning proton therapy was thus undertaken with the following goals:
- To use the ten years-old anthropomorphic CIRS phantom (Computerized Imaging Reference Systems, Inc, Norfolk, VA, USA) (CIRS 2013) and investigate the impact of other elements, such as carbon, nitrogen and calcium, on the production of internal neutrons.
- To characterize stray neutrons in a clinically-relevant configuration considering a brain tumor irradiation.
- To perform a comprehensive neutron spectrometry analysis and fully quantify the angular emission of internal neutrons.
- To intercompare the extended-range ERBSS systems of the Helmholtz Zentrum München (HMGU) and the Universitat Autònoma de Barcelona (UAB) and study the impact of several unfolding codes.
2. Materials and methods
2.1. Proton beam specification at the IFJ PAN Kraków
Our experiment was carried out at the Bronowice Cyclotron Center (CCB), which is a part of the Henryk Niewodniczański Institute of Nuclear Physics of Polish Academy of Sciences in Kraków (IFJ PAN), Poland. The Proteus C-235 cyclotron, designed and installed by IBA (Ion Beam Applications S.A., Belgium), is able to accelerate protons for clinical use up to 230 MeV. This proton therapy facility includes the latest version of IBA's 360 degree treatment gantry design. In this experiment, the intensity modulated proton therapy technique using a pencil scanning beam was used to uniformly deliver a dose of 20 Gy to the spherical target (5 cm diameter) inside a head of the ten years-old pediatric phantom (CIRS manufactured) placed on the patient support device (see figure 1(b)). The anterior–superior (vertex) field simulated the worst case scenario (with respect to secondary neutrons production) for the patient with its body along the beam axis.
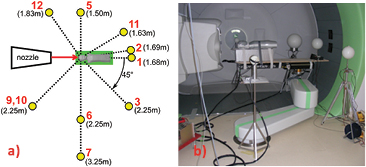
Figure 1. Schematic view of the ten measurement positions around the ten years-old pediatric phantom (a) and picture of the actual setup with Bonner spheres within the CCB-Krakow gantry room (b).
Download figure:
Standard image High-resolution imageA ten years-old pediatric phantom was uniformly irradiated using a proton pencil beam of energy from 100 MeV to 144 MeV and a 5 cm-diameter field size representing a spherical tumor located in the center of the brain. The actual spot size in the sigma definition varied between 5.4 and 4.6 mm due to a natural spread of the spot size; the lateral spot separation was 5 mm.
2.2. Experimental setup
Neutron spectra around the anthropomorphic phantom were measured at several distances and angular positions with respect to the beam axis (see figure 1(a)). On the one hand, measurements were performed at 0°, 45°, 90°, 135°, 235°, 270°, 329° and 355° with respect to the beam axis to enable a full characterization of intra-nuclear cascade neutrons which are preferentially emitted in the forward direction (Farah et al 2015). On the other hand, the measurement locations, with respect to distance from the isocenter, varied from 1.50 m (position 5) to 3.25 m (position 7) to investigate the neutron fluence decrease with distance. Finally, ERBSS systems were set at the level of the isocenter, i.e. 1.25 m above the floor, except for position 10 where the spheres were only set at a height of 0.50 m to investigate potential additional neutron scattering from the floor. Table 1 provides a detailed overview of all positions used for the measurements. The measurements at each position were repeated with each of the 17 (HMGU ERBSS) and 14 (UAB ERBSS) spheres, respectively. Considering that spectrometry measurements are time-consuming, six measurement positions were acquired in parallel while the UAB system was set at positions 1, 2, 3 and 5 while the HMGU system was set at positions 3, 5, 6, 7, 9, 10, 11 and 12. Two common positions were hence selected for the intercomparison while other positions were set to fully cover the angular emission of stray neutrons while also taking into account practical constraints. During the multiple measurements, the Bonner spheres were positioned at distances of at least 1 m to each other to avoid 'cross-talk' effect. For this reason the measurements at positions 1 and 2, 6 and 7, 9 and 10 were not performed at the same time. The measurements positions 4 (angle: 45°; distance: 2.25 m; height: 0.50 m) and 8 (angle: 90°; distance: 4.25 m; height: 1.25 m) could not be used for measurements with Bonner spheres due to space reasons.
Table 1. Ten measurement positions around the ten years-old pediatric phantom.
| Position | Angle to beam axis (°) | Distance to isocenter (m) | Height to the floor (m) |
|---|---|---|---|
| 1 | 0 | 1.68 | 1.25 |
| 2 | 355 | 1.69 | 1.25 |
| 3 | 45 | 2.25 | 1.25 |
| 5 | 270 | 1.50 | 1.25 |
| 6 | 90 | 2.25 | 1.25 |
| 7 | 90 | 3.25 | 1.25 |
| 9 | 135 | 2.25 | 1.25 |
| 10 | 135 | 2.25 | 0.50 |
| 11 | 329 | 1.63 | 1.25 |
| 12 | 235 | 1.83 | 1.25 |
2.3. Neutron spectrometry measurements
2.3.1. HMGU extended-range Bonner sphere spectrometry system.
The 18-measuring-channels HMGU ERBSS system previously used at the Trento Centro di Protonterapia (PTC-Trento), Italy, for neutron spectrometry measurements (Farah et al 2015) was again used in these experiments. This ERBSS is composed of a 3.3 cm diameter spherical 3He (partial pressure of 172 kPa) proportional counter type SP9 (Centronic Ltd) and 15 polyethylene (PE) spheres of different diameters ranging from 2.5'' (6.35 cm) to 15'' (38.10 cm). Additionally, two 9'' (22.86 cm) PE spheres are designed with lead shells of 0.5'' (1.27 cm) and 1'' (2.54 cm) to extend the detection range to neutrons above 10 MeV (Mares et al 1998a). A bare 3He proportional counter without any surrounding material is also used as the 18th measuring channel. This system enables accurate measurements of neutron fluence spectra and ambient dose equivalent, H *(10), values since the fluence response functions (HEMA99) of all spheres with 3He proportional counter in their center were calculated by means of Monte Carlo (MC) simulations (Mares et al 1991, 1998b) and experimentally validated at 13 neutron energies between thermal and 14.8 MeV (Alevra et al 1992, Thomas et al 1994) as well as with quasi mono-energetic neutron fields with peak energies at 244 MeV and 387 MeV (Mares et al 2013).
To derive neutron spectra from the counts, the MSANDB (Matzke 1987) and BONMA (Lunn et al 2000, Sannikov et al 2004) unfolding codes were used. Both codes are based on iterative procedures and require a rough start (guess, a priori) spectra containing physical information about the neutron fields at the measurement positions. These guess spectra were simulated using a Geant4 (version 10.00.p02) MC code (Agostinelli et al 2003) considering a simplified 144 MeV proton source of 5 cm diameter targeting a depth of about 14 cm inside the head of the ten years-old pediatric phantom. The neutron energy distribution was scored in spherical cells of 10 cm diameter filled with dry air at each of the ten measurement positions. The number of iterations was set by MSANDB and BONMA to 500 and 50, respectively, to ensure an optimal unfolding result without forced oscillations.
The neutron energy spectra were folded with fluence-to-dose conversion coefficients to estimate the neutron ambient dose equivalent, H *(10). The conversion coefficients from the International Commission on Radiological Protection 74 (ICRP 1997) were used—extended to high energies with data from Pelliccioni (2000). These data were interpolated in the energy range between 1 meV and 10 GeV, with 130 logarithmically equidistant energy bins, i.e. ten bins per decade (see figure 2).
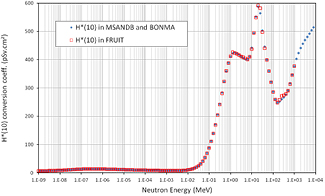
Figure 2. Comparison of H *(10) fluence-to-dose conversion coefficients used in MSANDB and BONMA (HMGU), and FRUIT (UAB).
Download figure:
Standard image High-resolution image2.3.2. UAB extended-range Bonner sphere spectrometry system.
The UAB ERBSS consists of nine PE spheres with a diameter ranging from 2.5'' to 12'' plus two 7'' PE extended range spheres with 1'' Cu and 1'' Pb shell and three PE spheres (2.5'', 3'' and 4.2'') with 1.5 mm Cd shell. The central detector is a cylindrical (9 mm diameter, 10 mm high) 3He filled (partial pressure of 800 kPa) proportional counter (model 05NH1 from EURISYS). The response matrices were evaluated using MCNPX version 2.4 (Waters et al 2002) and validated in quasi mono-energetic reference beams up to 19 MeV at the German National Metrology Institute (PTB) and at the EU Joint Research Centre—Institute for Reference Materials and Measurements in radionuclide based ISO sources (AmBe, Cf-252 and Cf-252/D2O) in the thermal SIGMA facility at IRSN (France) and in quasi mono-energetic beams ranging from 50 to 200 MeV at the TSL (Sweden). The overall uncertainty was fixed to 3% for the PE spheres and 10% for extended range spheres (Bedogni et al 2014).
The Frascati Unfolding Interactive Tool (FRUIT) (Bedogni et al 2007) was used to process the counts and obtain the energy distribution of the neutron fluence. Two different unfolding modes were used:
- A numerical unfolding using a special gradient method, FRUIT-SGM, which unfolds the data by iteratively altering a guess spectrum (the same guess spectra previously described were used).
- A parametric approach, FRUIT-PAR, based on varying the parameters which describe a physically meaningful spectrum for the situation studied. After this unfolding, and in order to refine the final spectra, a numerical unfolding is performed.
In both versions, a variability analysis from uncertainties in the input data (sphere counts, usually of the order of 1–2%) and in the response matrix is performed in order to assign uncertainties to the neutron spectrum. Global uncertainties of the total fluence and ambient-dose equivalent are normally within the range of 3–6% and 4–7%, respectively (Amgarou et al 2011, Bedogni et al 2014).
3. Results and discussion
3.1. Neutron spectra around the phantom
Neutron fluence energy distributions around the ten years-old CIRS phantom are given in figure 3 for the UAB extended-range ERBSS system set at positions 1–5 and for the HMGU system set at positions 6–12. Meanwhile, tables 2 and 3 show the average energy, fluence and ambient dose equivalent H *(10) values and their relative contributions for four neutron energy regions measured at each position using both ERBSS systems.
Table 2. Neutron fluence and H *(10) per proton Gy obtained at positions 1, 2, 3, and 5 using UAB extended-range ERBSS system and FRUIT unfolding code: (A) FRUIT-SGM, (B) FRUIT-PAR.
| (A) | ||||
|---|---|---|---|---|
| FRUIT-SGM | Positions | |||
| Quantity | 1 | 2 | 3 | 5 |
| Φ/103 · cm−2 · Gy−1 | 4.31 ± 0.20 | 4.88 ± 0.27 | 5.23 ± 0.21 | 6.42 ± 0.29 |
| Φthm/% | 13 | 12 | 14 | 13 |
| Φint/% | 26 | 24 | 22 | 26 |
| Φfst/% | 50 | 43 | 50 | 58 |
| Φhgh/% | 11 | 21 | 15 | 4 |
| Emean /MeV | 8.3 | 16 | 10 | 3.8 |
| H *(10)/μSv · Gy−1 | 0.97 ± 0.05 | 1.16 ± 0.07 | 1.41 ± 0.07 | 1.59 ± 0.10 |
| H *(10)thm/% | 0.68 | 0.59 | 0.58 | 0.59 |
| H *(10)int/% | 2.3 | 1.9 | 1.5 | 2 |
| H *(10)fst/% | 80 | 66 | 72 | 89 |
| H *(10)hgh/% | 17 | 32 | 25 | 7.9 |
| (B) | ||||
|---|---|---|---|---|
| FRUIT-PAR | Positions | |||
| Quantity | 1 | 2 | 3 | 5 |
| Φ/103 · cm−2 · Gy−1 | 4.25 ± 0.21 | 4.90 ± 0.25 | 5.26 ± 0.31 | 6.31 ± 0.30 |
| Φthm/% | 13 | 13 | 14 | 13 |
| Φint/% | 27 | 26 | 23 | 30 |
| Φfst/% | 49 | 40 | 47 | 56 |
| Φhgh/% | 12 | 21 | 15 | 1 |
| Emean /MeV | 8.3 | 15 | 9.6 | 2.5 |
| H *(10)/μSv · Gy−1 | 1.00 ± 0.05 | 1.13 ± 0.06 | 1.36 ± 0.09 | 1.44 ± 0.09 |
| H *(10)thm/% | 0.63 | 0.63 | 0.62 | 0.66 |
| H *(10)int/% | 2 | 2.4 | 1.9 | 2.7 |
| H *(10)fst/% | 78 | 63 | 72 | 94 |
| H *(10)hgh/% | 19 | 34 | 26 | 2.7 |
Note: In addition, fluence and H *(10) relative contributions for four neutron energy regions are listed: thm: thermal (1 meV ⩽ E < 0.4 eV), int: intermediate (0.4 eV ⩽ E < 100 keV), fst: fast (100 keV ⩽ E < 20 MeV) and hgh: high (E ⩾ 20 MeV).
Table 3. Neutron fluence and H *(10) per proton Gy obtained at positions 3, 5, 6, 7, 9, 10, 11, and 12 using the HMGU extended-range ERBSS system and MSANDB (A) and BONMA (B) unfolding codes. In addition, fluence and H *(10) relative contributions for four neutron energy regions are listed: thm: thermal (1 meV ⩽ E < 0.4 eV), int: intermediate (0.4 eV ⩽ E < 100 keV), fst: fast (100 keV ⩽ E < 20 MeV) and hgh: high (E ⩾ 20 MeV). Please note that Emean in BONMA is calculated in the energy range higher than 0.4 eV only.
| (A) | ||||||||
|---|---|---|---|---|---|---|---|---|
| MSANDB | Position | |||||||
| Quantity | 3 | 5 | 6 | 7 | 9 | 10 | 11 | 12 |
| Φ/103 · cm−2 · Gy−1 | 5.5 | 6.37 | 3.97 | 2.82 | 3.81 | 3.78 | 8.12 | 5.09 |
| Φthm /% | 13 | 13 | 19 | 24 | 18 | 20 | 7 | 10 |
| Φint /% | 20 | 25 | 27 | 30 | 31 | 32 | 15 | 28 |
| Φfst /% | 46 | 56 | 50 | 43 | 48 | 47 | 44 | 60 |
| Φhgh /% | 21 | 6 | 4 | 3 | 2 | 1 | 34 | 2 |
| Emean /MeV | 12.1 | 4.2 | 3.1 | 2.4 | 1.8 | 1.6 | 19.5 | 2.3 |
| H *(10)/μSv · Gy−1 | 1.54 | 1.57 | 0.83 | 0.5 | 0.72 | 0.68 | 2.67 | 1.16 |
| H *(10)thm/% | 1 | 1 | 1 | 2 | 1 | 1 | 0 | 1 |
| H *(10)int/% | 1 | 2 | 2 | 3 | 3 | 3 | 1 | 2 |
| H *(10)fst/% | 62 | 84 | 86 | 85 | 90 | 92 | 52 | 92 |
| H *(10)hgh/% | 36 | 13 | 11 | 10 | 6 | 4 | 47 | 5 |
| (B) | ||||||||
|---|---|---|---|---|---|---|---|---|
| BONMA | Position | |||||||
| Quantity | 3 | 5 | 6 | 7 | 9 | 10 | 11 | 12 |
| Φ/103 · cm−2 · Gy−1 | 5.54 ± 0.10 | 6.47 ± 0.13 | 4.01 ± 0.07 | 2.83 ± 0.05 | 3.81 ± 0.06 | 3.79 ± 0.06 | 8.23 ± 0.17 | 5.10 ± 0.08 |
| Φthm /% | 12.2 | 11.9 | 18.1 | 21.8 | 17.6 | 19.3 | 7.1 | 9.8 |
| Φint /% | 21 | 25.8 | 27.8 | 31 | 32.6 | 32.6 | 15.1 | 29.6 |
| Φfst /% | 43.5 | 53.9 | 48.3 | 41.9 | 48 | 46.3 | 41.7 | 58.3 |
| Φhgh /% | 23.3 | 8.4 | 5.8 | 4.3 | 1.8 | 1.8 | 36.1 | 2.3 |
| Emean / MeV |
14.0 ± 1.1 | 5.51 ± 0.63 | 4.29 ± 0.26 | 3.48 ± 0.32 | 2.11 ± 0.12 | 2.19 ± 0.17 | 21.3 ± 1.4 | 2.62 ± 0.17 |
| H *(10)/μSv · Gy−1 | 1.60 ± 0.04 | 1.65 ± 0.05 | 0.87 ± 0.02 | 0.52 ± 0.01 | 0.72 ± 0.01 | 0.69 ± 0.01 | 2.79 ± 0.07 | 1.17 ± 0.02 |
| H *(10)thm/% | 0.4 | 0.4 | 0.8 | 1.2 | 0.9 | 1.1 | 0.2 | 0.4 |
| H *(10)int/% | 0.9 | 1.4 | 1.8 | 2.4 | 2.5 | 2.6 | 0.6 | 2 |
| H *(10)fst/% | 56 | 78.5 | 80.8 | 81.7 | 90.2 | 90 | 46.3 | 91.1 |
| H *(10)hgh/% | 42.7 | 19.7 | 16.6 | 14.7 | 6.4 | 6.3 | 52.9 | 6.5 |

Figure 3. Neutron spectra measured around the ten years-old CIRS phantom using the UAB ERBSS system set at positions 1–5 and the HMGU system set at positions 6–12. The figure also reports the results of the different unfolding codes including FRUIT-SGM (red) and FRUIT-PAR (blue) for UAB or BONMA (black) and MSANDB (green) for HMGU. The FRUIT-SGM and BONMA bin-per-bin uncertainties are shown in red and grey, respectively.
Download figure:
Standard image High-resolution imageWhen comparing the ten spectra, it can be seen that both HMGU and UAB extended-range ERBSS systems measured a very similar thermal component at all measurement positions 1–12 around the phantom. This can reasonably be explained by the fact that thermal neutrons are scattered isotropically inside the gantry room and are similar at all measurement positions. Meanwhile the ten spectra differ for the fast (100 keV ⩽ E < 20 MeV) and high (E ⩾ 20 MeV) energy components. Namely, neutron spectra measured at positions 5, 6, 7, 9, 10 and 12 involve two main components at the thermal (1 meV ⩽ E < 0.4 eV) and fast energy range. Meanwhile, spectra measured at positions 1, 2, 3, and 11 located along or close to the beam axis also show a large component of high energy neutrons almost nonexistent at all other positions (see figure 3). These high energy neutrons are mainly due to intra-nuclear cascade processes, resulting from reactions of the proton beam with the phantom, which are preferentially emitted in the forward direction, i.e. along the beam axis. Such high energy neutrons strongly contribute to the total dose deposition. Indeed, the highest H *(10) value of 2.7 μSv Gy−1 was measured at position 11 (at 329° to the beam axis and 1.63 m from the isocenter) where high energy neutrons of E ⩾ 20 MeV are the main contribution to the ambient dose equivalent value with about 53% (see table 3). It should also be noticed that evaporation neutrons in the fast energy range (100 keV ⩽ E < 20 MeV) are also emitted isotropically from the place of origin; nevertheless their peaks (widths and heights) show large angular dependence due to the added contribution of evaporation neutrons generated from the reaction of high-energy neutrons (E ⩾ 20 MeV), going in the forward direction, with heavy nuclei and high-Z materials (e.g. iron) present in the walls and the gantry counterweight. The impact of the angular emission of intra-nuclear cascade neutrons as well as the impact of the distance to the isocenter can also be seen on the fluence and H *(10) values. Specifically, at positions 3, 6 and 9 all located at 2.25 m from the isocenter, the largest H *(10) and fluence rates were measured at the smallest angle to the beam axis, i.e. position 3 at 45°. In addition, for positions 5, 6 and 7 located at the same (or mirror) angular position with respect to the beam axis, an increase in the distance to the isocenter resulted in a strong decrease in H *(10) from 1.65 μSv Gy−1 (at 150 cm) to 0.87 μSv Gy−1 (at 225 cm) and 0.52 μSv Gy−1 (at 325 cm).
Secondly, the investigation also focused on comparing the spectra measured at two very close positions, 1 and 2 (see figure 1(a)) only separated by 15 cm from each other (i.e. the difference of 1 cm distance to the isocenter and 5° with respect to the beam axis). The results showed very different spectra with a pronounced high energy peak (>20 MeV) at position 2 against a dominant fast-neutrons peak (100 keV ⩽ E < 20 MeV) at position 1. The mean energy Emean at position 1 was about 8 MeV while it increased to 16 MeV at position 2. In addition, the high energy peak at position 2 is about a factor 2 larger in terms of neutron fluence and H *(10) contributions (see table 2). These observations are not fully understood yet and have to be further investigated in a future study. One possible explanation could be the fact that neutrons going along the beam direction (position 1) may be interacting with high density bone and soft tissue materials when compared to those crossing through lung materials in the 355° direction.
Finally, spectra measured at positions 9 and 10, set at the same angular and distal position but at two different heights above the floor, are very similar in shape and amplitude showing no additional neutron scattering from the floor. Values of the mean energy, fluence and H *(10) values as well as their fractions (see table 3) measured at positions 9 and 10 further confirm that the scattering of neutrons on the floor is not significant.
3.2. Intercomparison of the ERBSS systems and unfolding codes
Figure 4 compares the spectra measured with the two ERBSS systems at positions 3 and 5 while considering different unfolding codes, namely BONMA and MSANDB, for HMGU data and FRUIT-SGM and FRUIT-PAR for UAB data. This figure shows very good agreement on the thermal component of the spectra while the high energy peaks can be different. Indeed, the deconvolution with FRUIT of the spectra measured at position 3 separates the evaporation and intra-nuclear cascade peaks while these are merged with the BONMA and MSANDB deconvolution codes. At position 5, the two systems and four unfolding codes differ in the amplitude of the high energy peak. It should be noticed that all three unfolding codes have used the same guess spectra simulated with the Geant4 MC code considering a simplified 144 MeV proton source.
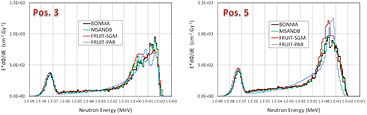
Figure 4. Comparison of neutron spectra measured at position 3 (left) and 5 (right) using the UAB unfolding codes FRUIT-SGM (red) and FRUIT-PAR (blue) as well as the HMGU unfolding codes BONMA (black) and MSANDB (green).
Download figure:
Standard image High-resolution imageMeanwhile, the quantitative comparison of the data given in tables 2 and 3 shows good agreement of the fluence and H *(10) values calculated by both ERBSS systems at positions 3 and 5, despite the observed small spectral differences. At both positions, and considering the mean fluence and H *(10) values of the two systems and four unfolding codes, the agreement on total neutron fluence and H *(10) values measured with the two systems remained within 3% and 8%, respectively.
Finally, table 3 shows the effect of the unfolding code on the fluence, H *(10) values and fractions. These show that values of neutron fluence and H *(10) did not vary by more than 5% with the different unfolding codes considering the HMGU data. Hence, it proves that the unfolding method has limited impact on the spectral data, further confirming the high precision of the results.
3.3. The influence of phantom type and material on stray neutrons
Neutron spectra measured at CCB-Krakow with the ten years-old CIRS phantom (CIRS 2013) were compared against previous results acquired at PTC-Trento with the same ERBSS systems and at identical positions while considering a scanning proton beam targeting a 30 × 30 × 60 cm3 water tank phantom (Farah et al 2015). The experimental setups also differ by the beam size (5 cm-diameter sphere here versus a 10 × 10 × 10 cm3 field previously), its maximum energy (144 MeV here against 172 MeV previously) and by the phantom setup (along the beam axis here versus 90° with respect to the beam axis previously). This comparison investigated the impact of other elements such as carbon, nitrogen and calcium on the production of internal neutrons.
Figure 5 reports neutron spectra measured here with the CIRS phantom or previously with the water-tank phantom at a distance of 225 cm to the isocenter and angles of 45°, 90° and 135°. All spectra were recorded using the HMGU extended-range ERBSS system and MSANDB unfolding code. From figure 5(a), one can clearly see that higher fluence rates were recorded in the previous experiments at all measurement positions. This is probably due to the higher energy range of the proton beam which results in larger neutron production rates and higher neutron energies. Additionally, to allow the comparison of CCB-Krakow and PTC-Trento results, spectra were normalized to the total neutron fluence. Hence, figures 5(b)–(d) show similar thermal and epithermal components on the normalized spectra proving the limited impact of the facility design, beam energy and patient morphology on these lowest energy neutrons. Meanwhile, large differences between CCB-Krakow and PTC-Trento spectra were observed at higher energies. At 45° (figure 5(b)), the water-tank experiments involved larger high energy neutrons (>20 MeV); this result was expected owing to the phantom setup used, as well as to the larger proton beam energy. Meanwhile, at an angle of 90° with respect to the beam axis (figure 5(c)), spectra measured with the water tank phantom set along this axis show a smaller evaporation neutron component compared to the CIRS measurements while an unexpected high energy peak is also visible. This result cannot be justified at this stage and requires further investigations. Finally, at 135° (figure 5(d)) both spectra strongly match, proving that backscattered neutrons are roughly independent of the proton beam maximum energy, field size, target volume and gantry position.

Figure 5. Comparison of neutron spectra measured around the ten years-old CIRS phantom at CCB-Krakow against those measured around a water-tank phantom at PTC-Trento (Farah et al 2015). These spectra were acquired at 225 cm from the isocenter at three different angles to the beam axis, namely of 45°, 90° and 135° using the HMGU extended-range ERBSS system and MSANDB unfolding code. Spectra in graph (a) are plotted on an absolute scale; spectra in graphs (b)–(d) are normalized to the total neutron fluence.
Download figure:
Standard image High-resolution image
4. Conclusion
In this work, two extended-range Bonner sphere spectrometry systems were used to characterize the stray neutron environment around an anthropomorphic phantom irradiated with a scanning proton beam for a brain tumor.
The paper shows ten spectra measured at all directions around the phantom, and we carefully studied the angular emission of intra-nuclear cascade neutrons while assessing the impact of the distance to the isocenter and angular orientation with respect to the beam axis on neutron spectra, fluence rates and H *(10) values. By fully visualizing the impact of the detector's position (in terms of distance to the isocenter and orientation to the beam axis) on the neutron spectra (average energy, intra-nuclear cascade and epithermal components, etc), these ERBSS spectrometry measurements allow, for the first time, a comprehensive understanding of the extensive literature data in which H *(10) values obtained with rem-counters are often reported.
Spectra comparison to previous water-tank data showed a large variation of neutron fluence rates with beam energy and phantom setup while the neutron production in water and the spectral energy distribution were similar to the anthropomorphic phantom, which also included carbon, nitrogen and calcium materials. This novel spectrometry result is extremely interesting since it confirms that the general agreement to use a water tank phantom to represent the human body is accurate not only for measuring the proton beam dose deposition itself but also in the simulation of secondary neutron production.
Finally, these spectrometry measurements provide valuable information on the exposure of patients' healthy organs to thermal, epithermal, evaporation and intra-nuclear cascade neutrons. These should be of direct clinical relevance and could lead to practical changes in dose prescription (change in beam orientation to preserve organs at risk for example) and would also be of great use for shielding design, radiation zoning and other radiation safety studies.
Future work will focus on understanding the unexpected differences between positions 1 and 2, and MC simulations of the experimental setup will hence be conducted and benchmarked against the ERBSS results.
Acknowledgments
This work was carried out within EURADOS WG9—Radiation dosimetry in radiotherapy. Authors would like to acknowledge M Liszka, K Skowrońska, A Kozera, M Kłodowska, N Adamek from the Department of Medical Physics and staff of the Cyclotron Proteus C-235 Section at CCB IFJ in Kraków, for their contribution to this work.