
Abstract
In order to study the effects of body sizes and masses of organs and tissues on internal dose assessment, the values corresponding to effective dose coefficients for intakes of radionuclides were calculated using the specific absorbed fractions (SAFs) of two phantoms: the average adult Japanese male phantom (JM-103) and the reference computational phantom-adult male (RCP-AM) of the International Commission on Radiological Protection. SAFs were evaluated using the phantoms and Monte Carlo radiation transport code MCNPX or were taken from published data. As a result of a comparison for 2894 cases of 923 radionuclides, the maximum discrepancy in the effective dose coefficients between the JM-103 and RCP-AM was about 40%. However, the discrepancies were smaller than 10% in 97% of all cases.
Export citation and abstract BibTeX RIS
1. Introduction
The International Commission on Radiological Protection (ICRP) is developing new dose coefficients for intakes of radionuclides based on the 2007 Recommendations (ICRP 2007). The dose coefficients will be provided as fundamental data for radiation protection applicable to all races (ICRP 2012). The specific absorbed fractions (SAFs) applied in the calculation of the dose coefficients for adult males and females are evaluated using adult reference computational phantoms (ICRP 2009). These phantoms are constructed based on medical tomographic image data of real persons and are consistent with the reference anatomical and physiological data of Caucasian given in ICRP Publication 89 (ICRP 2002). The SAF values depend on the height and weight, organ masses, and positional relationships between the organs (hereinafter collectively called 'physical characteristics') of the phantom. Therefore, the dose coefficients of the ICRP are based on the physical characteristics of Caucasian and may be different from the values obtained using a phantom of another race. Information on the influence of differences in physical characteristics on internal doses is helpful in applying the dose coefficients of the ICRP to races other than Caucasian.
The height and weight of adult Japanese are generally smaller than those of adult Caucasian (Tanaka and Kawamura 1996, ICRP 2002). In order to study the dosimetric characteristics of internal exposure for Japanese, a comprehensive data set of SAFs calculated using a Japanese phantom is essential. In the past, adult male Japanese phantoms, Otoko (Saito et al 2001), Taro (Nagaoka et al 2004) and JM (Sato et al 2007), and adult female Japanese phantoms, Onago (Saito et al 2008), Hanako (Nagaoka et al 2004) and JF (Sato et al 2009), have been reported. These phantoms are modeled using medical tomographic images of volunteers. Therefore, their anatomies reflect the physical characteristics of the particular volunteers. For this reason, the representative SAFs for adult Japanese cannot be evaluated using these Japanese phantoms. It is also impossible to assign the tissue weighting factors (wT) of the 2007 Recommendations directly to the values corresponding to the equivalent dose defined by the ICRP (hereinafter referred to as 'equivalent dose') because some organs and tissues weighed by the wT of the Recommendations are not segmented nor modeled. Then, we had previously developed average adult Japanese male and female voxel phantoms, JM-103 and JF-103, by modifying the JM and JF phantoms (Sato et al 2011). The heights and weights of JM-103 and JF-103 are consistent with the Japanese average, and the masses of the organs and tissues are adjusted to the Japanese averages within plus or minus 10% except for the bone tissues. Therefore, the representative internal doses for Japanese adults can be evaluated using the SAFs of JM-103 and JF-103 (Sato et al 2012). In addition, their organs and tissues are segmented along with the wT of the 2007 Recommendations to directly compare the values corresponding to the effective dose (hereinafter referred to as 'effective dose') of adult Japanese with those of adult Caucasian.
The purpose of this study was to clarify the effects of differences in physical characteristics between adult Japanese and Caucasian on internal dose assessment. The electron and photon SAFs of JM-103 were calculated with the Monte Carlo code, MCNPX (Pelowitz 2008). The electron SAFs of the ICRP reference computational phantom-adult male (RCP-AM) were cited from the data by Zankl et al (2012). However, radiation transport calculations using the RCP-AM were performed to obtain the photon SAFs in this study because a comprehensive data set of the photon SAFs has not been published. Then, the effective doses per unit intake (effective dose coefficients) could be evaluated for the representative Japanese and Caucasian adult male workers using SAFs of the two phantoms. The effects of physical characteristics on internal dose assessment were analyzed and discussed according to the effective dose coefficients for JM-103 and the RCP-AM.
2. Materials and methods
2.1. Adult male phantoms used in this study
The height and weight of JM-103 are 171 cm and 65 kg, respectively. These values are adjusted to coincide with Japanese averages (Tanaka and Kawamura 1996). The RCP-AM is 176 cm in height and has a weight of 73 kg. These values are based on the reference data for Caucasian (ICRP 2002). The height of JM-103 is only 3% smaller than that of the RCP-AM while the weight of JM-103 is 11% smaller than that of the RCP-AM. This is mainly due to the difference in the mass of the adipose tissue as shown in table 1. In addition, the difference in skin weight is also large. This is caused by the difference in not only the body size but also the voxel size between JM-103 and the RCP-AM. Skin is defined as the outermost voxel layer of the whole body in these phantoms. Therefore, the thickness and the mass of the skin of the phantoms depend on their voxel size (Sato et al 2011). The voxel sizes of JM-103 and the RCP-AM are 0.98 × 0.98 × 1 mm3 and 2.137 × 2.137 × 8 mm3, respectively. The voxel size of JM-103 is smaller than the average thickness of skin, which is about 1.6 mm (ICRP 2002). Therefore, the mass of the skin in JM-103 is smaller than that of the average Japanese: 2.4 kg. On the other hand, the voxel size of the RCP-AM is large to reproduce the mass of the skin of the reference Caucasian: 3.3 kg. In addition to these large differences in adipose tissue and skin, differences in the mass of the colon, urinary bladder, and liver are over 10%. Masses of these organs appear to be in proportion to body weight. However, the masses of the lungs, brain, kidneys and bone tissues of JM-103 are larger than those of the RCP-AM despite JM-103 being smaller than the RCP-AM. The comparison results as to the lungs, brain and kidneys are derived from the difference in the physical characteristics between Japanese and Caucasian. In regard to the bone tissues, the discrepancy in the masses was caused by the difference in the identification and construction methods of bone tissues between JM-103 and the RCP-AM. The bone tissues of the RCP-AM are modeled using the mass data based on autopsies (ICRP 2002, 2009). On the other hand, the bone tissues of JM-103 are directly segmented by CT-value data. As a result, the bone tissues of JM-103 contain some peripheral connective tissues, and the mass of the bone tissues of JM-103 are larger than those of the RCP-AM (Sato et al 2011).
Table 1. Masses of some organs and tissues in JM-103 and the RCP-AM.
| Mass (kg) | ||
|---|---|---|
| Organ, tissue | JM-103 | RCP-AM |
| Red bone marrow | 1.192 | 1.170 |
| Colon | 0.326 | 0.370 |
| Lungs | 1.215 | 1.201 |
| Stomach | 0.141 | 0.150 |
| Breast | 0.023 | 0.025 |
| Testes | 0.036 | 0.035 |
| Urinary bladder | 0.039 | 0.050 |
| Esophagus | 0.036 | 0.040 |
| Liver | 1.462 | 1.800 |
| Thyroid | 0.020 | 0.020 |
| Brain | 1.529 | 1.450 |
| Salivary glands | 0.086 | 0.085 |
| Skin | 2.189 | 3.882 |
| Small intestine | 0.557 | 0.650 |
| Kidneys | 0.333 | 0.310 |
| Pancreas | 0.136 | 0.140 |
| Total bone tissues | 11.021 | 10.448 |
| Adipose tissue | 14.192 | 20.456 |
| Total body tissuesa | 64.028 | 72.191 |
aWhole body minus contents of alimentary tract, gall bladder and urinary bladder.
2.2. SAFs used in this study
Calculation of effective dose coefficients requires SAFs for all combinations of source regions where radionuclides are distributed and target tissues and organs (target regions) to which the tissue weighting factors are assigned. The electron SAFs reported by Zankl et al (2012) were used to calculate the dose coefficients for the RCP-AM. The photon SAFs for the RCP-AM and JM-103 and the electron SAFs for JM-103 were calculated in this study.
The microscopic structures of the respiratory tract, alimentary tract and bone tissues should be considered in electron transport simulation. However, it is impossible to model these structures using millimeter-sized voxels. Therefore, the electron SAFs reported by the Human Respiratory Tract Model (HRTM) (ICRP 1994a), the Human Alimentary Tract Model (HATM) (ICRP 2006), and Hough et al (2011) were used for calculation of the effective dose coefficients of both JM-103 and the RCP-AM.
2.2.1. Code system and calculation conditions
The deposited energies in the target regions were calculated using the Monte Carlo radiation transport code, MCNPX 2.6.0 (Pelowitz 2008) incorporating JM-103 and the RCP-AM. The libraries el03 (Adams 2000) and mcplib04 (White 2002) were used as electron and photon cross sectional data, respectively. The lower energy cutoff was set at 1 keV for both electrons and photons. Transport of secondary electrons produced by interactions of primary photons with materials was taken into account. Calculations were performed at 15 energy points ranging from 10 keV to 5 MeV about combinations of 41 source and 33 target regions.
2.2.2. Definition of source
Mono-energetic sources were homogeneously distributed in a source region. When the source region was blood or total body tissues (T-body), the sources were distributed considering the mass contents of the blood or the masses of organs and tissues, respectively. Here, T-body indicates whole body minus contents of the alimentary tract, gall bladder, and urinary bladder. The source definitions described above were applied to both JM-103 and the RCP-AM.
The segmentation of bone tissues is different between JM-103 and the RCP-AM. The bone tissues of the RCP-AM are segmented to 44 sites (19 anatomical regions and 3 types of tissues: cortical bones, spongiosa and marrow cavities) (ICRP 2009). The sources were homogeneously distributed in the cortical bones when the cortical bone surface or cortical bone volume (CBV) was a source region. When the trabecular bone surface, trabecular bone volume, or red bone marrow (RBM) was a source region, the sources were distributed in the spongiosa and marrow cavities according to the content of the compact bone or RBM for each bone site (ICRP 2009). On the other hand, the bone tissues of JM-103 are segmented to 140 sites (20 anatomical regions and 7 types of compact bone and bone marrow mixtures) to reproduce the detailed density distribution (Sato et al 2010). The sources were distributed based on the calculated proportions of the cortical bone, trabecular bone and RBM for each site using the data from ICRP Publication 70 (ICRP 1995b).
2.2.3. Evaluation of deposited energy in target regions
The 'f6' tallies in MCNPX were used to evaluate the deposited energies averaged over the designated cells. The deposited energy in the RBM and bone surface (BS), however, cannot be directly tallied because these bone tissues are not segmented in both JM-103 and the RCP-AM.
In the case of the RCP-AM, the RBM is distributed in the spongiosa, and the BS is distributed in the spongiosa and the marrow cavities (ICRP 2009). Dose response functions (DRFs) (Petoussi-Henss et al 2010) were used to evaluate the deposited energy (Edep) for photons in the RBM and the BS according to the following equation (Petoussi-Henss et al 2010):

where c (MeV J−1) is the constant value (6.242×10¹²) to convert the unit from J to MeV, Mi (kg) is the mass of the RBM or the BS of the bone site i, Ep (MeV) is the maximum energy of photons emitted from a source region, Φi(E) (m−2) is the fluence in the bone site i for the photon whose energy is E (MeV), and DRFi(E) (Gy m2) is the energy dependent DRF for the RBM or the BS of the bone site i, respectively. The fluence was obtained by 'f4' tallies in MCNPX.
The bone tissues of JM-103 are constructed as a mixture of compact bone and bone marrow. The Edep in the RBM and the BS for electrons were calculated by dividing the deposited energy in each bone site in accordance with the mass ratio of the RBM and BS to the bone site. In calculations of Edep for photons, the DRFs are not applicable to JM-103 because the segmentation of the bone tissues of JM-103 is different from that of the RCP-AM. The mass energy-absorption coefficients (µen/ρ) for the RBM and BS calculated using the elemental composition data of JM-103 (Sato et al 2011) and the element-specific µen/ρ (Hubbell and Seltzer 1995) were used to obtain the Edep as

where Mj (kg) is the mass of the RBM or BS of the bone site j, and  (E) (m2 kg−1) is the energy-dependent µen/ρ for the RBM or BS. The equation (2) using µen/ρ is an established method for calculating the deposited energy in a constituent part of a mixture (Cristy and Eckerman 1987). However, it should be mentioned that (2) might lead to an underestimation of energy deposited in RBM and BS in the energy range below approximately 200 keV because (2) does not account for the dose enhancement to RBM and BS from neighboring trabecular bones (Johnson et al 2011). On the other hand, overestimation of Edep is caused by the use of µen/ρ when the photon energy is more than a few MeV (Lee et al 2006). Therefore, the values of Edep for photons from 1 to 5 MeV were calculated in the same way as that of electrons.
2.3. Calculation of effective dose coefficients
The effective dose coefficient, e (Sv Bq−1), was calculated for intake of radionuclides by male workers. All of radionuclides that do not emit any particles other than electrons and photons were selected from the radionuclides contained in ICRP Publication 107 (ICRP 2008) to clarify the overall influence of differences in physical characteristics between Japanese and Caucasian on e. The number of selected radionuclides was 923. The classification of chemical forms for ingestion and types of absorption to blood for inhalation (hereinafter called 'case') followed that of ICRP Publication 68 (ICRP 1994b). The values of e were calculated for all the cases of ingestion and inhalation of 923 nuclides. Then, the number of calculated cases of e was 1873 for inhalation and 1021 for ingestion.
The values of e were calculated as (ICRP 2007)

where hT (Sv Bq−1) is the equivalent dose coefficient of a target region T, and wT is the tissue weighting factor for T. The value of hT was calculated by the following equation (ICRP 1994b):

where c' (J MeV−1) is the constant value (1.602×10¹³) to convert the unit from MeV to J, U(50)S,k (Bq−1) is the cumulative number of nuclear transformations of the decay chain member k in a source region S during 50 years per unit intake, and SEE(T ← S)k (Sv) is the specific effective energy (SEE). Then, SEE was calculated using the following equation (ICRP 2006):
where Ek,l (MeV), Yk,l, wR,k,l, and SAF(T ← S; Ek,l) (kg−1) are the energy, yield, radiation weighting factor (wR) and SAF from S to T, respectively, of radiation l emitted from the decay chain member k; wR,β is the wR for electrons; Ek,β (MeV) is the maximum energy of beta particles emitted from the decay chain member k; and Y(E) (MeV−1) and SAF(T ← S; E) (kg−1) are the energy-dependent yield and SAF for beta particles whose kinetic energy is E (MeV), respectively. SAFs for given energies were obtained by interpolation of the discrete SAFs using the piecewise cubic Hermite interpolation polynomial.
The wT and wR of the 2007 Recommendations (ICRP 2007) were used in (3) and (5). The hT for remainder tissues (consisting of 13 organs and tissues) was calculated as the arithmetic average of their hT values (ICRP 2007). The hT for the lungs was evaluated as the sum weighted by the detriment factors of the values of hT for the bronchi, bronchiole, and alveolar interstitial (AI), and all detriment factors were 1/3 (ICRP 2012). However, the bronchiole and AI are not segmented in JM-103 and the RCP-AM. Thus, lung tissue was used as a surrogate tissue in calculating the SAFs and hT values for the bronchiole and AI (ICRP 2009). The hT for the colon was the mass-weighted average of the hT values for the right colon wall, left colon wall, and recto-sigmoid colon wall (ICRP 2006). The U(50)S,j was obtained by solving ordinary differential equations (ODEs) based on biokinetic models recommended by the ICRP. ODEs were solved by the method of Leggett et al (1993). Used biokinetic models were as follows: the HRTM (ICRP 1994a) for clearance from the respiratory tract region; the HATM (ICRP 2006) for transit in the alimentary tract region; element-specific systemic models provided in ICRP Publications 30, 56, 67, 69 and 71 (ICRP 1979, 1980, 1981, 1990, 1993, 1995a, 1995c); and the bladder model of ICRP Publication 67 (ICRP 1993) for excretion of urine.
3. Results and discussion
3.1. Comparison of effective and equivalent dose coefficients
The difference in the effective dose coefficient between JM-103 and the RCP-AM, De (%), was defined as

where eJM (Sv Bq−1) and eAM (Sv Bq−1) are the effective dose coefficients calculated using the SAFs of JM-103 and the RCP-AM, respectively. The histograms of the values of De for inhalation and ingestion are shown in figure 1. The values of De ranged from −23% to 18% for inhalation and from −23% to 41% for ingestion. There was little difference in the distribution of the values of De between inhalation and ingestion. In 97% of cases for inhalation and 96% of cases for ingestion, the De ranged from −10% to 10%. This revealed that the effects of the differences in physical characteristics between JM-103 and the RCP-AM on effective dose coefficients were small in most cases.
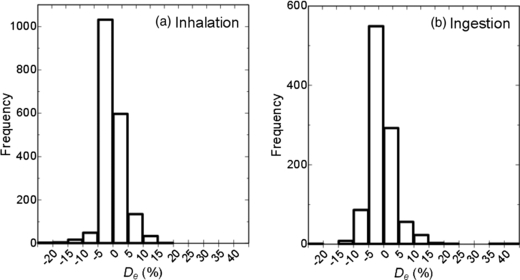
Figure 1. Histograms of differences in effective dose coefficients (De) for (a) inhalation and (b) ingestion between JM-103 and the RCP-AM.
Download figure:
Standard image High-resolution imageIn order to determine why the De was small in most cases, the difference in the equivalent dose coefficients between JM-103 and the RCP-AM, DhT (%), which was calculated in the same manner as given in (6), was analyzed. The DhT values ranged from −99.7% to 42 000%. The distribution range of the DhT values was much wider than that of De.
The absolute values of hT for one intake case are often significantly changed because the radionuclides incorporated into a human body are distributed in particular organs and tissues following their element specific biokinetics in many cases. Thus, it is important to consider the degree of contribution of hT to e. Now, the contribution rate, chT, can be introduced for the RCP-AM as follows:

where hT_AM is the hT for the RCP-AM. The ratios of the hT values for JM-103 (hT_JM) to those of hT_AM, i.e., rhT, were calculated for all obtained equivalent doses. Figure 2 shows the relationship between chT and rhT. A value of chT was small if rhT was much larger or smaller than 1. In such cases, the influence of large DhT values on De was omitted during the calculation of e by (3) because relative magnitude of the value of concerned hT was very small. On the other hand, the rhT was around 1; the absolute value of DhT was small when the chT was large. The hT values for self-irradiation cases usually become relatively large. Self-irradiation means that the target and source regions are the same. The SAFs for self-irradiation (self-SAFs) depend on the mass of the organ or tissue (Zankl et al 2003, Kinase et al 2003). This made the extent of the DhT similar to that of the difference in the mass of the organ or tissue between JM-103 and the RCP-AM. Differences in the mass of an organ and tissue which is a source region and a subject of wT-weighting are no more than several tens per cent as shown in table 1. In addition, the effects of DhT on De were weakened by the process of (3). For these reasons, the absolute values of De were small in most cases.

Figure 2. Relationship between the contribution of the equivalent dose coefficient to the effective dose coefficient (chT) and the ratio of the equivalent dose coefficient for JM-103 to that for the RCP-AM (rhT).
Download figure:
Standard image High-resolution image3.2. Analyses of the differences in effective dose coefficients
Table 2 shows the calculation results of cases in which the absolute values of De exceeded 15%. As a result of analyses of the cases shown in table 2, we identified four causes of large absolute values of De. The causes were the differences between JM-103 and the RCP-AM in a: the mass of total body tissues, b: the mass of the target organ, c: the positional relationship between the source and target regions, and d: the segmentation of bone tissues. It should be noted that the last cause is not due to differences in physical characteristics between Japanese and Caucasian.
Table 2. Calculation results of the effective dose coefficient (e) with a large absolute value of a difference in the effective dose coefficient (De).
| e (Sv Bq−1) | ||||||
|---|---|---|---|---|---|---|
| Nuclide | Intake way | Chemical form or absorption type to blood | JM-103 | RCP-AM | De (%) | Cause index* |
| 189mOs | Ingestion | All compounds | 1.22E−13 | 8.65E−14 | 41 | c |
| 193Pt | Ingestion | All compounds | 1.87E−12 | 1.38E−12 | 36 | c |
| 91Nb | Ingestion | All compounds | 2.24E−11 | 1.81E−11 | 24 | c |
| 111Ag | Inhalation | F | 3.82E−10 | 3.24E−10 | 18 | b |
| 93mNb | Ingestion | All compounds | 1.11E−11 | 9.49E−12 | 17 | b |
| 103Pd | Ingestion | All compounds | 2.59E−11 | 2.22E−11 | 17 | c |
| 194Os | Inhalation | F | 1.28E−08 | 1.10E−08 | 16 | b |
| 193mIr | Ingestion | All compounds | 3.76E−12 | 3.24E−12 | 16 | b, c |
| 71Ge | Ingestion | All compounds | 3.81E−12 | 3.32E−12 | 15 | a |
| 189mOs | Inhalation | F | 1.49E−12 | 1.30E−12 | 15 | a, c |
| 92Nb | Inhalation | S | 1.52E−08 | 1.98E−08 | −23 | c |
| 93Mo | Ingestion | Other than sulfide | 4.48E−10 | 5.83E−10 | −23 | d |
| 93Mo | Inhalation | F | 2.46E−10 | 3.21E−10 | −23 | d |
| 91Nb | Inhalation | S | 6.60E−10 | 8.30E−10 | −20 | c |
| 108mAg | Inhalation | S | 2.16E−08 | 2.68E−08 | −19 | c |
| 102mRh | Inhalation | S | 1.16E−08 | 1.40E−08 | −17 | c |
| 93Mo | Inhalation | S | 8.51E−10 | 1.01E−09 | −16 | c |
| 88Zr | Inhalation | S | 2.03E−09 | 2.41E−09 | −16 | c |
| 60Co | Inhalation | S | 1.82E−08 | 2.13E−08 | −15 | c |
| 143Pm | Inhalation | S | 8.18E−10 | 9.64E−10 | −15 | c |
*Cause indices indicate the differences between JM-103 and the RCP-AM in a: the mass of total body tissues, b: the mass of the target region, c: the positional relationship between the source and target regions, and d: the segmentation of bone tissues.
3.2.1. Difference in the mass of total body tissues
Table 3 compares the values of hT and e for ingestion of 71Ge of JM-103 with those of the RCP-AM. The hT values of JM-103, except for those of the RBM and BS, were larger than those of the RCP-AM.
Table 3. Comparison of the equivalent dose coefficient (hT) and effective dose coefficient (e) between JM-103 and the RCP-AM for ingestion of 71Ge and their differences (DhT, De).
| hT, e (Sv Bq−1) | |||
|---|---|---|---|
| Organ, tissue | JM-103 | RCP-AM | DhT, De (%) |
| Red bone marrow | 1.81E−12 | 1.99E−12 | −9 |
| Colon | 5.97E−12 | 4.97E−12 | 20 |
| Lungs | 6.24E−12 | 5.36E−12 | 16 |
| Stomach | 4.78E−12 | 4.10E−12 | 17 |
| Breast | 2.17E−12 | 1.87E−12 | 16 |
| Testes | 1.98E−12 | 1.76E−12 | 13 |
| Urinary bladder | 2.23E−12 | 1.62E−12 | 38 |
| Esophagus | 4.56E−12 | 3.94E−12 | 16 |
| Liver | 4.80E−12 | 4.15E−12 | 16 |
| Thyroid | 3.14E−12 | 2.77E−12 | 13 |
| Bone surface | 1.50E−12 | 1.64E−12 | −9 |
| Brain | 1.80E−12 | 1.58E−12 | 14 |
| Salivary glands | 3.14E−12 | 2.76E−12 | 14 |
| Skin | 1.82E−12 | 1.61E−12 | 13 |
| Remainder | 3.83E−12 | 3.42E−12 | 12 |
| Effective dose coefficient | 3.81E−12 | 3.32E−12 | 15 |
The ICRP systemic model for germanium (ICRP 1981) assumes that half of the incorporated radionuclides is distributed in T-body, and the remaining half transfers to the kidneys and is rapidly excreted after uptake to the blood. Then, the electron energy accounts for 55% of the total energy emitted from 71Ge per unit transformation and is dominant in the contribution to hT and e. Therefore, the main cause of this result was the difference in the electron SAFs from T-body to each target region between JM-103 and the RCP-AM because the U(50) of T-body was the largest among all the source regions. As an example, figure 3 shows the SAFs for electrons and photons from T-body to the liver. Electron SAFs of JM-103 were 12% larger than those of the RCP-AM for all energy ranges. This was caused by the difference in the mass of T-body between the two phantoms. The SAFs for electrons from T-body is nearly equal to the inverse of the mass of T-body (Zankl et al 2012).

Figure 3. Specific absorbed fractions (SAFs) for electrons from total body tissues (T-body) to liver.
Download figure:
Standard image High-resolution imageOn the other hand, the hT values for the RBM and BS of JM-103 were smaller than those of the RCP-AM. This was caused by differences in the segmentation of bone tissues between the two phantoms as described in subsection 3.2.4.
3.2.2. Difference in the mass of the target region
The calculation results for inhalation of 111Ag type F are shown in table 4. The hT for the liver was the maximum among all target regions, and the DhT for the liver was relatively large. Therefore, the large De was caused by the DhT for the liver.
Table 4. Comparison of the equivalent dose coefficient (hT) and effective dose coefficient (e) between JM-103 and the RCP-AM for inhalation of 111Ag type F and their differences (DhT, De).
| hT, e (Sv Bq−1) | |||
|---|---|---|---|
| Organ, tissue | JM-103 | RCP-AM | DhT, De (%) |
| Red bone marrow | 1.77E−10 | 1.07E−10 | 65 |
| Colon | 3.82E−10 | 3.57E−10 | 7 |
| Lungs | 1.87E−10 | 1.76E−10 | 6 |
| Stomach | 2.82E−10 | 2.53E−10 | 11 |
| Breast | 1.13E−10 | 1.03E−10 | 10 |
| Testes | 1.10E−10 | 9.68E−11 | 14 |
| Urinary bladder | 1.17E−10 | 9.52E−11 | 23 |
| Esophagus | 2.01E−10 | 1.33E−10 | 51 |
| Liver | 4.19E−09 | 3.43E−09 | 22 |
| Thyroid | 1.23E−10 | 1.09E−10 | 13 |
| Bone surface | 1.27E−10 | 9.92E−11 | 28 |
| Brain | 1.12E−10 | 9.64E−11 | 16 |
| Salivary glands | 1.24E−10 | 1.08E−10 | 15 |
| Skin | 1.08E−10 | 1.01E−10 | 7 |
| Remainder | 3.85E−10 | 3.49E−10 | 10 |
| Effective dose coefficient | 3.82E−10 | 3.24E−10 | 18 |
In this case, the U(50) of the liver was the largest among all source regions. Since the electron energy accounts for 93% of the mean energies emitted from 111Ag per unit transformation, the DhT for the liver was caused by the difference in self-SAFs for electrons in the liver. Figure 4 shows the electron self-SAFs for the liver. The self-SAFs of JM-103 were 19%–23% larger than those of the RCP-AM. As described in section 3.1, self-SAFs depend on the mass of the organ and tissue (Zankl et al 2003, Kinase et al 2003). The mass of the liver in the RCP-AM is 23% larger than that in JM-103 as shown in table 1. The difference in the mass of the liver caused the discrepancy of self-SAFs for the liver and e in this case.
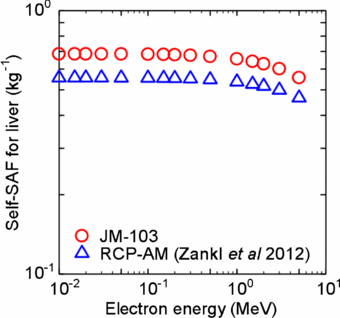
Figure 4. Specific absorbed fractions for electrons for self-absorption (self-SAFs) in the liver.
Download figure:
Standard image High-resolution imageOther than liver, there was no organ and tissue whose mass difference caused De more than 10%.
3.2.3. Differences in the positional relationship between source and target regions
Table 5 shows the calculation results for inhalation of 92Nb type S. The hT for the lungs was the maximum among all target regions. The hT value for the lungs was equal to the arithmetical average of the hT values for the bronchi, bronchiole, and AI because the same detriment factor was assigned to each of the three regions (ICRP 2012). In this case, the hT for the bronchi was the largest of the three regions. Thus, the De was mainly caused by the DhT for the bronchi.
Table 5. Comparison of the equivalent dose coefficient (hT) and effective dose coefficient (e) between JM-103 and the RCP-AM for inhalation of 92Nb type S and their differences (DhT, De).
| hT, e (Sv Bq−1) | |||
|---|---|---|---|
| Organ, tissue | JM-103 | RCP-AM | DhT, De (%) |
| Red bone marrow | 1.07E−08 | 1.15E−08 | −7 |
| Colon | 3.79E−09 | 4.11E−09 | −8 |
| Lungs | 5.24E−08 | 7.17E−08 | −27 |
| Stomach | 1.10E−08 | 1.33E−08 | −17 |
| Breast | 1.60E−08 | 1.47E−08 | 9 |
| Testes | 3.34E−10 | 1.70E−10 | 96 |
| Urinary bladder | 1.23E−09 | 6.73E−10 | 83 |
| Esophagus | 2.63E−08 | 4.46E−08 | −41 |
| Liver | 1.50E−08 | 1.62E−08 | −7 |
| Thyroid | 1.45E−08 | 3.76E−08 | −61 |
| Bone surface | 5.36E−09 | 4.62E−09 | 16 |
| Brain | 2.03E−09 | 1.64E−09 | 24 |
| Salivary glands | 5.14E−09 | 6.21E−09 | −17 |
| Skin | 3.17E−09 | 2.79E−09 | 14 |
| Remainder | 1.22E−08 | 1.50E−08 | −19 |
| Effective dose coefficient | 1.52E−08 | 1.98E−08 | −23 |
Almost all of the total energy of 92Nb is emitted as photons. The U(50) values of the bronchi and AI, which surrounds the bronchi, accounted for 0.3% and 84% of the total number of transformations in the whole body, respectively. Thus, the large hT for the bronchi was caused by the radiation emitted from the AI, and the large DhT for the bronchi was induced by differences in photon SAFs from the AI to the bronchi between JM-103 and the RCP-AM as shown in figure 5. The main radiations emitted from 92Nb are 561 and 935 keV photons, and their yields are 100%. Photon SAFs of the RCP-AM at these energies were about 80% larger than those of JM-103. This discrepancy in SAFs was induced by the difference in the positional relationship between the AI and bronchi. Figure 6 shows the distribution of the distance between the centroids for all combinations of AI voxels and bronchi voxels. These data confirmed that the positional relationship between the AI and bronchi of the RCP-AM is closer than that of JM-103. The abdominal organs and tissues of the RCP-AM are shifted toward the lungs by the pressure of the adipose tissue because the amount of the adipose tissue in the RCP-AM is larger than that in JM-103. As a result, the thoracic cavity is compressed by the abdominal organs and tissues. This makes the distance between the AI and bronchi in the RCP-AM shorter than that in JM-103.
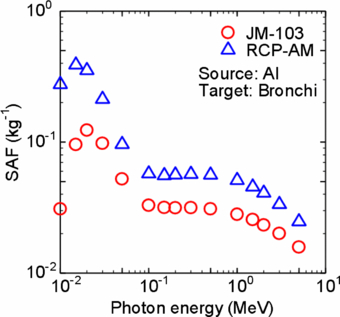
Figure 5. SAFs for photons from alveolar interstitial (AI) to bronchi.
Download figure:
Standard image High-resolution image
Figure 6. Distribution of the distances between centroids for all combinations of AI voxels and bronchi voxels.
Download figure:
Standard image High-resolution imageIn the cases of ingestion of Os-189m (all compounds), ingestion of Pt-193 (all compounds), and ingestion of Nb-91 (all compounds) shown in table 2, the positional relationship between colon content and colon wall affected the values of De. For ingestion of Pd-103 (all compounds), the positional relationship between colon content and urinary bladder wall caused the De. These differences in the positional relationships between source and target regions were induced by the expansion in head-leg direction of the abdominal cavity of the RCP-AM.
3.2.4. Differences in the segmentation of bone tissues
The calculated doses for ingestion of 93Mo other than sulfide compounds are shown in table 6. The DhT for the RBM caused the large De.
Table 6. Comparison of the equivalent dose coefficient (hT) and effective dose coefficient (e) between JM-103 and the RCP-AM for ingestion of 93Mo other than sulfide compounds and their differences (DhT, De).
| hT, e (Sv Bq−1) | |||
|---|---|---|---|
| Organ, tissue | JM-103 | RCP-AM | DhT, De (%) |
| Red bone marrow | 1.16E−09 | 2.17E−09 | −47 |
| Colon | 1.99E−10 | 1.99E−10 | 0 |
| Lungs | 3.31E−10 | 4.15E−10 | −20 |
| Stomach | 1.71E−10 | 1.72E−10 | −1 |
| Breast | 9.30E−11 | 1.08E−10 | −14 |
| Testes | 1.18E−10 | 1.15E−10 | 3 |
| Urinary bladder | 2.72E−10 | 2.43E−10 | 12 |
| Esophagus | 3.77E−10 | 5.01E−10 | −25 |
| Liver | 1.88E−09 | 1.61E−09 | 17 |
| Thyroid | 1.57E−10 | 2.09E−10 | −25 |
| Bone surface | 4.19E−09 | 3.66E−09 | 14 |
| Brain | 2.78E−10 | 5.48E−10 | −49 |
| Salivary glands | 2.66E−10 | 4.09E−10 | −35 |
| Skin | 1.92E−10 | 1.96E−10 | −2 |
| Remainder | 3.95E−10 | 4.74E−10 | −17 |
| Effective dose coefficient | 4.48E−10 | 5.83E−10 | −23 |
The U(50) of the CBV was the largest among all source regions because molybdenum is a bone-seeker element (ICRP 1993). Then, 66% of the total energies of 93Mo is emitted as photons. Therefore, the DhT for the RBM was derived from the differences in photon SAFs from the CBV to the RBM as shown in figure 7. SAFs for the RCP-AM were about 10% larger than those for JM-103 when the photon energy is higher than 100 keV. In contrast, the difference in the SAFs for 15 keV photons was about 60%. This discrepancy in SAFs for low energy photons was caused by the method of calculation of SAFs in bone tissues for the two phantoms. The DRFs used in calculating SAFs of the RCP-AM are evaluated considering the escape of secondary electrons from trabecular bone tissues to the neighboring marrow (Johnson et al 2011). On the other hand, the µen/ρ does not include the escape of secondary electrons in calculating the SAFs of JM-103. Since the energy of photons mainly emitted from 93Mo is about 17 keV, the large DhT value for the RBM was obtained.

Figure 7. SAFs for photons from cortical bone volume (CBV) to red bone marrow (RBM).
Download figure:
Standard image High-resolution image
In this case, the De was not due to differences in the physical characteristics between Japanese and Caucasian, but was instead due to difference in the modeling methods used for JM-103 and the RCP-AM. However, there were only two cases in which differences in the segmentation of bone tissues were the main cause of De having absolute values of over 10%.
4. Conclusion
The effective dose coefficients for male workers were calculated using SAFs of the average adult Japanese male phantom (JM-103) and the RCP-AM. The values were compared with each other to study the effects of differences in physical characteristics between the two phantoms on internal doses. As a result of analyses of 1873 cases for inhalation and 1021 cases for ingestion of 923 radionuclides, the discrepancies in the effective dose coefficients were caused by differences in the mass of total body tissues, mass of the target region, and positional relationship between the target and source regions. However, our data revealed that the effects of differences between JM-103 and the RCP-AM on effective dose coefficients were limited, as the differences stayed within a range from −10% to 10% in 97% of all calculated cases. This finding is helpful in application of effective dose coefficients developed by the ICRP to races whose characteristics of body size, tissue masses, etc. are different from those of Caucasian.
Some cases exhibited large differences in the effective and equivalent dose coefficients depending on the distribution of radionuclides incorporated into the body and the characteristics of radiation emitted from these radionuclides. Therefore, the data set of SAFs for JM-103 will be useful in retrospective dose estimation at the time of a nuclear accident and in the study of nuclear medicine, etc, for adult Japanese men.
Acknowledgments
The authors would like to express their gratitude to Dr D Sato and Dr F Takahashi of the Japan Atomic Energy Agency for their technical advice on the Monte Carlo calculations and for beneficial discussions.