
Abstract
A double-tuned 23Na/1H resonator system was developed to record multinuclear MR image data during and after transient cerebral ischemia. 1H-diffusion-, 1H perfusion, 1H T2-, 1H arterial blood flow- and 23Na spin density-weighted images were then acquired at three time points in a rodent stroke model: (I) during 90 min artery occlusion, (II) directly after arterial reperfusion and (III) one day after arterial reperfusion. Normal 23Na was detected in hypoperfused stroke tissue which exhibited a low 1H apparent diffusion coefficient (ADC) and no changes in 1H T2 relaxation time during transient ischemia, while 23Na increased and ADC values recovered to normal values directly after arterial reperfusion. For the first time, a similar imaging protocol was set-up on a clinical 3T MRI site in conjunction with a commercial double-tuned 1H/23Na birdcage resonator avoiding a time-consuming exchange of resonators or MRI systems. Multinuclear 23Na/1H MRI data sets were obtained from one stroke patient during both the acute and non-acute stroke phases with an aquisition time of 22 min. The lesion exhibiting low ADC was found to be larger compared to the lesion with high 23Na at 9 h after symptom onset. It is hoped that the presented pilot data demonstrate that fast multinuclear 23Na/1H MRI preclinical and clinical protocols can enable a better understanding of how temporal and regional MRI parameter changes link to pathophysiological variations in ischemic stroke tissue.
Export citation and abstract BibTeX RIS
General scientific summary Sodium MRI is a non-invasive imaging technique which allows for localising viable and non-viable brain tissue after arterial occlusion. However, so far it has been challenging to acquire both the hydrogen and the sodium MRI data in less than 30 min using double-tuned resonators in stroke patients. For the first time, a multinuclear imaging protocol was set-up on for clinical 3T MRI in conjunction with a commercial double-tuned sodium/hydrogen birdcage resonator avoiding a time consuming exchange of resonators or MRI systems. Multinuclear data sets were obtained from one stroke patient before and after arterial reperfusion in less than 22 min with excellent spatial resolution. Preclinical multinuclear data sets were also acquired with a newly-developed dual resonator system during and after transient middle cerebral artery occlusion. Multinuclear preclinical and clinical MRI protocols will help to better understand how temporal and regional MRI parameter changes link to pathophysiological variations in ischemic stroke tissue.
1. Introduction
Ischemic stroke is a catastrophic event in which the blood supply to a part of the brain is restricted and oxygen and glucose supply to cells within the affected region is severely limited. The loss of nutrient supply to cells in turn compromises energy metabolism within the stroke-affected area leading to a rapid loss in adenosine triphosphate (ATP) levels and a diminished efficiency in the 23Na/39K-pump function. This efficiency loss also disturbs the ionic homeostasis. The consequent changes in local ion concentrations may therefore allow for the use of magnetic resonance imaging (MRI) to investigate such states noninvasively. In particular, sodium-23 MRI (23Na-MRI) shows promise for investigating and assessing ischemia related tissue changes over time in stroke (Thulborn et al 2005, 1999, Tsang et al 2011).
The accurate determination of hypoperfused, but potentially salvageable penumbral tissue is critical in identifying stroke patients who will benefit from thrombolysis and in designing future clinical trials of potential neuroprotectants. Indeed, it has been shown that thrombolytic treatment outcomes are improved in patients selected based on an MRI diagnosis (Schellinger et al 2007). The so-called perfusion diffusion mismatch is the MRI technique, which is currently available for identifying patients likely to benefit from thrombolytic treatment, where the mismatch between the ischemically injured tissue and hypoperfused tissue is determined from diffusion and perfusion-weighted 1H-MRI, respectively (McCabe et al 2009a). This technique endeavors to identify hypoperfused penumbral tissue, which is still viable, but at risk of infarction due to compromised energy supply. However, this indirect approach to penumbral tissue identification leads to a lack of precision in the separation of still-viable from irreversibly damaged ischemic core, or from tissue not at risk of infarction (benign oligemia). Indeed, large deviations have been observed between areas with a decreased apparent diffusion coefficient (ADC) compared to infarct determined by the gold standard technique of histology after stroke (Lin et al 2001). Furthermore, ADC values have also been observed to normalize in areas of permanently damaged tissue during the subacute stroke phase (Knight et al 1991, Miyasaka et al 2000). In recent years, it has become clear that the diffusion lesion incorporates viable tissue during the acute phase, casting doubt on the validity of the perfusion–diffusion mismatch approach. Since the conventional MRI techniques demonstrate such ambiguities, and 23Na-MRI may clarify these, combined 1H- and 23Na-MRI of acute and non-acute stroke patients is desirable.
In 1993, increasing 23Na signal was first confirmed in patients suffering from cerebral ischemia during the chronic stroke phase via 23Na-MRI (Shimizu et al 1993). The lack of 23Na signal changes during the early phase was attributed to long TE used and the subsequent insensitivity to the intracellular 23Na MR signal. Recently, the 23Na signal in stroke patients was thoroughly investigated at 4.7 T with single-resonant coil and ultrashort TE below 0.5 ms enabling the detection of short T2*- 23Na component. Therefore the intracellular 23Na-MR signal in stroke tissue was collected. It was found that the 23Na signal in patients can indeed remain constant for up to 11 h after stroke in hypoperfused tissue (Hussain et al 2009). More recently, tissue sodium concentration (TSC) changes were quantified in the penumbra and core during the early hours of stroke and a delay before TSC increases was confirmed in penumbral tissue in an animal model (N = 5) of ischemic stroke (Wetterling et al 2012a). Thus, the hypothesis of an immediate TSC increase in still-viable stroke tissue (Thulborn et al 2005) is most likely inappropriate in both in vivo stroke models and stroke patients, consequently needing revision.
The model linking pathophysiological tissue changes after stroke to changes in measurable 23Na-spin-density MR imaging signals is described below by the equation outlining the voxel based compartment model as extended from the model suggested by Thulborn et al (1999). Considering the vascular compartment volume, (Vv), the extracellular compartment volume, (Ve), and the intracellular compartment volume, (Vi), with the vascular 23Na concentration, (Nav), the extracellular 23Na concentration, (Nae), and intracellular 23Na concentration, (Nai), the TSC, in a given voxel is calculated as follows:

Nai is normally assumed to be approximately 10 mM. Furthermore, Nae in brain tissue is identical to Nav—both being buffered at 140 mM from the space of the entire body with minimal perfusion and the high permeability of 23Na ions through the vessel walls. TSC has been measured in brain tissue via MRI methods and ranged from 28 to 47 mM in humans (Thulborn et al 2005), and 45 mM in rats(Christensen et al 1996). TSC in rodent brain tissue has also been determined to be 49 mM using an invasive radionuclide method (Christensen et al 1996). To arrive at an assumed brain TSC of 42.5 mM, the intracellular volume has to be approximately 75% considering the given concentration values and the TSC equation.
Patient studies bare some challenges due to varying lesion sizes and locations between stroke patients. Thus, a large patient group (100 to 200) is required to shed light on the true progression of the TSC and its correlation with standard clinical 1H—MR parameters. Such clinical trials in acute stroke patients, in turn, require fast scanning methods. Currently applied 23Na—MRI protocols, however, suffer from excessively long scan times. To date, the need to exchange coils (Thulborn et al 1999) or even MRI systems (Tsang et al 2011) exacerbates the scanning of larger numbers of acute stroke patients in hospitals.
The aim of this project was to design multinuclear 1H/23Na protocols for preclinical and clinical stroke MRI. A novel coil concept was developed for preclinical imaging which enabled the use of standard 1H protocols for multinuclear preclinical MRI at 9.4 T. For clinical 23Na/1H-MRI, a double-tuned head resonator was used which required severe modification of standard 1H-MRI protocols in order to overcome the lack of 1H parallel imaging capability.
2. Methods
2.1. Pre-clinical 1H-receive-only/23Na transceiver surface resonator at 9.4T
The foremost design criteria for the double-tuned 23Na/1H preclinical resonator system were to firstly, generate an optimally homogeneous 1H B1-field with a volume resonator; secondly, achieve sufficiently high 1H receive-sensitivity with a receive—only surface coil; and thirdly, to maximize the 23Na signal sensitivity via a transceiver surface coil element. High 1H flip angle homogeneity was essential for the 1H-MRI protocols in order to enable perfusion measurements via arterial spin labeling (ASL) as well as T2 relaxation time measurements via spin echo sequence.
A commercially available 1H birdcage volume resonator (birdcage 72 mm inner diameter, 110 mm length, Bruker BioSpin GmbH, Ettlingen, Germany) was used for transmit-only purposes at 9.4 T which generated a linearly polarized B1-field at 400 MHz and could be actively decoupled during receive-only mode.
The circuit diagram for the newly developed 1H/23Na surface resonator is presented in figure 1(a). This surface coil was home-built and was composed of a 23Na-tuned surface coil (35 mm length, 25 mm width and 1.5 mm thick silver wire) nested in a larger 1H tuned surface coil (45 mm length, 60 mm width, 1.5 mm thick silver wire). The rectangular loops were wrapped around a cylinder, 42 mm diameter to better fit the anatomy of the rat head in order to increase the depth of the detection sensitivity in the sample. Fixed capacitors were used in the coil's circuit for coarse tuning purposes (C1H,1 and C23Na,1 in figure 1(a): 3.3 and 33 pF, CHB series, TEMEX, France). The resonator was variably tuneable via two trimmer capacitors (C1H,2 and C23Na,2 in figure 1(a): 0.5 to 6 pF, NMQM6GE, Voltronics, USA). Non-magnetic coaxial cable with matching BNC connectors (RG316 and 11BNC50-2-13-133NE, respectively, Huber and Suhner, Switzerland) was used to transmit the RF signal from the receiver coil to the preamplifier of the Bruker MRI system.
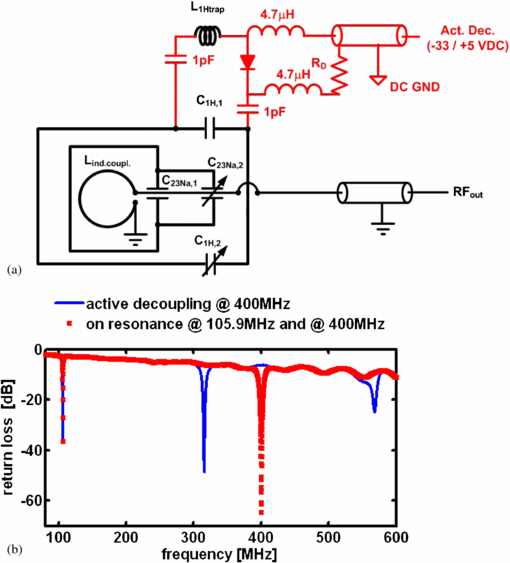
Figure 1. (a) Circuit diagram of the newly developed surface resonator with receive-only 1H and transceiver 23Na capability and (b) return loss as a function of frequency as acquired for the same 1H (400 MHz)/23Na (105.9 MHz) resonator with (blue line) and without active decoupling at 400 MHz (red dotted line). The active decoupling caused a peak split at 400 MHz resulting in one peak at 310 MHz and another at 570 MHz.
Download figure:
Standard imageThe design entailed a 1H surface coil presenting a low impedance to the 23Na coil through the use of low value tuning capacitors (3.3 pF, 455 Ω @105.9 MHz) so that the 23Na sensitivity did not decrease through unwanted coupling effects between both coils. At the same time, the 23Na coil coupled with the 1H resonator at the 1H frequency and therefore had to be considered as a part of the entire coil circuit for tuning the structure to 400 MHz. Inductive coupling (20 mm inner diameter loop) was used instead of capacitive matching to couple into the 23Na coil at 105.9 MHz and into the 23Na/1H structure at 400 MHz. A mechanism translating a rotation of a matching rod into a translation of the coupling coil was used to move the inductive coupling coil relative to the surface coil when placed inside the scanner. The 23Na channel could thus be perfectly matched which also achieved excellent matching at the 1H channel at the same time (see return loss in figure 1(b)). Such a design rendered it unnecessary to incorporate a trap circuit into the surface coil which would ultimately degrade the 23Na sensitivity.
To enable the use of the 1H receive-only surface coil in conjunction with the birdcage resonator, the surface coil was actively decoupled during the transmit phase. Although it is possible to geometrically decouple both coils, for example by arranging the orientation of the plane of the surface coil parallel to the B1-field of the birdcage, the accurate geometric decoupling of identically tuned resonators is difficult to set up in practice without the use of a network analyzer alongside the MRI system, and thus it is impractical for in vivo experimentation to rely exclusively on this approach. Consequently, in addition to the use of geometric decoupling by aligning the coils by eye in the MRI system, the active decoupling was incorporated into the design of the 1H surface coil. In this way, an active decoupling signal from the MRI scanner was used to switch the coils resonance on or off at the appropriate time during the imaging pulse sequence. This was achieved by incorporating a PIN-diode switched trap circuit into the resonance structure, designed such that the coil was on resonance as long as the PIN-diode was reverse-biased. The coil had to be switched off-resonance by applying a suitable dc voltage (+5/−35 V), which was supplied by the MRI system. The dc potential was separated from RF ground through the use of high value capacitors (1 nF, CHB, TEMEX, France), while the RF potential was separated from dc ground using RF chokes (4.7 µH, IM4, Vishay, France).
The unloaded-to-loaded quality-factor-ratio (Q0/Ql) was determined via reflection coefficient measurement (s11) using a vector network analyzer (ZVL3, Rhode & Schwarz, Munich, Germany). The return loss measured at the coaxial connector of the coil is shown in figure 1(b). Excellent 1H active decoupling was achieved with the introduced coil design as indicated by a broad peak split at 400 MHz resulting in one peak at 310 MHz and another at 570 MHz. No change in the 23Na frequency was noted during 1H active decoupling indicating strong independence of the 23Na from the 1H surface detector loop.
2.2. Clinical double-tuned 1H/23Na transceiver head resonator at 3 T
Standard clinical 1H—MRI stroke protocols are generally set-up to acquire data with phased array detectors which enable parallel imaging-based undersampling schemes for single echo train imaging. In order to achieve double tuning and reasonable B1—field homogeneity in the 23Na channel, the double-tuned birdcage structure is a reasonable choice to record both the 1H and the 23Na signal components. This removes the availability of undersampling schemes for 1H echo planar imaging (EPI) techniques, subsequently causing artifacts in the 1H images when acquired with the standard protocol settings. While the birdcage resonator is most likely the best trade—off between double-resonance transmit homogeneity and receive sensitivity, the adjustment of standard 1H—MR imaging sequences is challenging. Hence, the feasibility of the combined 23Na— and 1H—MRI stroke protocol during the acute stroke phase in less than 25 min has never been demonstrated.
A double-tuned birdcage resonator (Rapid Biomedical GmbH, Rimpar, Germany) with an inner diameter of 265 mm and 280 mm in length was used for combined 23Na- and 1H—MRI of one stroke patient. The resonator was driven in quadrature mode. Hence, a circularly polarized B1-field was generated at both the 23Na (32.6 MHz) and the 1H frequencies (128 MHz) reducing necessary transmit power and increasing receive sensitivity by up to 40% compared to a linearly polarized resonator of identical dimensions. At the 23Na frequency, a transmit voltage of 185V into 50 Ω was required in order to achieve 90° flip angle with 1ms long hard pulse. A high B1-field homogeneity below 5% was observed in the 23Na channel across a spherical region covering 50% of the inner coil volume.
2.3. Transient middle cerebral artery occlusion (tMCAO)
All animal procedures were carried out strictly within national laws and guidelines and were approved by the Animal Ethical Committee for Laboratory Animal Experiments at the Regional Council in Karlsruhe, Germany (35–9185.81/G-176/10). One male Wistar rat weighing 300 g was housed under controlled temperature and humidity conditions with free access to water and food. MCAO was induced by an intraluminal filament occlusion technique, previously described elsewhere (Longa et al 1989, Memezawa et al 1992). Briefly, anesthesia was induced using 4.5% isoflurane in N2O:O2 (70%:30%). The rat was kept anesthetized by inhalation of 1.5% isoflurane in N2O:O2 (70%:30%) through a mask. A rectal temperature probe connected to a homeothermic blanket was inserted for the maintenance of a body temperature of 37 °C during the operational procedure. Thereafter, an incision was made in the midline of the neck and the right common, external and internal carotid arteries were exposed. The common and external carotid arteries were permanently ligated by sutures. A filament of 0.37 mm was inserted into the internal carotid artery via an incision in the common carotid artery. The filament was then further advanced until the rounded tip reached the entrance of the right middle cerebral artery. After fixing the filament all wounds were closed and the rat was placed into the magnet bore. The occlusion time for the MCAO was 90 min, after which the filament was carefully withdrawn and the rat was placed into the MRI scanner again.
2.4. Pre-clinical multinuclear 23Na/1H MR imaging protocols at 9.4 T
During the imaging procedure, the breathing rate and body temperature were monitored online. A 9.4 T preclinical MRI system (Biospec 94/20, Bruker, Germany) equipped with 740 mT m−1 gradients was used. The center frequency, global B0-shim within the field of view (FOV) of the 1H receive-only surface resonator and rf-reference pulse voltage were determined automatically at the 1H frequency prior to acquiring three 1H localizers in coronal, axial and sagittal views for 1H slice positioning. MRI scanning was started with 1H angiography, followed by 1H diffusion-weighted, 1H spin-echo imaging with various TEs and an arterial spin labeling experiment in order to obtain perfusion-weighted 1H MR images. Prior to 23Na imaging, B0 was shimmed manually within the imaging field of view before the center frequency was adjusted and 23Na MR imaging data were acquired.
The 1H localizer was acquired with the following 2D-gradient echo sequence parameters: 1 slice, slice thickness (ST) = 2 mm, FOV = (80 × 80) mm2, nominal in-plane resolution = (0.625 × 0.625) mm2, TR/TE = 100/6 ms, flip angle (FA) = 30°, bandwidth (BW) = 50 kHz/FOV and acquisition time (TA) = 13 s.
1H diffusion-weighted imaging was set-up with 2D EPI with three diffusion directions, two different b-values (530 and 1079 s mm−2) and five unweighted b = 0 s mm−2 acquisitions, 10 slices, ST = 1.8 mm, inter slice distance = 2 mm, FOV = (25 × 30) mm2, nominal in-plane resolution = (0.31 × 0.31) mm2, TR/TE = 4000 ms/21.3 ms, BW = 357 kHz/FOV and TA = 88 s.
3D FLASH was used for 23Na MRI with high spatial and temporal resolution. The following sequence parameters were used for all data sets: FOV = (64 × 64 × 128) mm3, nominal voxel resolution after two-fold 3D zero-filling = (0.5 × 0.5 × 2) mm3, TR/TE = 21/2.9 ms, 10% partial echo acquisition, BW = 4 kHz/FoV, rf pulse (gauss) length = 0.1 ms, the Ernst angle was adjusted to be within the striatum region of the brain, and TA = 4 min 57 s TA. The T2* decay in mouse brain tissue was well described by a single-exponential transversal relaxation time of 5 to 9 ms at 9.4 T using a 3D CSI technique. 580 data points were sampled with 100 µs dwell time and the first data point was acquired as soon as 365 µs after excitation (Heiler et al 2011). Therefore, a TE of 2.9 ms was deemed short enough in this study to measure the qualitative change of the sodium MRI signal after the ischemic stroke.
1H T2 maps were reconstructed from multi slice multi echo (MSME) sequence data acquired as follows: 3 axial slices, ST = 2 mm, inter-slice distance = 4 mm, FOV = (64 × 64) mm2, nominal in-plane resolution = (0.5 × 0.5) mm2, TR = 2888 ms, TE = 11 to 176 ms in 16 increments, BW = 60 kHz/FOV and TA = 4 min 37 s.
3D 1H time-of-flight (ToF) sequence was used to record angiographic images of the cerebral artery system with following parameters: FOV = (40 × 40 × 40) mm3, nominal voxel size = (0.16 × 0.16 × 0.31) mm3, TR/TE = 15/2.5 ms, BW = 100 kHz/FoV, FA = 20° and TA = 6 min 8 s.
1H perfusion-weighted imaging was achieved through FAIR imaging scheme with a spin-echo RARE sequence. The acquisition parameters were chosen as follows: ST = 2 mm, inversion slab thickness = 5 mm, FOV = (11.52 × 11.52) cm2, nominal in plane resolution = (0.9 × 0.9) mm2, TR/TE = 18000/56 ms, recovery time = 10 s, RARE factor = 72, inversion time (IR) = 2000 ms, and BW = 75 kHz/FOV and TA = 1 min 39 s.
2.5. Clinical multinuclear 23Na/1H MR imaging protocols at 3T
The clinical MRI investigation protocol was approved by the local institutional review board (IRB). Written informed consent was also obtained from the patient after the nature of the procedure had been fully explained to him individually. A 72-year-old male patient with right MCA occlusion who underwent thrombolytic therapy during the clinically allowed 3 h time window post symptom onset was scanned at 9 and 100 h after stroke. The absence of general MRI contraindications as well as the absence of relevant diseases was ensured before including the patient for the study. The 1H images were assessed by a trained and qualified neuroradiologist. The patient was continuously monitored by a qualified neurologist.
The MRI examinations were conducted on a 3.0 T clinical whole-body MR scanner (Magnetom TimTrio, Siemens Healthcare Sector, Erlangen, Germany). The center frequency, B0-shim and rf-reference pulse voltage were determined automatically at the 1H frequency prior to acquiring three 1H localizers in coronal, axial and sagittal views for 1H slice positioning. MRI scanning was started with 1H angiography, followed by 1H diffusion-weighted and 1H T2-weighted imaging. Perfusion-weighted images were recorded after intravenous injection of a contrast agent which enhanced the dynamic susceptibility contrast (DSC). In order to avoid possible effects on the 23Na signal the perfusion imaging data was recorded at the end of the human stroke protocol. Prior to 23Na imaging, the B0-field was shimmed globally on the 1H channel before the center frequency was adjusted and radial 23Na k-space data were acquired.
The 1H localizer was acquired with the following 2D-gradient echo sequence parameters: three slices, ST = 7 mm, FOV = (250 × 250) mm2, TR/TE = 8.6/4 ms, FA = 20°, BW = 81 kHz/FOV and TA = 13 s.
1H diffusion-weighted imaging was set-up with 2D EPI with three diffusion directions with monopolar diffusion weighting and two different b-values (0 and 1300 s mm−2), 24 slices, ST = 5 mm, inter slice distance = 5.5 mm, FOV = (230 × 230) mm2, nominal voxel size = (1.8 × 1.8 × 5) mm−3, TR/TE = 4000/75 ms, 263 kHz/FOV and TA = 1 min 40 s.
Density adapted 3D radial projection (DA-3DRP) technique (Nagel et al 2009), a further development of the 3D radial projection technique (Nielles-Vallespin et al 2007), was used for 23Na MRI with a high spatial and temporal resolution. Using this technique, a TE of 200 µs was achieved with 340 µs pulse length, which helped to minimize T2*-weighting effects on the measured signal intensity. T1-weighting effects were also minimized by a relatively long TR of 100 ms, considering the T1 for 23Na in in vivo tissue to be in the region of 20 ms (17, 18). The following sequence parameters were used for all data sets: TR/TE = 100/0.2 ms, FA = 90°, FOV = (320 × 320) mm2, nominal isotropic voxel resolution = (4 × 4 × 4) mm−3, BW = 15 kHz/FOV and TA = 10 min. The 3D radial data sets were reconstructed using a nearest-neighbor regridding algorithm implemented in Matlab® (The Mathworks, Natick, MA) using code developed in-house. The regridded data were filtered by a Hanning window before inverse Fourier transformation.
2D 1H inversion recovery spin echo sequence (T2-TIRM) was used to acquire T2-weighted images with fluid signal suppression. The following parameters were selected: 24 slices, ST = 5 mm, FOV = (230 × 230) mm2, nominal voxel resolution = (1.2 × 0.9 × 5) mm−3, TR/TI/TE = 9000/2500/93 ms, BW = 73 kHz/FOV and TA = 4 min 14 s.
3D 1H ToF sequence was used to record angiographic images of the cerebral artery system with: 4 slabs, 24 slices per slab, FOV = (200 × 200) mm2, nominal voxel resolution = (0.8 × 0.6 × 0.7) mm−3, TR/TE = 20/4 ms, FA = 17°, BW = 41 kHz/FOV and TA = 3 min 58 s.
1H perfusion-weighted images (PWI) were recorded with a fast EPI sequence for 10 s before and for up to 60 s after intravenous contrast agent injection. The acquisition parameters were chosen as follows: 19 slices, ST = 5 mm, FOV = (230 × 230) mm2, nominal voxel size = (4 × 4) mm2, TR/TE = 1370/32 ms and TA = 1 min 14 s. Dynamic susceptibility weighted contrast (DSC) allowed for computing time-to-peak (TTP) and relative cerebral blood flow (rCBF) maps from the raw images, which were co—registered (2D rotation and translation) prior to map calculation in order to remove motion artifacts between consecutive images.
2.6. ROI selection and data analysis
Pre-clinical rat brain images were co-registered with the corresponding 1H angiographic image acquired during MCAO using the control point selection tool and 2D affine image transformation in Matlab® (The Mathworks, Natick, MA). The images and maps were resized to the angiographic image size with (0.16 × 0.16) mm2 pixel size. A mask of the brain was marked manually on the angiographic image and transcribed to each of the images and maps. Similar procedure was applied to the clinical data. The reference image was chosen to be the T2-weighted image acquired at 9 h after symptom onset. All other images and maps were co-registered to the T2—weighted image and masked. The ROI with ADC values below 0.55 µm2 ms−1 was manually marked on the ADC maps and transcribed on each of the presented images. Square ROIs were selected in ipsilateral and contralateral tissue in ADC maps, and transcribed to the co-registered 23Na images and T2 images and maps. Core tissue was defined as underperfused (perfusion<58%contralateral (preclinical) or ΔTTP>2 s (clinical)) with a low ADC (<0.55 µm2 ms−1) during transient cerebral ischemia in the rodent stroke model and clinically during the acute stroke phase. Except for the ADC, TTP and T2 values, a ratio of contralateral to ipsilateral image intensities was computed. All ROIs were drawn carefully with reference to anatomic images. Data are expressed as mean ± standard error of the mean (s.e.m.).
3. Results
Angiographic images before and after arterial reperfusion in one rat are shown in figure 2. The lack and also the restoration of arterial perfusion in the left MCA (right side in the images) is notable. The multinuclear 23Na/1H MRI data set for the same rat is presented in figure 3. The quantitative results for the tMCAO experiment are summarized in table 1.
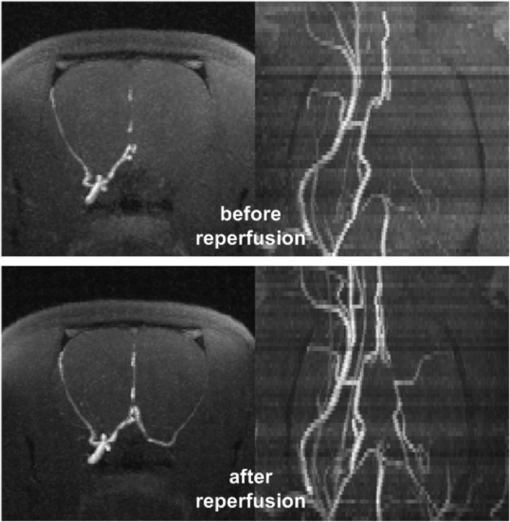
Figure 2. Axial (first row) and coronal (second row) maximum intensity maps of arterial blood flow weighted 1H MR images during (first row) and after transient 90 min middle cerebral artery occlusion (second row). Excellent arterial reperfusion was established directly after filament removal.
Download figure:
Standard image
Figure 3. 1H-perfusion-weighted images (first column), 1H ADC maps (second column), 1H T2 maps (third row) and 23Na images (fourth column) at different times after stroke: (I) during 90 min transient middle cerebral artery occlusion (first row), (II) at 1 h after arterial reperfusion (second row) and (III) at 24 h after arterial reperfusion (third row). The region of a low ADC during MCAO is marked by a red line in the 1H maps and by a white line in the 23Na images. Note a high 23Na signal at 24 h after reperfusion in regions which exhibited neither an ADC decrease nor a T2 increase, yet which were hypoperfused for 90 min. Given time stamps relate to the time after stroke onset.
Download figure:
Standard imageTable 1. Quantitative results for single tMCAO experiment in one rat. Core and penumbra were defined by low perfusion and low/normal diffusion values during the first scan. All values are given as mean and standard error of the mean in the same ROI for either core or penumbra.
| 1H PWI (%contr.) | 1H ADC (µm2 ms−1) | 1H T2 (ms) | 23Na (%contr.) | ||
|---|---|---|---|---|---|
| Presumed core region | Before reperfusion | 29 ± 8 | 0.54 ± 0.06 | 43 ± 5 | 97 ± 10 |
| with perfusion <58% contr. | |||||
| and ADC <0.55 µm2 s−1 | |||||
| @10 min before reperfusion | |||||
| 2 h after | |||||
| reperfusion | 68 ± 8 | 0.90 ± 0.05 | 45 ± 3 | 122 ± 7 | |
| 24 h after | |||||
| reperfusion | 72 ± 8 | 0.97 ± 0.05 | 75 ± 14 | 160 ± 5 | |
| Presumed penumbra region | Before reperfusion | 42 ± 8 | 0.92 ± 0.03 | 43 ± 5 | 101 ± 10 |
| with perfusion <58%contr. | |||||
| and ADC >0.55 µm2 s−1 | |||||
| @10 min before reperfusion | |||||
| 2 h after | |||||
| reperfusion | 64 ± 8 | 1.1 ± 0.03 | 45 ± 3 | 104 ± 9 | |
| 24 h after | |||||
| reperfusion | 74 ± 8 | 1.05 ± 0.04 | 42 ± 7 | 124 ± 5 |
Hypoperfusion in nearly half of the axial brain hemisphere was confirmed by perfusion-weighted 1H-MR imaging. The region with ADCs below 0.55 µm2 ms−1 was much smaller compared to the hyperperfused region resulting in a large penumbra as defined by the diffusion/perfusion mismatch. Changes in T2 and 23Na were measured neither in the presumed core nor in the penumbra regions during tMCAO.
The lesion with a low ADC seemed to shrink directly after arterial reperfusion (see figure 3). Perfusion remained slightly below contralateral levels, yet a clear improvement of arterial reperfusion was noted immediately after filament removal in the PWI. 22% change in the 23Na signal was measured in the core within 2 h after arterial reperfusion, although no change in T2 was measured in the same ROI.
At 24 h after reperfusion, the lesion ADC (presumed core) recovered from 0.54 ± 0.06 µm2 ms−1 before reperfusion to 0.90 ± 0.05 µm2 ms−1 after reperfusion. After reperfusion, T2 increased from 45 ± 3 to 75 ± 14 ms and the 23Na signal increased from 122 ± 7% to 160 ± 5% in the presumed core. Moreover, high 124 ± 5% 23Na was measured in the presumed penumbra, while the ADC and T2 remained at normal levels in the same ROI.
Figure 4 shows angiographic images before and after arterial reperfusion in one stroke patient. The multinuclear 23Na/1H MRI data set for the same patient is presented in figure 5. The quantitative results for the investigated stroke patient are summarized in table 2.
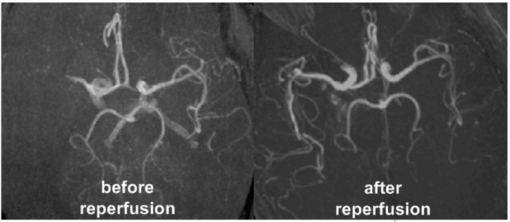
Figure 4. Axial maximum intensity maps of arterial blood flow weighted 1H MR images before (left) and after arterial reperfusion (right) as acquired for one stroke patient. Excellent image resolution was achieved with double-tuned 23Na/1H head resonator at 3T.
Download figure:
Standard image
Figure 5. 1H time-to-peak (TTP) maps as a result of the contrast agent perfusion measurement (first column), 1H-DWI (second column), 1H-ADC maps (third column), 1H T2-weighted MR images (fourth column) and 23Na MR images (fifth column) for one representative patient during acute (upper row, 9 h after symptom onset) and the non-acute phases (lower row, 100 h after symptom onset). The lesion with a high 23Na signal is smaller compared to the lesion with ADC below 0.55 µm2 ms−1 (red and white edges in images) during the acute stroke phase—some of the tissue with 1H DWI variations may have still been viable at that early time point. The TTP map showed normal values during the second scan series confirming that arterial reperfusion was successfully achieved.
Download figure:
Standard imageTable 2. Quantitative results for single stroke patient. Core and penumbra were defined by low perfusion and low/normal diffusion values during the first scan. All values are given as mean and standard error of the mean in the same ROI for either core or penumbra.
| 1H ΔTTP (s) | 1H ADC (µm2 ms−1) | 1H T2-weighted signal (%contr.) | 23Na (%contr.) | ||
|---|---|---|---|---|---|
| Presumed core region with | Acute phase | 15 ± 4 | 0.37 ± 0.05 | 123 ± 26 | 130 ± 10 |
| low perfusion (ΔTTP >3 s) | |||||
| and ADC > 0.55 µm2 s−1 | |||||
| before reperfusion | |||||
| Non-acute phase | 2 ± 3 | 0.76 ± 0.05 | 143 ± 20 | 215 ± 7 | |
| Presumed penumbra region | Acute phase | 4 ± 1 | 0.69 ± 0.1 | 91 ± 13 | 103 ± 8 |
| with low perfusion | |||||
| (ΔTTP > 3 s) and | |||||
| ADC < 0.55µm2 s−1 | |||||
| before reperfusion | |||||
| Non-acute phase | 1 ± 3 | 0.64 ± 0.07 | 135 ± 15 | 188 ± 12 | |
Hypoperfusion in nearly half of the axial brain hemisphere was confirmed by perfusion-weighted 1H-MR imaging and subsequent late TTP within the hypoperfused tissue at 9 h after symptom onset. The region with ADCs below 0.55 µm2 ms−1 was slightly smaller compared to the hypperfused region. Slightly increased 1H T2-weighted signal and the 23Na signal were measured in the presumed core tissue during the acute phase. More interestingly, the lesion with high 23Na was smaller compared to the lesion exhibiting a low ADC at 9 h after symptom onset.
During the chronic phase at 100 h after symptom onset, the TTP and ADC recovered to normal values in most parts of the previously hypoperfused tissue. The regions with hyperintense 23Na and 1H T2—weighted signal matched the region with the hypointense diffusion signal well. However, some of the reperfused tissue in the lower cortex regions seemed to have recovered from the stroke assult. Neither qualitative changes in 23Na nor T2-weighted signal were detected in the region with previously low ADC (second smaller ROI in the images) during the chronic phase. Arterial perfusion was restored as confirmed by angiographic imaging and TTP maps corresponding to this late measurement time point.
4. Discussion
If 23Na-MRI is to realize its potential use for clinical diagnostic imaging, fast multinuclear MRI protocols are required which allow the aquisition of both the 1H and the 23Na data with sufficient spatial and temporal resolution. Furthermore, thorough preclinical and clinical multinuclear studies are necessary to understand how the 23Na MR signal changes link to pathophysiological variations in stroke tissue.
A double-tuned 23Na/1H surface resonator system was developed and successfully applied for studying 23Na and 1H MRI parameter changes during and after tMCAO at 9.4 T. Furthermore, 23Na MRI has been integrated into a standard stroke 3 T clinical protocol and standard 1H—MRI sequences were adapted to the challenges linked to using a double-tuned 23Na/1H—birdcage resonator. The protocol stability and reproducibility was demonstrated successful by scanning angiographic images, as well as T2-weighted images, diffusion- and perfusion-weighted images in conjunction with 23Na images at two different time points after stroke, once during the acute and later during the non-acute stroke phase with 22 min acquisition time.
Nested 23Na/1H surface coils have been previously described as a transceiver solution with two separate capacitively matched coaxial cable connections (Alecci et al 2006). Only a single coaxial cable and inductive coupling were used for the herein presented surface coil arrangement. Incorporating the 23Na surface coil as part of the 1H resonator rendered it unnecessary to add a 1H trap circuit to the 23Na loop. In addition to the inductive coupling principle, a single capacitor was sufficient to tune the 23Na loop on resonance avoiding multiple lumped elements in that circuit. The high impedance of the 1H loop exposed to the 23Na loop reduced unwanted coupling losses at 105.9 MHz as described before (Augath et al 2009). On the other hand, the 1H surface coil achieved an excellent receive-sensitivity across the rat brain (15 mm diameter) due to its smaller geometry compared to the 72 mm diameter volume resonator. The volume resonator, in turn, guaranteed excellent flip angle homogeneity during a transmit-only operation. Both the 1H and the 23Na surface coil were anatomically shaped so that the B1-profile exhibited a drop of less than 50% across the brain. Some limitations arise from using described transceiver resonator for TSC quantification which ultimately requires an exact B1-field correction. However, if the relative sodium values are of interest, as was the case in this study, contralateral B1-field can be assumed to be nearly similar for the symmetrical coil profile achieved with used surface resonator.
For clinical multinuclear MRI, the transceiver birdcage resonator presented the best trade-off between B1-field homogeneity and receiver sensitivity for human head applications with a single coil. The receive capability could potentially be increased through the use of surface receiver elements (Wetterling et al 2012b) placed close to the head surface. By comparison to the head dimensions (∼15 cm diameter sphere), the birdcage resonator dimensions are trading some signal sensitivity for an improved B1-field homogeneity due to the large cylindrical structure with 28 cm length and 26.5 cm diameter used. A more sophisticated resonator set-up could, for instance, be composed of a separate large transmit-only 23Na resonator with in-built 1H decoupling, while a six-element receiver with relatively large single element side length of ∼ 10 cm could be mounted in close proximity to the head in order to increase the 23Na receive sensitivity. Similar multi-element resonator (∼ 32 smaller elements which proved appropriate for 1H brain imaging due to the excellent 1H signal sensitivity) can enable parallel imaging in conjunction with the scanner's whole-body transmit resonator. The preclinical nested 23Na/1H surface coil arrangement can be seen as an example of such a receiver element design for human MRI. High undersampling factors can ultimately decrease the number of necessary echos to be acquired in one single shot EPI sequence. By these means, artifacts will be further reduced (Barberi et al 2000). On the sequence site, the 23Na acquisition time can further be reduced with 2D density adapted radial projection techniques (Konstandin et al 2011) and potentially through a novel undersampling scheme using a priori information from the 1H-channel (Weingaertner et al 2011).
For the first time, the 23Na-MRI signal was investigated during and after transient cerebral ischemia in a rodent stroke model. Although transient ischemia has been previously investigated in core tissue of monkeys during the acute phase (LaVerde et al 2009), the high spatial resolution achieved in the herein presented experiments allow us to analyze substructures within the stroke lesion such as presumed core and penumbra. Furthermore, covering time points up to one day after MCAO enabled a better observation of the temporal dynamics after reperfusion. As opposed to other 23Na-MRI studies which reported that 23Na can increase in still viable stroke tissue before reperfusion (Boada et al 2012), we noted that 23Na remained at normal levels during 90 min tMCAO. Increasing 23Na MRI signal was detected in penumbra and core after arterial reperfusion. Sodium signal may indeed remain at normal levels in still viable tissue. However, since results are only reported for one rat, further experimentation including a larger number of strokes is necessary to improve the level of significance.
Earlier studies reported that a 23Na-MRI signal increases by 20%/h in immediately damaged stroke tissue in rats (Jones et al 2006, Wetterling et al 2012a). The lack of measured 23Na MRI signal change within the ADC lesion during the first 90 min after artery occlusion suggests that the tissue may have still been alive at that time point. Such delay before 23Na increase has previously been related to longer tissue viability (Wetterling et al 2012a). Although parts of the finally damaged tissue showed low ADC early on, it remains unclear whether a low ADC occurs long before tissue viability loss or, indeed, at the incidence of permanent tissue damage. A premature decrease in the ADC may also explain the discrepancy in 23Na and the ADC lesion during the acute phase in the investigated patient. An early ADC decrease may hinder some patients from receiving treatment if presenting with no diffusion/perfusion mismatch and hence no presumed penumbra despite the fact that the whole tissue or at least larger fractions of the tissue could have still been salvaged via thrombolytic therapy.
In this work, the sodium signal was measured with T1 and T2* relaxation time weighting in order to increase the SNR efficiency per acquisition time—longer TE and short TR were selected. The qualitative changes with time after stroke (Wetterling et al 2012b) compared to quantitative measurements of the TSC (Wetterling et al 2012a) are very similar to an initial decrease or stagnation at normal levels during the cell swelling phase and a drastic increase in the sodium signal after cell viability loss. Hence, the observed sodium signal, S can be estimated by the following equation:

where Stissue is the sodium concentration weighted signal measured in a given voxel, Se is the sodium concentration weighted signal originating from the extracellular volume-Ve, and Si is the sodium concentration weighted signal originating from the intracellular volume, Vi.
In order to understand the possible lack of sodium signal changes during the acute stroke phase, we herein extended the existing model by also allowing variations in Ve and Vi—a common pathophysiological effect due to cytotoxic edema after ischemia (McCabe et al 2009b). A graphical explanation for how sodium signal change can then be related to different stroke tissue states is given in figure 6. Extra- to intracellular 23Na signal ratios (1.4/0.1) have been chosen to closely match actual sodium concentration ratios (140 mM/10 mM) in brain tissue. Normal Stissue results from high Se = 1.4 in the extracellular compartment and low S = 0.1 in the intracellular volume compartment. Assuming Vi in normal tissue to cover approximately 75% of the given voxel, Stissue is expected to be 0.43 (figure 6(a)).
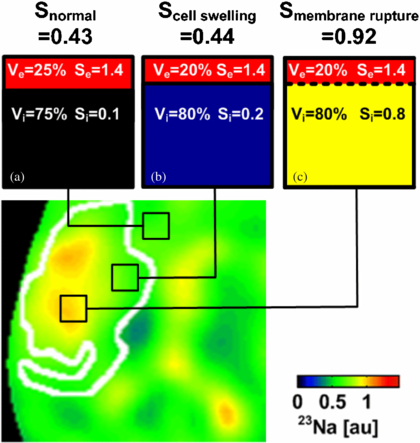
Figure 6. 23Na image (zoomed in to the stroke region on the left hemisphere) taken from figure 5 at 9 h after stroke with a superimposed region of restricted hydrogen diffusion (white line). (a) 23Na signal in brain tissue originates from intra- and extracellular volumes within a given voxel. (b) Voxel located within ADC lesion showing the normal 23Na signal. Please note that a marginal volumetric cell expansion from 75% to 80% compensates for a 100% increase in intracellular 23Na concentration with no effect on the overall 23Na signal. Hence, in this case, the 23Na signal did not increase in cellular edema tissue while the tissue viability could have been restored via arterial reperfusion. (c) A drastic change in the 23Na signal occurs after cell membrane rupture indicating tissue viability loss.
Download figure:
Standard imageInitially, as soon as the cellular membrane function is disrupted, 23Na ions are accumulated inside cells and consequently the intracellular 23Na signal increases. The disturbed 23Na concentration ratio between intra- and extracellular spaces is compensated for by a strong influx of water into the cells and a subsequent swell-up of cells (cytotoxic edema). The intracellular space increases (McCabe et al 2009b), which results in decreased water mobility and a subsequent drop in the 1H ADC. It is worth noting that subsequently a change in an intracellular volume fraction by only 7% from 75% to 80% compensates for an intracellular sodium signal increase of 100% from 0.1 to 0.2 (figure 6(b)). Hence, the 23Na concentration and 23Na concentration weighted signal as measured by 23Na-MRI may remain constant or decrease slightly in still-viable stroke tissue rather than exhibit an increase.
In the case of cell membrane rupture, the membrane barrier between the intra- and extracellular compartments is removed and 23Na ions are allowed to freely diffuse into the considered voxel with assumed ion supply from the neighboring extracellular space and the perfused vascular compartments carrying a high 23Na content (figure 6(c)), of which the 23Na concentration is regulated globally by the kidney function. Up to three-fold increase in TSC has been measured in permanently damaged stroke tissue in mouse (Heiler et al 2011), rat (Wetterling et al 2012a, Jones et al 2006, Wetterling et al 2010, Yushmanov et al 2009) and man (Thulborn et al 2005, Tsang et al 2011, Shimizu et al 1993) before. However, the transition processes between those two states must be considered carefully in order to understand all possible 23Na MR signal changes or the lack thereof in hypoperfused, but still viable penumbra tissue.
The cell swelling model for still viable stroke tissue explains why 23Na was measured at normal levels in brain tissue which showed a clear diffusion restriction during the acute stroke phase in the investigated patient. 1H T2-weighted signal and ADC changes in patient data sets were within the expected ranges (Tsang et al 2011). 23Na changes were larger than the standard deviation of the mean value computed in the core ROI during the acute phase confirming results in human 23Na MRI studies by others (Tsang et al 2011, Hussain et al 2009) who reported on little 23Na changes during the first 11 h after symptom onset and a later strong increase of the 23Na signal during the non-acute stroke phase. Since, short TE of <0.5 ms was used in the patient scan, it is clear that the 23Na concentration weighted signal can remain close to a normal level during acute stroke. Most likely, the delay before TSC increase may depend upon the severity of the underperfusion.
It remains to be clarified why high sodium was measured during the non-acute phase in rat brain tissue which presented neither 1H T2-weighted signal variations nor 1H diffusion deficits. In this case, high 23Na may potentially indicate tissue viability loss due to apoptosis, which is not preceded by cell swelling processes and may therefore show no effect on the measurable 1H MRI signal. The observed restricted physical mobility of the rat may have been an indication that the motor cortex was truly paralyzed or even permanently damaged at 24 h after transient MCAO. Future in vivo studies investigating transient arterial occlusion models may confirm this hypothesis. More patient studies of larger groups are necessary to confirm these hypotheses, since the spectrum of possible ischemia lesions varies largely in location and size.
The PWI measurement in patients was reproducible, yet prone to errors linked to patient movement and manual-injection of the contrast agent, a common problem of the DCE technique. Both problems are unrelated to the resonator system itself. Image quality was excellent and distortion artifacts negligible (see figure 5). Post-processing included co-registration of the images, which improved TTP and rCBF maps drastically compared to the current standard on the Siemens console using Syngo graphical user interface. Observed PWI changes confirmed the measurement technique functioned well and matching results were published elsewhere (Tsang et al 2011, Hussain et al 2009). Although slight distortion artifacts were noted, sufficient image quality was achieved in order to diagnose ischemic stroke tissue by a low ADC during the acute phase.
In conclusion, combined 23Na and 1H MRI is possible in acute stroke patients with a minimally extended imaging time and a total protocol scan time of 22 min. No change of resonator nor MRI system is required. For the first time, this enabled the use of 23Na MRI within the clinical routine. It is hoped that 23Na-MRI of acute stroke with presented protocol will enable us to obtain new insights about the disease progression in patients.
Acknowledgments
The authors would like to acknowledge physics support from Dr rer. nat. Simon Konstandin, Dr rer. nat. Armin Nagel, and Dr rer. nat. Patrick Heiler and Dr rer. nat. Lothar Schad, neurological support from Dr med. Marc Fatar, and neuroradiological support from Dr med. Eva Neumaier—Probst.