

Abstract
Google Earth has made a wealth of aerial imagery available online at no cost to users. We examine some of the potential uses of that data in illustrating basic physics and astronomy, such as finding the local magnetic declination, using landmarks such as the Washington Monument and Luxor Obelisk as gnomons, and showing how airport runways get their numbers. Close inspection of the images provided by Google Earth reveals that most of them are actually obtained via camera-equipped planes rather than satellites.
Export citation and abstract BibTeX RIS
1. Introduction
The Google Earth program (previously discussed in this journal [1–4] and elsewhere [5]) and the related database accessed via web browser, Google Maps, provides high resolution aerial imagery of the Earth, which can be used to investigate multiple physical phenomena of interest. While most of the activities we discuss could be performed locally without aerial imagery, the software and website allow students to explore clear-cut examples of the concepts mentioned without the need to travel or to avoid inclement weather or darkness.
2. Magnetic declination
The difference in angle between magnetic north, as indicated by a compass, and true north, aligned with Earth's axis of rotation, is known as the magnetic declination. The distinction between the two is frequently mentioned in astronomical contexts [6–9]. Determining true north can be done multiple ways: observation of Polaris (requiring a dark, clear sky and a goniometer, theodolite, or some similar device; while Polaris itself is not directly north, it is within 1° of true north), finding the direction of a shadow made by a narrow stick at local noon, or using a global positioning system (GPS) receiver at two different points. The GPS method requires a substantial baseline, as the positional uncertainty of a location provided by a standard GPS unit is typically several metres.
We used a picture from Google Earth shown in figure 1 to determine the precise azimuth of a long sidewalk on our campus. The ruler button, provided in the user interface, shows that the sidewalk is oriented 18° west of true north. To determine magnetic north, we constructed a mirrored 'compass needle' by gluing two small round mirrored disks (approximately 2.5 cm in diameter) to two high-strength neodymium–iron–boron (NdFeB) magnetic disks of similar size. The newly mirrored magnets were then separated and rejoined with a vertical thread running between them. The thread was suspended from the bottom of an aquarium, which was inverted (figure 2). A large cylinder of aluminium was placed behind the magnet to provide eddy current dampening of torsional motions.

Figure 1. Screen capture of Google Earth view of Armstrong State University. The inset box shows the use of the ruler tool to determine the direction of the yellow line shown along the edge of the sidewalk. The image is aligned so that north is at the top. Map data: Google, DigitalGlobe, USGS, USDA Farm Service Agency.
Download figure:
Standard image High-resolution image
Figure 2. The mirrored magnets are suspended from a thread to allow alignment with the local horizontal magnetic field. The aluminium cylinder used for damping is positioned to the immediate left of the magnets. When used with a laser pointer, the magnets form a sensitive optical lever.
Download figure:
Standard image High-resolution imageThe inverted aquarium was placed on the sidewalk and a green laser pointer was positioned 13.5 m away from the aquarium along the sidewalk. The laser beam was directed towards the mirrored magnet and the reflected beam was observed. The laser's position was changed until the reflected and incident beams were as close to collinear as possible. The separation between the mirror and laser in the direction perpendicular to the sidewalk was then 2.1 m, demonstrating that magnetic north was some 8.8° to the east of the sidewalk's line. Our measured magnetic deviation was therefore 9.2° west of true north, though the uncertainties in our measurements suggest single-degree precision at best. According to the online calculator at the National Geophysical Data Center [10], the magnetic declination at our location should be 6.81° west of true north. The existence of any local magnetic anomalies (visible as well as those below ground) could be expected to interfere with the results of this procedure.
3. Using landmarks as gnomons
Large, distinctive landmarks such as the Washington Monument, Luxor Obelisk, Eiffel Tower, or any of a variety of large radio antennas can serve as gnomons (the central part of a sundial that casts the shadow used to tell time) by measurement of the directions and lengths of their shadows. Google Maps, which is a website similar to the previously mentioned Google Earth program, can also be used for this purpose. One important difference is that Google Earth allows the user to view historical images as well as the latest view of an area. Through a control known as the 'time slider', older images can be examined. The date of the image is also provided at the bottom of the main window, where the exact latitude, longitude, elevation, and apparent viewer altitude are shown.
Google Maps uses only the latest imagery, and does not allow for the display of historical images. The image date is also not provided through Google Maps, although the Street View option (not discussed in this paper) does provide the month and year the image was acquired. Finding the angle and length of the shadow of an object of known height, such as the Washington Monument (169 m in height), can help pinpoint the day and time the image was taken. Of course, if Google Earth is used for this, the ruler tool will provide the shadow's length and direction directly, and the image acquisition date provided greatly simplifies the determination of time of day (figure 3).
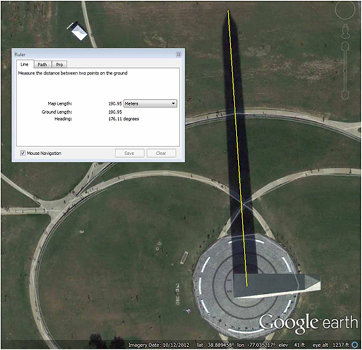
Figure 3. Shadow length of the Washington Monument as measured in Google Earth. The length is 191 m and the direction (drawn from the tip of the shadow to the centre of the monument's base) is 176° east of north. Map data: Google, Commonwealth of VA, DigitalGlobe, DGIS, Sanborn, USGS, USDA Farm Service Agency.
Download figure:
Standard image High-resolution imageThe shadow's length can be used to determine the Sun's altitude through the use of the equation
Calculation of this angle for the measured shadow length and known height of the monument yields an altitude of 41.5°.
The time of day when the image was taken can be found by the use of the National Oceanic and Atmospheric Association (NOAA) website [11]. Washington DC is already on the city list at the website, so providing exact latitude and longitude coordinates is unnecessary (though possible for places not on the list). Measuring the shadow's direction from its tip towards the monument rather than in the (perhaps more intuitive) opposite orientation provides the Sun's azimuth. One then plugs in the date (12 October 2012) and, by trial and error, adjusts the time of day until the best match is found. As daylight saving time was in effect on that date, we see that at 12:43 pm, the Sun's azimuth was 176.09°.
A similar exercise in Google Maps involves the use of an auxiliary website [12] as well as requiring the user to experiment with changing both time and day in an effort to match the Sun's azimuth and its altitude (the altitude being determined by the shadow's length compared to the object's actual height). Going to the location of the Washington Monument in Google Maps, the user can zoom in and then right-click on the centre of the base of the structure. One of the choices given is 'Directions from here'. The process is then repeated at the apex of the shadow and 'Directions to here' is chosen. While Google Maps will not actually be able to provide directions, the Start and End boxes will now contain the exact latitude and longitude of the two points needed (figure 4).
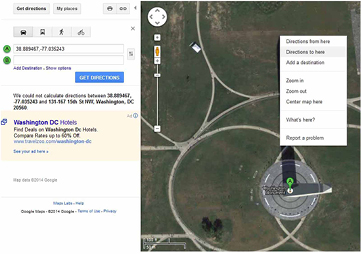
Figure 4. Using the navigation feature of Google Maps to set starting and ending points at the ends of a shadow. The boxes labelled 'A' and 'B' on the left will then contain the coordinates of these two points. Map data: Google, Commonwealth of VA, DigitalGlobe, DGIS, Sanborn, USGS, USDA Farm Service Agency.
Download figure:
Standard image High-resolution imageThe website in [12] has a section labelled 'Calculate the distance between two addresses'. The starting and ending coordinates from Google Maps are input as Location 1 and Location 2. The 'Distance' button then gives the length of the line connecting them as well as its azimuth (figure 5).

Figure 5. Entering the coordinates of the endpoints of the shadow at the gpsvisualizer.com website allows the distance (190 m) and azimuth (approximately 176°) to be found immediately, and then a line connecting them may be rendered on the map.
Download figure:
Standard image High-resolution imageA button labelled 'Draw map' will then reproduce the map with the addition of a line connecting the two points (figure 6). This process could be used to find the Sun's location (and therefore the day and time) when the central object's height is known, or it could be used to find the heights of (less famous) objects if Google Earth is used so that the date that the image was taken is also available. It is worth mentioning that the area around the monument is rather flat, eliminating potential measurement inaccuracies.
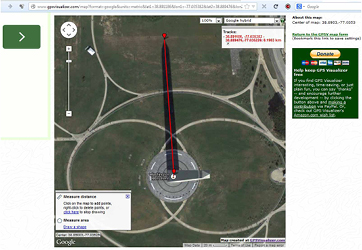
Figure 6. Map (with connecting line) produced from figure 5. Map data: Google, Commonwealth of VA, DigitalGlobe, DGIS, Sanborn, USGS, USDA Farm Service Agency.
Download figure:
Standard image High-resolution image4. Airport runway numbers
Although the scheme determining runway numbers is no secret, many people are not aware of how the numbers are assigned. As explained in more detail in [13], and shown in figure 7, runway numbers are derived from the runway's azimuth divided by 10.

Figure 7. The four corners of Heathrow Airport. Opposite ends of the same runway have number designations 18 units apart since they represent directions 180° apart. As the runways at Heathrow are oriented due east/west (corresponding to 90° and 270°), they are numbered 09 and 27. The 'L' and 'R' shown indicate that on approach, 09 L is on the pilot's left and 09 R is on the right. Map data: Google, The Geoinformation Group.
Download figure:
Standard image High-resolution image5. Satellite imagery?
A popular misconception about Google Earth and Google Maps is that Google's image library is entirely derived from satellites. While these programs do incorporate some satellite imagery, the high-resolution images shown in this paper were clearly produced by aircraft. A glance at any of figures 3, 4 or 6 reveals that the western face of the Washington Monument is clearly visible. Searching for visible western or eastern faces on buildings in that area of Washington suggests that the midpoint (and therefore the plane's line of travel) is along a meridian at approximately 77.0529° W.
Figure 8 shows the apparent overflight point about 250 m west of the Lincoln Memorial (itself approximately 1.3 km to the west of the monument) viewed from directly overhead.

Figure 8. View of the Lincoln Memorial (located approximately 1.3 km due west of the Washington Monument) from imagery obtained the same day and time as figures 3, 4 and 6. In the previous figures, the western side of the Washington Monument is clearly visible, while the image above appears to have been taken from a point almost directly over the memorial. Closer inspection of buildings in the area suggests the overflight line to be nearer to the water's edge on the left (western) side of the photo. Map data: Google, Commonwealth of VA, DigitalGlobe, DGIS, Sanborn, USGS, USDA Farm Service Agency.
Download figure:
Standard image High-resolution imageThe ruler tool in Google Earth can be used to measure the apparent height of the western face of the monument from base to tip (approximately 53 m). The arctangent of that apparent height divided by the monument's true height would suggest a viewing angle of about 17°. If the distance along the ground between the plane and monument is 1550 m and the angle from the monument's base to the plane is 17°, we predict an airplane altitude of 1550 m/tan 17°, or about 5100 m.
The fact that the monument is tapered slightly complicates things, so we also made a comparison through the construction of the monument as a set of four quadrilaterals and four triangles within the Mathematica computer software. A scale model of the monument, the memorial, and the distance between them was created, under the assumption that the images were taken from directly above a point 250 m to the west of the memorial (itself modelled as a 40 m × 60 m rectangle). Screen shots were taken at a variety of simulated altitudes until the proportions in the model matched those on Google Earth (figure 9). This method suggested an altitude of 4800 m, meaning that the viewing angle was about the same as was calculated by ignoring the monument's taper. These altitudes are of the same order of magnitude as the 5500 m lower ceiling specified in the flight restriction zone (FRZ) covering the area in question [14]. Flights below 5500 m are not completely prohibited, however.
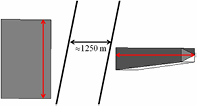
Figure 9. Mathematica simulation of Lincoln Memorial (left) and Washington Monument (right) as seen from a point 4800 m above and 250 m west of the memorial. The simulated view of the monument can be compared to the views in figures 3, 4 and 6.
Download figure:
Standard image High-resolution imageFurther examination of the area surrounding this part of Washington suggests that the images were acquired by an airplane flying approximately due south over a line passing through or near the Lincoln Memorial. We can determine that the flight was to the south rather than to the north by looking at other latitudes along the meridian passing through the memorial and noting the shadow angles of lampposts, flagpoles, etc. Following along the meridian from latitudes north of the memorial to those south of it reveals shadows indicating a solar azimuth changing from about 174° to about 179°.
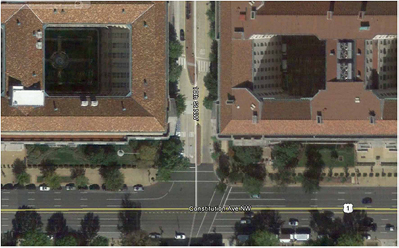
The width along the ground during one pass can be determined by looking for points where the viewing angles change dramatically; for example, figure 10 clearly shows the discontinuity of viewing angles at the intersection of Constitution Avenue and 10th Street. The western boundary of the strip containing the monument and the mall (not shown) is near the Arlington, VA, courthouse (38.891° N, 77.084° W). The width imaged on this pass was therefore approximately 5 km.
Figure 10. Google Earth view from above 10th St NW and Constitution Ave NW, approximately 800 m east of the Washington Monument. The building on the left (western) side of the photo was imaged from the same aerial position as the Washington Monument in figures 3, 4 and 6, as is clear by the visibility of the western wall bounding its courtyard. The building on the right (eastern) side of the photo was clearly taken from a vantage point far to the east of it and the two photos were 'stitched' together along the 10th St boundary. Map data: Google, Commonwealth of VA, DigitalGlobe, DGIS, Sanborn, USGS, USDA Farm Service Agency.
Download figure:
Standard image High-resolution image
Google Earth can be used for a myriad of classroom activities, four of which are demonstrated in this paper. The vast database of Google Earth allows students to determine magnetic north, find the time an image was acquired, the reason airport runways are labelled as they are, and whether a given view in Google Earth was captured by an airplane or a satellite. The exercises discussed herein can be used in the classroom as is, but an appealing twist would be to cast them as forensic mysteries. An example of this would be asking the students if the airplane taking photos of Washington DC violated the city's FRZ? Other items of interest include moving cars or planes captured in flight or during takeoff. A 'rainbow' effect frequently surrounds these objects, presumably due to the cameras imaging different colour channels (red, green, and blue) sequentially rather than simultaneously. Just as there are examples of physics all around us in our everyday life, we can also find examples of it throughout these interesting programs.