
Abstract
Experimental and analytical procedures related to the application of nitrogen-15 isotope for material migration studies have been developed and used for tracer experiments in the TEXTOR and ASDEX-Upgrade tokamaks in order to assess the retention of nitrogen in plasma-facing components made of graphite and tungsten. The surface study was performed by time-of-flight heavy ion elastic recoil detection analysis and by means of nuclear reaction analysis based on the 15N(p,γα)12C process. In both tokamaks nitrogen retention has exceeded 10% of the injected gas. In ASDEX-Upgrade the largest fraction of 15N has been detected on protruding parts near the injection port, while around 4% has been found in the divertor. The ASDEX-Upgrade results have also been modeled. Helium trapping has been measured in deposits containing tungsten and nitrogen.
Export citation and abstract BibTeX RIS
1. Introduction
Processes of material erosion, migration and deposition are decisive for material lifetime and fuel inventory. They lead to a drastic modification of plasma-facing components (PFC). Comprehensive experimental approach to the determination of erosion phenomena involves a combined application of optical spectroscopy, surface probes for ex situ examination and tracer materials. The term 'tracer' here denotes species introduced on purpose to the plasma edge, either by injecting uncommon (e.g. tungsten hexafluoride, WF6) or isotope-labeled (e.g. 13CH4) gases, by ablating tracer material using lasers to follow the fate of the element. For instance, experiments based on injection of methane labeled with 13C in TEXTOR [1–3], JET [4–6], ASDEX-Upgrade (AUG) [7] and other machines [8, 9] were carried out to assess co-deposition and fuel retention. A large variety of multilayer marker tiles allowed for detailed studies of erosion–deposition processes [1, 4, 6]. Another issue is the determination of transport and retention of impurity gases seeded to plasma for edge cooling [10, 11] or used for wall conditioning [12] and mitigation of fuel inventory [13]. For all applications nitrogen is commonly used. Optical plasma spectroscopy measurements clearly indicate the in-vessel retention of nitrogen indicate that nitrogen remains in vessels with both carbon and metal walls [14, 15]. This 'memory effect' points to the accumulation of the seeded element in PFC. However, when nitrogen-14 isotope is applied, the quantitative assessment of in-vessel retention is complicated by the fact that nitrogen-containing species (e.g. NH3−xDx) coincide in the mass spectrum with various deuterated hydrocarbons and the water group [16]. In surface analysis it is also uncertain whether the presence of nitrogen detected in PFC is purely related to co-deposition/co-implantation during the exposure to plasma or to the adsorption of species from air after the materials had been retrieved from a torus and stored in atmosphere prior to the surface analysis. The solution is offered by a marker method based on a rare nitrogen isotope: nitrogen-15. This contribution provides an overview on the development of experimental and analytical procedures for nitrogen retention studies using 15N which was applied for the first time as a marker in the TEXTOR and AUG tokamaks.
2. Experimental
Three elements are crucial in the design of marker experiments: selection of a proper tracer, decision on its injection point and availability of sensitive surface analysis methods for ex situ studies of short-term probes and/or wall components. Additional information may be inferred from mass spectrometry of exhaust gases [17]. 15N as mentioned in the introduction, was used [18–20] and has a natural abundance of 0.37 versus 99.63% for 14N and therefore, following the injection of the pure tracer gas (15N2) can represent different plasma conditions compared to the already present nitrogen. Injection of 15N tracer was performed in two controlled fusion devices: TEXTOR with main wall components made of graphite and, in AUG where graphite tiles are coated with tungsten.
2.1. Experimental conditions
Two experiments were performed in TEXTOR. In both cases nitrogen was injected toroidally symmetrically, while—in the second experiment—other marker gases (WF6 and 13CH4) were introduced locally through test limiters. The first experiment was performed with a double roof-shaped test limiter composed of a graphite holder and four stripes: two made of tungsten and two made of graphite. It was inserted into the machine from the top and placed 1.5 cm deep into the scrape-off layer plasma. The last-closed flux surface was defined by the position of the main toroidal limiter ALT-II (advanced limiter test) at minor radius 46 cm. The system was exposed to discharges with edge cooling by injecting first 14N and then 15N isotopes. The total amount of injected 15N2 was 6.4 Pa m3, i.e. 3.4 × 10²¹ 15N atoms, in 18 discharges of a total duration of 112 s. The exposed limiter is shown in figure 1(a). One may distinguish a shiny-looking erosion area on the top and blackish deposit on the lower part of plates.
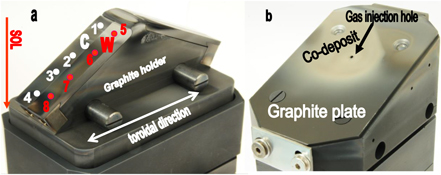
Figure 1. Roof-shaped test limiters used at TEXTOR during the tracer experiments with 15N injection to the torus: (a) limiter with tungsten and graphite stripes after exposure to plasma in TEXTOR with marked locations of the analyzed spots; (b) limiter with a graphite plate through which the WF6 was injected during the 15N puffing.
Download figure:
Standard image High-resolution imageAn assembly of the test limiter in the second experiment is shown in figure 1(b): a single roof-shaped block on which a polished plate (both made of graphite) with a hole for WF6 puffing was attached. The image was taken after the exposure which led to the formation of a co-deposit near the gas inlet. The limiter assembly was placed 2 cm from the last-closed flux surface from the bottom of TEXTOR. The injection of 3.5 × 10²¹ 15N atoms in 14 shots with neutral beam heating was accompanied by puffing of 1.9 × 10²⁰ W atoms and 13CH4 (1.8 × 10²¹ 13C atoms) from the upper test limiter [20]. The experiment was performed on the last operation session before the shut-down and the main plasma parameters were: line averaged plasma density ne = 3.5 × 10¹⁹ m−3, plasma current Ip = 0.35 MA and the magnetic field strength Bt = 2.25 T.
The experiment in AUG was also performed during the last operation session of the 2010–2011 campaign before the major shut-down. In total ∼ 4.6 × 10²² atoms of 15N were puffed into hydrogen plasma during 10L-mode discharges. The main parameters were: line averaged plasma density ne = 5.8 × 10¹⁹ m−3, plasma current Ip = 0.8 MA and the magnetic field strength Bt = −2.5 T. The discharges were heated by 1.8 MW neutral beam injection and 0.96 MW electron cyclotron resonance. The puffing was performed from a single location: a port in the outer midplane in sector 9. Due to the inlet construction the gas portion was reaching plasma like a plume. The same port was also used for puffing 13CH4 during the same discharges in equal quantity of 13C atoms. The migration of 13C is discussed elsewhere [21]. Following the experiment 35 tiles were removed from AUG and then analyzed: 12 from the lower and 8 from the upper divertor, 4 from the inner heat shield; 9 from protection limiters of the ion cyclotron resonance frequency (ICRF) antenna and two limiter plates from the main chamber.
2.2. Surface analysis
The exposures were followed by comprehensive surface analyses using accelerator-based ion beam methods to determine all species co-deposited on PFC during the injection experiments. Nuclear reaction analysis (NRA), Rutherford backscattering spectroscopy, time-of-flight heavy ion elastic recoil detection (ToF-HIERDA) [22] were done on a large number of tiles retrieved from the tokamaks. Tandem accelerators and particle detection facilities at the Uppsala University (5 MV) and at the Max Planck Institute for Plasma Physics (3 MV) were used.
For ToF-HIERDA a 26 MeV 127I7+ beam was used. The method is very well suited for light isotopes, including nitrogen. The beam impinges on the sample at the angle of 22.5°, whereas the recoils are detected at 45° with respect to the direction of the incoming beam. The ToF tube consists of two very thin carbon foils and an implanted silicon solid-state energy detector. When the recoiled species passes through the foils a signal is triggered and the flight time can be measured. To reduce the noise, the signal from the second foil is used as the start signal for the timing and, the signal from the first detector is delayed and then used as the stop signal [22]. Finally the total remaining energy of the recoil is collected by a solid-state detector. The reversed flight time and the energy gives banana-shaped traces for each recoiled mass from which the depth distribution can be calculated for smooth surfaces [23]. For reliable results smooth surfaces is preferable, therefore, they were restricted to polished graphite or tungsten plates.
The study of the spatial distribution of 15N in co-deposits from AUG was performed by means of NRA using a 900 keV proton beam and detecting both reaction products of the 15N(p,γα)12C reaction: γ-rays and α-particles. The measurements in the complex mixture of light and heavy species (e.g. tungsten) required proper calibration of the analysis system. α-particles were detected by a silicon solid state detector (150° at relative to the incoming beam) protected by a 17 μm Mylar foil to eliminate the background from protons backscattered from tungsten-coated tiles. The choice of the foil thickness is crucial: thick enough to stop the scattered protons but still thin to allow α-particles from the nuclear reaction to pass through. Another serious issue is to distinguish effects related to nuclear reactions with boron [24], used in AUG for wall conditioning. The presence of this element results in a continuum of alpha particles in the spectrum at energies overlapping with the peak from the 15N reaction. At low boron contents the 15N peak can be separated from the background. For detecting the γ-spectrum a NaI crystal detector with a photomultiplier tube was used to obtain sufficient energy resolution to separate the 4.43 MeV 15N peak from other high energy signals. The calibration of the entire analysis system required reference samples with implanted 15N to properly assess γ-ray and α-particle conversion factors and to adjust the beam energy for maximum γ-ray yield.
3. Results and discussion
3.1. Nitrogen detection in TEXTOR
Figure 2 shows the HIERDA spectrum recorded on the graphite plate, shown in figure 1(a), which was exposed during the 14N and then 15N injection into TEXTOR. The spectrum reveals the presence of light isotopes in the co-deposit: hydrogen, deuterium fuel species, carbon eroded from limiters (including 13C injected to the torus on many occasions), boron from wall conditioning and oxygen which has partly been co-deposited as the plasma impurity atom and, partly absorbed by the layer when the exposed probe was stored in ambient atmosphere. Most relevant are the identification of helium, both nitrogen isotopes and fluorine (from WF6 injections [20, 25]), which could be detected due to the very high sensitivity of HIERDA. Other features belong to metals (Ni, Cr, Fe) from the Inconel liner and tungsten. Attempts to detect fluorine residual impurities were undertaken previously, but the sensitivity of the applied techniques was lower than that of ToF-HIERDA.
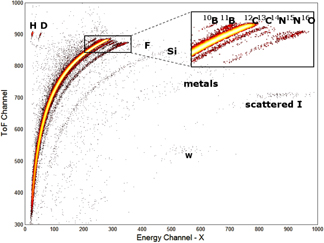
Figure 2. ToF-HIERDA spectrum recorded with a 26 MeV 127I7+ beam for co-deposits on the graphite plate exposed to the TEXTOR plasma on a test limiter.
Download figure:
Standard image High-resolution imageThe analyzed spots on both materials are marked with the numbered circles. The quantitative data for deuterium, nitrogen isotopes and helium measured in all four points on the C and W plates are collected in graphs in figure 3. As expected, nearly no deposition has been found in the region on the top of the limiter, i.e. point 1 on the graphite and point 5 on the tungsten plate. However, in all other areas the presence of 14N and 15N is detected, thus proving that a certain fraction of the gas injected for edge cooling remains in the vessel either as co-deposited atoms or compounds (such as C–N, W–N) formed on PFC under plasma impact.
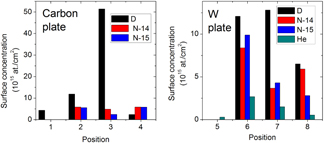
Figure 3. Deposition of deuterium, nitrogen isotopes and helium on the test limiter exposed in TEXTOR: (a) graphite plate and (b) tungsten plate.
Download figure:
Standard image High-resolution imageIt should be stressed that in earlier experiments with nitrogen injection a small amount of that species (1–3 × 1015 cm−2) was measured with ToF-HIERDA on a tungsten test limiter exposed to discharges seeded with 14N [14]. Also traces of WN have been observed with x-ray photoelectron spectroscopy but it was difficult to quantify 'tokamak-related' nitrogen knowing that it could also be ad- or absorbed from atmosphere prior to the ion beam analysis measurements. The experiments with puffing a rare 15N isotope leave no doubts that the puffed nitrogen sticks to PFC surfaces. This also explains plasma memory effect in operation with nitrogen seeding, as described in the introduction. Helium is used for glow discharge cleaning and as a component of a B2H6–He mixture for the boronization process with both carbon and metal walls. Its detection in relation to W but not C is consistence with the high He impurity reported by Schmidt [26] for AUG. Its presence may be related either to the diffusion and trapping in tungsten or in mixed compounds such as WxC, WxN, WO2, which were detected earlier by XPS [14].
Graphs in figures 4(a)–(c) represent maps of nitrogen and tungsten distribution on the graphite plate, shown in figure 1(b), with a deposit formed in the second tracer experiment in TEXTOR with 15N2 toroidally symmetric injection and WF6 puffing through the test limiter. The position of the gas inlet is marked with a black dot. All data for the concentration of species are in 1015 cm−2. Pattern of the tungsten deposition is shifted due to drifts toward the high field side. The concentration exceeds locally 1 × 1018 cm−2 with the maximum around 1 cm from the WF6 injection hole. The distribution is similar to that measured [27] and modeled [28] earlier for 13C after experiments with the injection of 13CH4 through the limiter. On the contrary, the maximum deposition of nitrogen isotopes is extended in the opposite direction. The pattern is nearly the same for 15N and 14N though the specific sources of the isotopes were different. While 15N was injected during the experiment, the other isotope has originated mainly from re-erosion and transport of species accumulated earlier in PFC in various locations. The isotope exchange, 15N to 14N, when the sample was stored in air cannot be fully excluded. However, it should be stressed that the measurements performed at different time intervals after the experiment did not show the decrease of the 15N content.
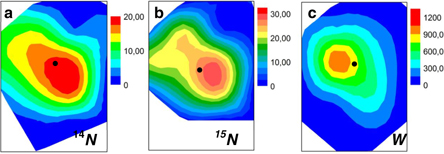
Figure 4. Contour maps of species co-deposited on the graphite plate during the injection of 15N and tungsten hexafluoride to TEXTOR: (a) 14N, (b) 15N and (c) tungsten. All units is in 1015 at cm−2 for the respective species. The maps were obtained by ToF-HIERDA measurement in a grid pattern over the sample with 1–2 cm resolution.
Download figure:
Standard image High-resolution image3.2. Injection of nitrogen in ASDEX-Upgrade
The amount and distribution of the tracer was determined on 35 divertor and limiter tiles. The fraction of the 15N tracer retained on PFC could be assessed at the level of 14–15% of the total seeded gas. Approximately 10% was deposited on the main chamber wall and 4% in the divertor, as described in detail in [19]. The measurements have shown a global, non-uniform, deposition of nitrogen. The deposition pattern could not be fully reconstructed by early modeling [19] but it encouraged advanced studies. Images and graphs in figures 5(a) and (b) summarize the nitrogen deposition studies near the injection point which was located at the outer midplane on the right side of the antenna for ICRF heating—it is marked with a circle. Toroidal distribution of 15N measured along several antenna protection tiles is shown on the graphs (figures 5(c)–(f) which demonstrates that the distribution is not uniform. The greatest deposition is found on the protruding parts of the antenna protection tiles.

Figure 5. Deposition pattern of N-15 on the ICRF antenna protection tiles in AUG: (a) the antenna; (b) results of deposition modeling, (c)–(f) deposition profiles measured by NRA 15N(p,γα)12C.
Download figure:
Standard image High-resolution image
The drawing in figure 5(b) presents the result of modeling. The dissociation chain of the injected gas molecules was modeled with ERO [29] until reaching 15N+ ions with plasma parameters measured during a reference discharge of the experiment. After ionization, the ASCOT code [30] tracked the ions using a magnetic equilibrium from the discharge #27385, a three-dimensional wall geometry of AUG and assuming a background plasma calculated with SOLPS [31].
According to modeling the deposition is not uniform and the greatest concentration of 15N is expected for the antenna protection tiles closest to the injection location at the middle of the antenna, which is also seen experimentally. On the antenna protection tiles on the opposite side of the antenna the highest concentrations are instead expected in the upper part which also is in accordance with the experimental results. This shows a good qualitative agreement between the experimental and modeled data. However, to elucidate the absolute values and to achieve still better correlation with the concentrations measured in deposits it would be necessary to include in the model also retention and re-erosion mechanisms.
4. Concluding remarks
The application of a rare 15N tracer gas for material migration experiments in two tokamaks in combination with sensitive surface measurements by ToF-HIERDA and NRA have allowed for a firm statement on the in-vessel retention of nitrogen by co-deposition or by the compound formation with materials of PFC.
All analysis data indicate that at least 10% of the injected cooling medium is retained in the wall. This explains the 'memory effect' when nitrogen is observed in plasma operation without seeding of that gas. A more precise quantitative determination of the total retention can be achieved by the combination of a complete gas balance and ex situ measurements performed on more tiles. The experiment in AUG served to improve complex modeling and benchmark codes. A qualitative agreement has been achieved between the experiment and the model. This demonstrates that the assumption of the full toroidal symmetry should be modified to reflect the deposition pattern in the three-dimensional model in the realistic manner as discussed in [30].
Understanding of the nitrogen migration may help develop tokamak operation scenarios and define limits regarding the nitrogen injection. The latter may become essential in the case of nitrogen–tungsten combination such as in operation with the tungsten divertor in operation in JET with the ITER-Like Wall [32] where nitrogen co-deposition has been measured on the components retrieved from JET-ILW [33].
It should also be noted that ToF-HIERDA analysis has led to the direct measurement of helium in tungsten. In summary, these first and successful experiments with 15N and the development of sensitive measuring techniques open new possibilities in material migration studies in controlled fusion devices.
Acknowledgments
This work was funded jointly by the Swedish Research Council, Forschungszentrum Jülich and by the European Communities under the Contracts of Association between EURATOM and VR, FZJ, IPP and TEKES within the framework of the European Fusion Development Agreement. The views and opinions expressed herein do not necessarily reflect those of the European Commission. The work was partly carried out under the contract numbers 621-2009-4138 and 621-2012-4148 from the Swedish Research Council (VR).