


Abstract
When the kilogram is redefined in terms of the fixed numerical value of the Planck constant h, the x-ray-crystal-density (XRCD) method, among others, is used for realizing the redefined kilogram. The XRCD method has been used for the determination of the Avogadro constant NA by counting the number of atoms in a 28Si-enriched crystal, contributing to a substantial reduction of uncertainty in the values of NA and h to 2 parts in 108. This method can be therefore used reversely for the mass determination of a 1 kg sphere prepared from the crystal. This is realized by SI-traceable measurements of its lattice parameter, isotopic composition, volume, and surface properties. Details of the corresponding measurements are provided, as well as the concept of the XRCD method, isotope enrichment, crystal production, sphere manufacturing, and evaluation of impurities and self-point defects in the crystal, together with mass comparison with respect to the silicon sphere for disseminating mass standards.
Export citation and abstract BibTeX RIS

Content from this work may be used under the terms of the Creative Commons Attribution 3.0 licence. Any further distribution of this work must maintain attribution to the author(s) and the title of the work, journal citation and DOI.
1. Introduction
The concept of the x-ray-crystal-density (XRCD) method, sometimes referred to as the x-ray-crystal-density-molar-mass (XRCDMM) method, was developed early in the 20th century, when scientists were interested in a fundamental relationship between the x-ray wavelength and the parameters of the crystal lattice. Bragg [1, 2] estimated the dimensions of the NaCl unit cell from the known values of the Avogadro constant NA, density ρ, and molar mass M of the crystal. Bearden [3] dedicated his life to finding a more reliable value of the lattice parameter.
An innovative principle was developed in the 1960s by Bonse and Hart [4], who operated the first x-ray interferometer to determine the lattice constant a of a silicon crystal based on interferometry in the optical wavelength region. According to this principle, evaluation of the x-ray wavelength and measurement of the corresponding diffraction angle are not necessary. This development thus paved a new way for counting the number of atoms in a crystal. Deslattes et al [5, 6] first used this principle in the 1970s for the determination of NA based on measurements of the lattice plane spacing d220, ρ, and M of Si crystals with natural isotopic compositions. Their report stated that the artefact of the kilogram could be replaced with a new algorithm realized by the XRCD method. However, the value of the lattice constant reported therein has an offset of about 1.8 parts in 106. In the 1980s, using the x-ray interferometer, Becker et al [7] reported a reliable value of the Si crystal lattice constant with a relative standard uncertainty of 6.2 × 10⁻⁸. This value is still consistent with updated values for Si crystals with natural isotopic compositions [8].
The density measurement has also been improved. An early type of density measurement used a steel sphere [9], where the volume of the sphere was determined by diameter measurements at different orientations. The densities of Si crystals were then determined through hydrostatic weighing of the steel sphere and the crystal in a liquid [10]. Later, Zerodur cubes were similarly used as primary density standards to determine the density of silicon crystals by hydrostatic weighing and to determine the Avogadro constant with a relative standard uncertainty of 1.1 parts in 106 [11]. After the development of a polishing technique for manufacturing 1 kg Si spheres [12], it became possible to determine the density of a Si crystal by direct measurements of its diameter and mass thereby eliminating the need for hydrostatic weighing, leading to substantial reduction of uncertainty in the density measurement [13–15]. In order to further reduce the abovementioned uncertainty, an accurate evaluation of surface layers of the Si sphere became necessary. Surface evaluation by spectroscopic ellipsometry (SE), x-ray reflectometry (XRR), x-ray photoelectron spectroscopy (XPS), and x-ray fluorescence (XRF) spectrometry is being conducted in the most recent studies [16]. The uncertainty in the density of Si crystals has thus been reduced to a few parts in 108.
The determination of the molar mass of silicon proved to be very difficult, since the amounts of the three naturally-occurring Si isotopes could not be measured accurately enough. In order to overcome this bottleneck in the determination of NA, isotope enrichment of Si was undertaken [17]. The International Avogadro Coordination (IAC) project was launched in 2004 to reduce the uncertainty in NA using a crystal highly enriched in 28Si. A new concept of applying isotope dilution mass spectrometry to a 28Si-enriched crystal was developed by Rienitz et al [18]. This method reduced the uncertainty in measuring M to a few parts in 109.
Most recent results on the determination of NA by the XRCD method using a 28Si-enriched crystal have already been published in 2011 and 2015 [19–21]. The relative standard uncertainty in NA thus achieved is estimated to be 1.8 × 10⁻⁸ [22]. This is almost identical to the smallest uncertainty achieved by the watt balance method [23]. Redefining the kilogram by fixing the numerical value of the Planck constant makes it possible to realize a mass of 1 kg by the XRCD method with nearly the same relative uncertainty. The purpose of this article is therefore to specify the method for realizing the redefined kilogram by the XRCD method.
2. Principle of the XRCD method
Up to now, only silicon crystals have been used for accurate measurements using the XRCD method, mainly because the semiconductor industry developed growth technologies for large silicon single crystals having extremely high chemical purity and no dislocations. Therefore, this section focuses on silicon crystals, although the method can also be used for other crystals.
Using combined x-ray and optical interferometry, the lattice parameter a of silicon can be measured traceably to the SI length unit, the metre (see section 5). Figure 1 shows the unit cell of silicon—a cube with edge length a, which contains eight atoms on average, meaning that the atom at the corner is shared by 8 unit cells and that on the face is shared by 2 unit cells. If the volume V of a macroscopic silicon crystal is measured, the number N of atoms in the crystal is

where it is assumed that atoms only occupy lattice sites, and that all lattice sites are occupied by silicon atoms. As can be seen in equation (1), the measurement of the ratio V/a3 does not always require absolute length measurements traceable to the definition of SI. The temperatures during the measurements of the volume V and lattice constant a also do not require absolute evaluation, being satisfactory that the temperatures during the both length measurements are the same within a required uncertainty. However, traceable or, at least, reproducible measurements are still necessary to compare the data obtained at different laboratories and at different time.

Figure 1. Unit cell of the silicon cubic crystal, with edge lengths equal to the lattice parameter a.
Download figure:
Standard image High-resolution imageIn the XRCD method, a sphere of ~1 kg mass is normally used, and its volume V is calculated from the measured mean diameter D (see section 8). Since silicon crystals are usually covered with thin oxide layers having a total thickness of ~2 nm, the 'core' volume of the sphere without the surface layers has to be evaluated to accurately measure NA. The core volume is hereinafter referred to as Vcore, and simply deduced from mean core diameter Dcore as Vcore = (π/6) . Therefore, the surface of the sphere needs to be chemically and physically characterized on an atomic scale (see section 7).
After determination of the sphere mass, msphere, and the mass of the surface layers, mSL, the core mass is obtained as

and the mean mass of a silicon atom is obtained as

When the influence of impurities and self-point defects in the crystal on the core mass is neglected for simplicity, the microscopic density ρμ is equal to the macroscopic density ρm, leading to

In a real crystal, the influence of impurities and self-point defects on the core mass is not negligible [20, 21], with details of the influence provided in section 4.
Since natural silicon consists of three stable isotopes, 28Si, 29Si, and 30Si, the isotopic composition, i.e. the amount-of-substance fraction, x(iSi), of each isotope iSi in the crystal has to be measured (see section 6) in order to determine the mean molar mass of silicon as follows:
where Mu is the molar mass constant (Mu = 0.001 kg mol−1 exactly in the current SI), Σix(iSi) = 1, and Ar(iSi) the relative atomic mass of each isotope iSi. Consequently, the amount of substance, n = mcore/M, and the Avogadro constant are expressed as follows:

This equation is used to determine NA and fix its numerical value for the revised definition of the mole (the unit for amount of substance) in the revised SI.
Using rigorous relations between fundamental physical constants [24], the mass of an electron is expressed as

where h is the Planck constant,  is the Rydberg constant, c is the speed of light in vacuum, and α is the fine-structure constant. NA is therefore related to h as
where Me = MuAr(e) expresses the molar mass of electron. On the right-hand side of equation (8), the constants Mu, Ar(e),  , c, and α are already known with very small uncertainties, and of these the fine-structure constant has by far the largest relative uncertainty. Today, the lowest uncertainty for the fine-structure constant is achieved by theoretical calculations based on the quantum electrodynamics (QED) combined with the measurement of the electron magnetic moment anomaly [25].
Another relation between NA and h can be derived from the ratio h/m(X) for an atom X, which can be determined by atom recoil measurements using atom interferometry [24]. Thus, the Planck constant can also be determined using the following equation:
where M(X) and Ar(X) represent the molar and relative atomic mass of atom X, respectively. This method also yields a value for the fine-structure constant and thus can confirm the result from the QED theory combined with the data on the electron magnetic moment anomaly. Combining both methods, cMeα2/(2 ) is determined with a relative standard uncertainty of as small as 4.5 × 10⁻¹⁰ [25]. This means that NA can be related to h without seriously increasing the uncertainty, implying the validity of reversely using the XRCD method for realizing the redefined kilogram.
2.1. Realization of the mass unit in the revised SI
In the revised SI, the numerical values of h and NA will be fixed in order to redefine the kilogram and the mole, respectively. Considering that the mass of each isotope iSi is expressed as

and combining equations (2), (3), (7) and (10), the mass of a silicon sphere is expressed as follows:
In this equation, 2h /(cα2) is the mass of the electron, Σix(iSi)Ar(iSi)/Ar(e) is the mean mass ratio of silicon to the electron, 8Vcore/a3 is the number of silicon atoms in the core, and mdeficit is the influence of point defects (i.e. impurities and self-point defects in the crystal) on the core mass (see section 4). The last term (mSL) adds the mass of the surface layer. Thus, the mass of the whole sphere is characterized completely and can be used to disseminate the unit for mass.
2.2. Realization of the kilogram using already characterized crystals
Once the amount-of-substance fractions x(iSi) and the lattice constant a of a 28Si-enriched crystal are measured, it is confidently believed that they are constant over years. There is no known mechanism that changes those parameters when the Si crystal is kept close to room temperature. This means that for each realization of the kilogram, measuring the diameter and surface layers of the 28Si-enriched spheres is usually satisfactory. The XRCD method is therefore very practical for realizing the kilogram, since the measurements of the amount-of-substance fractions and the lattice parameter are not always necessary.
However, when a new crystal is grown, the amount-of-substance fractions, the lattice spacing, and impurity concentrations of the new crystal have to be characterized by either absolute or differential measurements with respect to the already characterized crystals.
3. Isotope enrichment, crystal production, and manufacturing of silicon spheres
When silicon of natural isotopic composition is used, the uncertainty of the XRCD method is limited by determination of the molar mass. Therefore, it became necessary to produce isotopically enriched silicon with an enrichment exceeding 99.99%. The first large 28Si-enriched single crystal, designated as Si28-10Pr11 or 'AVO28', was grown in 2007 [26]. Two 1 kg spheres, AVO28-S5 and AVO28-S8, were manufactured from this crystal.
In 2012, a new project was initiated to produce more 28Si-enriched crystals for the realization of the redefined kilogram [27]. In 2015, the first new 28Si-enriched crystal became available [28], and four other crystals are in preparation. Two 1 kg spheres will be produced from each crystal. In addition to high enrichment, the crystals must be chemically pure, i.e. not contain any impurities or dopants.
3.1. Isotopically enriched silicon
The production of highly enriched silicon starts with the production of gaseous silicon tetrafluoride (SiF4) by decomposition of Na2SiF6 powder:

or directly from highly pure crystalline silicon and gaseous fluorine:

Since fluorine is composed of a single stable isotope, 28SiF4 can be isotopically enriched by centrifugation. The enrichment technology uses cascades of hundreds of centrifuges and must be optimized to reach an extremely high chemical purity of the extracted 28SiF4. In particular, impurities containing silicon with natural isotopic composition have to be avoided, like Si2F6O and SiF3OH. Subsequently, 28SiF4 is chemically transformed into silane (28SiH4) using finely dispersed calcium hydride (CaH2) at a temperature of about 1800 °C by the following reaction:

To prevent contamination by carbon, the reaction is carried out in absence of organic solvents.
Fluorine-containing compounds (fluorosiloxanes) and light hydrocarbons are the main contaminants in the produced silane, which is then preliminarily separated from the low-volatile impurities and finely suspended particles by cryofiltration with sub-cooled boiling. Subsequently, rectification is carried out in a stainless steel column with a feeding reservoir placed in the centre. The fractions enriched with compounds having boiling points lower and higher than silane are simultaneously removed from the top and bottom parts of the column. The concentration of hydrocarbons in the selected fractions can be monitored, for example, by gas chromatography.
Polycrystalline silicon is produced in a specially designed chemical or, more precisely, pyrolytic vapour deposition setup, characterized by a vertical cylindrical 28Si rod. The silane deposition starts on a 28Si rod with a diameter of about 8 mm; this slim rod has to be grown from a previous batch of 28Si, and can be doped with aluminium to allow electrical heating. Owing to the small distribution coefficient of 2 × 10⁻³ for aluminium, it is subsequently easily removed by zone-refining. The operating temperature is measured on-line with an optical pyrometer to control the heating power and keep the rod surface temperature constant. In this way, a 28Si-enriched cylindrical polycrystalline rod is produced as the starting material for subsequent single crystal growth.
3.2. Single crystal growth
The polycrystalline rod is purified by float-zone melting; first in vacuum (to evaporate oxygen) and then in argon, while preserving the low oxygen concentration. Carbon is reduced by segregation via multiple float-zone passing. After float-zone purification, a single crystal is grown using a 28Si seed oriented in the (1 0 0) direction, grown by a crucible-free pedestal method. After the purification, the AVO28 material remained only 4.8 kg. Since a 1 kg silicon sphere is produced from a cylinder with a diameter and height of at least 100 mm, and many other samples for the x-ray interferometers, density uniformity evaluation, molar mass measurements, and impurity evaluation are necessary, the final crystal had to be grown with a varying diameter in order to prepare these samples involving the two 1 kg spheres, as shown in figure 2. The new crystal made in 2015 (Si28-23Pr11) has a simpler shape (see figure 2). Only the small terminal parts of the single crystals are disturbed by back-gliding dislocations and cannot be used for the XRCD method. The isotopic compositions of the existing large 28Si-enriched single crystals are shown in table 1. A flow chart for the production of a 28Si-enriched silicon single crystal is schematically shown in figure 3.
Table 1. Isotopic composition of the 28Si-enriched single crystals.
| Isotope | AVO28 (%) | Si28-23Pr11 (%) |
|---|---|---|
| 28Si | 99.9958 | 99.9984 |
| 29Si | 0.0041 | 0.0015 |
| 30Si | 0.0001 | 0.0001 |

Figure 2. The final float-zone single crystals AVO28 (left) and Si28-23Pr11 (right). Their maximum diameters are ~100 mm. These photographs are courtesy of the Leibniz institute for crystal growth (IKZ). Taken from [20].
Download figure:
Standard image High-resolution image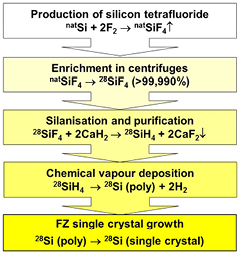
Figure 3. Flow chart showing the production of a 28Si-enriched silicon single crystal (natSi: silicon with natural isotopic composition, poly: polycrystal).
Download figure:
Standard image High-resolution image3.3. Manufacturing of spheres
For determination of the Avogadro constant by measuring the core density, the spheres should be of nearly perfect shape, i.e. the crystal structure should be undisturbed up to the oxide layer, and the roughness of the sphere surface should be far below 1 nm. To allow a highly accurate volume determination by interferometry (see section 8), the deviation of the shape from a perfect sphere should be below 50 nm. In addition, to allow the correction of the phase retardation (see section 8), the oxide formed at the surface should consist only of SiO2.
After the pioneering work of Leistner et al [12, 29], the Physikalisch-Technische Bundesanstalt (PTB, Germany) developed a novel manufacturing chain, which includes diverse process controls [30, 31]. Purpose-built machines now provide contaminant-free spheres with low shape error, low roughness, a very uniform and stable thin oxide layer, and a very low level of sub-surface damage. In the first step, a cylinder is cut out of the ingot by means of a diamond-plated hollow drill. In the second step, the roughly cut form is turned into a sphere in a conventional lathe by means of a polycrystalline diamond cutting tool. The form deviation at this stage is typically less than 1 mm.
Subsequently, a lapping process is performed, consisting of several steps using different grain sizes of alumina. Coarse-grain laps are made of metal, and fine-grain ones are made of glass. These particles are used in aqueous solution, and the procedure induces high mechanical stress and damages the bulk material near the surface. Therefore, each grain size has to remove the surface damage caused by the previous step, where a larger grain size was used. After fine lapping, the form error is expected be of the order of 100 nm. In the final polishing steps, colloidal alumina and titanium oxide (for the finishing process) are used as aqueous suspensions. The steps for manufacturing nearly perfect silicon spheres are shown in figure 4.
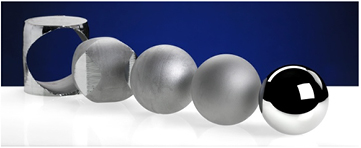
Figure 4. Steps for manufacturing nearly perfect silicon spheres.
Download figure:
Standard image High-resolution imageThe resulting silicon spheres exhibit a shape deviation below 50 nm and a surface roughness below 0.2 nm. No subsurface damage could be detected, and XPS measurements further confirmed that the oxide layers consist almost exclusively of SiO2 [16].
4. Crystal perfection: evaluation of point defects
One of the key prerequisites for using the XRCD method is the existence of nearly perfect single crystals. Although large single crystals can be grown without any silicon dislocations, even for isotopically enriched 28Si, these crystals contain point defects that should be taken into account for the determination of the Avogadro and Planck constants or for the realization of the kilogram after the redefinition.
The main impurities in silicon crystals used in the XRCD method are carbon (C), oxygen (O), and nitrogen (N). Their concentrations are measured by infrared absorption spectroscopy [32]. A typical absorption spectrum is shown in figure 5. The C, O, and N impurities are not electrically active, and their IR absorption is caused by excitation of the local oscillator formed by the impurity atom and the neighbouring silicon atoms.
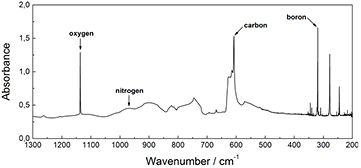
Figure 5. Absorption spectrum of silicon in the infrared region.
Download figure:
Standard image High-resolution imageCarbon impurities are introduced into the raw material (the polycrystalline rod) during the chemical vapour deposition step (see section 3). Due to a low distribution coefficient, kC = 0.07, between the solid and the melt, the concentration of carbon can be reduced in most parts of the single crystal by multiple float-zone (FZ) refinement. The IR spectrometric quantification of carbon is difficult, due to a spectral interference of the Si–C vibrational spectrum with the strongest two-phonon absorption band of silicon. This results in a rather high detection limit for carbon of about 5 × 1014 cm−3.
Similarly to carbon, oxygen is also introduced during the deposition of silicon on the polycrystalline rod. The oxygen content in the crystal cannot be reduced by segregation during FZ growth, since the distribution coefficient is close to 1. Therefore, the oxygen content must be lowered by evaporation in vacuum during FZ crystal growth.
Nitrogen is introduced intentionally during FZ growth as doping material to prevent agglomeration of vacancies such as swirls. It occupies interstitial lattice sites and suppresses the formation of swirl defects. The nitrogen concentration in crystals grown in argon containing 0.1% of N2 amounts to about 2 × 1014 cm−3. This concentration is about as large as the vacancy concentration discussed later in this section. The detection limits of O and N are a factor of ten smaller than that of carbon, i.e. about 5 × 1013 cm−3.
Two main factors contribute to the uncertainties of impurity concentration measurements: the conversion factor for the determination of the impurity concentration from the measured absorption coefficient and the determination of the absorption coefficient itself. In the case of carbon, the latter represents the dominant part of the uncertainty budget, whereas for all other impurities, the uncertainty is mainly caused by the conversion factors. These factors are taken from literature or semiconductor industry standards and have a rather large standard uncertainty, usually in the order of 10%. However, the uncertainty of the core mass due to this impurity correction is still at the level of only ~4 µg, being 3.8 µg for AVO28-S5 and 3.5 µg for AVO28-S8. The uncertainty in the determination of the absorption coefficient is due to the reproducibility of IR measurements, spectral interferences, the unknown impurity concentration in a nominally impurity-free reference sample, and the evaluation procedure for the determination of peak height in IR spectra.
Boron (B), phosphorus (P), gallium (Ga), arsenic (As), and antimony (Sb) impurities are electrically active, and electronic inter-band transitions give rise to numerous absorption peaks in the far infrared spectral range. The detection limits for these impurities are about 1011 cm−3, three orders of magnitude lower than those of local oscillators. Except for boron, the signals are normally near or below the detection limit and negligible for the XRCD method (see table 2).
Table 2. Point defect concentrations in the AVO28-S5 and AVO28-S8 spheres [20, 21].
| Defect | Unit (cm−3) | AVO28-S5 | AVO28-S8 |
|---|---|---|---|
| Carbon | 1015 | 0.40(5) | 1.93(19) |
| Oxygen | 1015 | 0.283(63) | 0.415(91) |
| Nitrogen | 1015 | 0.017(10) | 0.138(30) |
| Boron | 1015 | 0.011(4) | 0.031(18) |
| Vacancy | 1015 | 0.33(11) | 0.33(11) |
Deep level transient spectroscopy (DLTS) was used to detect hydrogen in the AVO28 crystal. The detection limit was 2 × 1013 cm−3, and no hydrogen could be found [20, 21].
In principle, the presence of all chemical elements (except silicon) in the crystal has to be checked. For many elements this can be performed by neutron activation [33]. After activation of a stable atomic nucleus it becomes radioactive and emits characteristic γ-photons, which can be used to identify the chemical element and measure its concentration. This method is called 'instrumental neutron activation analysis' (INAA) and probes silicon crystals without dissolving the samples, thus reducing the risk of contamination. SI traceability is guaranteed by gravimetrically prepared solutions. Analysis of the AVO28 crystal confirmed the high purity of the material by quantifying the amount of 13 elements. The content of 53 other elements was below the detection limits. The quantified contaminants affect the mass of a 1 kg 28Si-enriched sphere only by about 1 µg [34, 35]. Mass spectrometry, in particular glow-discharge mass spectrometry (GDMS), can also be used for the detection of most chemical elements in silicon crystals.
In the case of self-point defects, i.e. vacancies and self-interstitials, investigations of their equilibrium concentrations and diffusion are rather difficult, as the actual concentrations at room temperature are unknown. From calculations, values around 1011 cm−3 are to be expected due to very strong covalent binding, but these data are uncertain within a few orders of magnitude. During crystal growth, the growth velocity is chosen so that self-interstitials have a lower concentration than vacancies. Therefore, the fast-diffusing interstitial silicon atoms are eliminated by recombination with vacancies. Whereas no method of measuring the self-interstitial concentration is available, the vacancy concentration can be measured by an annihilation experiment, since the lifetime of a positron is increased if it is trapped in a vacancy. More generally, the lifetime of positrons reflects the electron density in places where positrons are annihilated. From the increase in the mean lifetime, a vacancy concentration of 3.3(1.1) × 1014 cm−3 could be derived for the AVO28 crystal.
In particular, carbon atoms can create lattice strains, the so-called striations [36], which can be made visible by x-ray topography measurements. Fujimoto et al [37] used a special self-referenced lattice comparator which can detect 2D lattice spacing inhomogeneities with a relative standard uncertainty of only 3 × 10⁻⁹. No significant inhomogeneity has been found for the AVO28 crystal [38].
In a real crystal, lattice spacing and density are affected by impurity atoms and vacancies. For example, interstitial oxygen expands the lattice spacing and increases the unit cell mass, and substitutional carbon shrinks the lattice spacing and decreases the unit cell mass. When the effect of these point defects on the crystal density is considered, the simplest way to take this into account is to calculate the core mass of an equivalent sphere with the same core volume and lattice parameter, but having Si atoms at all regular sites. This introduces a difference between the mass of the sphere having Si atoms occupying all regular sites and the measured mass value of the real sphere. The mass difference [20, 21] is given by

In equation (15), m28 and mx are the masses of a 28Si atom and the point defect referred to as x, respectively. For a vacancy, mx = mV = 0. Oxygen is associated with an interstitial lattice site, so that mO is the sum of the masses of oxygen and 28Si atoms. The same applies to nitrogen impurities, whereas carbon and boron substitute silicon in the lattice. Nx is the concentration of the point defect x. Table 3 lists the values for the two existing 28Si-enriched spheres AVO28-S5 and AVO28-S8. This example shows that the influence of point defects is of the relative order of 1 × 10⁻⁸ and can be taken into account without significantly increasing the total uncertainty of the Avogadro constant.
Table 3. Mass difference mdeficit in AVO28-S5 and AVO28-S8 spheres [20, 21].
| Defect | AVO28-S5 (µg) | AVO28-S8 (µg) |
|---|---|---|
| Carbon | 4.6(6) | 22.0(2.2) |
| Oxygen | −3.2(7) | −4.8(1.1) |
| Nitrogen | −0.2(1) | −1.4(3) |
| Boron | 0.1(1) | 0.4(2) |
| Metals | −4.0(3.0) | 0.0(1.0) |
| Vacancy | 6.6(2.2) | 6.6(2.2) |
| Total | 3.8(3.8) | 22.7(3.5) |
Note: AVO28-S5 contains a small amount of metals (Ni, Cu, Zn), which originally contaminated the surface and diffused into the sphere during thermal oxidation [21].
5. Lattice parameter measurement
The lattice spacing of silicon has been measured using technologies developed for x-ray and optical interferometry. From this spacing, the lattice constant a and the unit cell volume a3 are obtained by using simple geometrical relationships.
Figure 6 shows an x-ray interferometer consisting of three Si crystal blades, that are cut so that the {2 2 0} planes are orthogonal to the blade faces. X-rays, e.g. from a conventional 17 keV Mo Kα source, are split by the first blade and recombined by a transmission crystal (the third blade), which is called 'analyser'. When the analyser, which is the movable crystal of the interferometer, is displaced with respect to the two fixed blades in a direction orthogonal to the {2 2 0} planes, a periodic intensity variation of the transmitted and diffracted x-rays is observed. The period is the sought diffracting-plane spacing. X-rays are imaged onto a multianode photomultiplier tube through a pile of eight NaI (Tl) scintillator crystals. The displacement of the analyser is measured via optical interferometry, so that the lattice spacing is determined by comparing the unknown period of the x-ray fringes with the known period of the optical fringes.

Figure 6. Schematic drawing of a combined x-ray and optical interferometer.
Download figure:
Standard image High-resolution imageThe spacing of the {2 2 0} planes is measured as d220 = mλ/(2n), where d220 ≈ 192 pm is the sought spacing, and n is the number of x-ray fringes observed for a displacement of m optical fringes having a period of λ/2. In practice, x-ray fringe fractions are measured at the ends of the analyser displacement increases. To measure the x-ray fringe fraction, the least-squares method is applied; a typical amount of input data is about 300 samples in six fringes. Since there is a drift between x-ray and optical interferometer measurements, the analyser is repeatedly moved back and forth along any given displacement, and the interferometer signals are sampled at each end of the displacement. In such a way, the drift (or more precisely, its linear component) is eliminated by demodulating the measured fringe fractions.
Operating a separate-crystal interferometer is a formidable task: the fixed and movable crystals must be faced so as to allow their atoms to recover their exact positions in the initial single crystal, and they must be kept aligned notwithstanding vibrations and displacements. The first monolithic x-ray interferometer was realized and operated by Bonse and Hart [4] in 1965, who paved the way for the determination of the Avogadro constant by counting the atoms in a silicon crystal. Deslattes et al [5] operated a separate-crystal interferometer, where the third blade is separated from the first two, making it possible to increase the displacement of the third blade over a few micrometers. They completed the first d220 and NA measurements. However, when viewed in hindsight, their results [6] exhibited a systematic relative difference of 1.8 × 10⁻⁶ in d220 and 5.4 × 10⁻⁶ in NA. Soon after their measurement, PTB, the Istituto Nazionale di Ricerca Metrologica (INRIM, Italy, formerly the Istituto di Metrologia 'G. Colonnetti': IMGC), and the National Metrology Institute of Japan (NMIJ, Japan, formerly the National Research Laboratory of Metrology: NRLM) also undertook lattice parameter measurements. The historical evolution of the relative uncertainty in lattice parameter measurement is shown in figure 7.
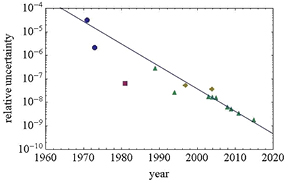
Figure 7. Relative uncertainty in lattice parameter measurement. Measurements were carried out by NIST (blue circles), PTB (purple square), NMIJ (yellow diamonds), and INRIM (green triangles).
Download figure:
Standard image High-resolution imageA longer displacement of the analyser is a prerequisite for improving the uncertainty in measuring d220. Since the work of Deslattes, interferometer displacement has been performed by means of elastic guides, which allow high-precision movement, but limit the maximum displacement to a few millimetres. In order to overcome this difficulty, INRIM developed a system to control the position and alignment of the interferometer crystals at a sub-atomic accuracy level [39], making a significant breakthrough in scanning x-ray interferometry by extending the analyser displacement up to 50 mm. As shown in figure 8, this is achieved by an L-shaped carriage sliding over a quasi-optical rail. A tripod with three piezoelectric legs rests on the carriage and supports the analyser. Each leg expands vertically and shears in two transverse directions, thus allowing compensation for the sliding errors and electronic positioning over six degrees of freedom to atomic-scale precision.
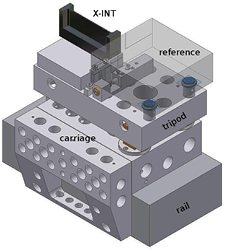
Figure 8. A system for controlling the position and alignment of interferometer crystals at a sub-atomic accuracy level. An active tripod is positioned on top of the L-shaped carriage, electronically controlled to compensate for sliding errors. The tripod supports the analyser (X-INT) and the reference electrode of a capacitive transducer. The analyser front surface is the movable mirror of the optical interferometer.
Download figure:
Standard image High-resolution imageThe tripod displacement and rotations (pitch and yaw) are measured with picometre and nanoradian accuracies by an optical interferometer which uses polarization encoding and phase modulation. Rotations are measured by detecting the differences between the displacements observed in four points of the interference pattern. Feedback loops ensure picometre-exact positioning and nanoradian-exact alignment of the x-ray interferometer. To eliminate the adverse influence of the ground vibrations, refractive index of air, and temperature, the apparatus is hosted in a thermo-vacuum chamber, which rests on a 4000 kg inertial mass and whose temperature is controlled with millikelvin-exact stability and uniformity. In order to ensure traceability to the definition of the metre, the frequency of the laser source is locked to a transition of the 127I2 molecule.
An optical parallelepiped having three mutually orthogonal faces sits on the tripod; capacitive transducers sense its transverse displacements and roll with sub-nanometre sensitivity, while feedback loops provide the straightness of the motion. This trihedron fixes the reference frame for the alignment of the x-ray interferometer, which is mounted in such a way that the diffracting planes and the front mirror, which are parallel within microradians, are orthogonal to the sensed parallelepiped faces and, consequently, to the analyser trajectory.
The first d220 measurements of the 28Si-enriched crystal using this system were carried out in 2010 [40]. The measurements were repeated in 2014 using an improved system [41]. The two values at 22.500 °C (ITS-90) and 0 Pa without correction for impurities are

and

respectively. The correlation between the two results was investigated to assess consistency [22]. Apart from the interferometer reassembly and a number of upgrades, the main novelty of the 2014 measurements was the use of a new optical interferometer. All previous measurements relied on the same optical interferometer. In order to exclude undetected systematic effects, the 633 nm diode laser used previously was replaced with a new 532 nm frequency-doubled Nd:YAG laser. Consequently, all the optical interferometer components were replaced and assembled anew. The laser beam was delivered by a new fibre and better collimated, thus halving the correction for diffraction effects. A new plate beam-splitter was manufactured to ensure that the difference of the transmitted and reflected light paths is insensitive to the beam translations and rotations. The consistency of the d220 values measured in 2010 and 2014 supports the absence of serious systematic uncertainties; however, picometre laser interferometry is still one of the most critical aspects of lattice parameter measurement and deserves further investigations.
The measurement of NA needs the mean lattice parameter values of the two spheres carved from the 28Si-enriched crystal. Since contaminants strain the crystal lattice, a contamination gradient along the crystal axis makes the lattice parameters of the two spheres different from that of the x-ray interferometer. There is a consensus that the contaminant concentrations, except carbon, oxygen, boron, and nitrogen, are significantly less than one atom in 109 Si atoms. To verify this assertion, INRIM checked the crystal purity by neutron activation [33–35]. Measurements were carried out at the TRIGA Mark II reactor at the University of Pavia and the OPAL reactor of the Australian Nuclear Science and Technology Organisation; they included 59 elements and excluded contaminations higher than 1 ng g−1 for 35 elements. Therefore, the lattice parameters of AVO28-S5 and AVO28-S8 spheres were obtained by extrapolation of the interferometer value accounting for the difference of carbon (C), oxygen (O), boron (B), and nitrogen (N) concentrations [42], which PTB surveyed by infrared spectroscopy [32].
The measurement of NA also assumes that the Si spheres, apart from the strain due to different contaminants, have the same lattice parameter as the x-ray interferometer. However, this might not be the case, due to stresses caused by surface relaxation and reconstruction, and the presence of amorphous or oxide layers. For spheres having 94 mm diameter, the change in the lattice parameter due to surface stress is irrelevant. However, the surface might strain the x-ray interferometer blades, which are only 1 mm thick. Although available literature data on these properties are uncertain, they suggest a small stress, which has not been taken into consideration in evaluating the uncertainty budget. For example, density functional calculations carried out by the University of Cagliari for a (1 1 0) blade surface covered by an amorphous SiO2 layer of 1 nm thickness indicate that the surface effect might be larger than expected. Given the experimental difficulties of measuring surface stress and the fact that it is influenced by the geometry, physics, and chemistry of the surface, INRIM and PTB designed a two-thickness x-ray interferometer, where the surface stress produces different d220 values for the thick and thin parts of a single blade. The x-ray interferometer was manufactured by PTB and is being integrated into the measurement apparatus at INRIM.
6. Molar mass measurement
The molar mass M of silicon can be deduced from its dependence
on the respective molar masses of the silicon isotopes M(iSi) [43] and the amount-of-substance fractions x(iSi). The latter are determined by measuring the respective isotope ratios
To obtain a relative standard uncertainty of urel(NA) < 2 × 10⁻⁸, a sufficiently small relative uncertainty of M lower than urel(M) = 1 × 10⁻⁸ is required. The ratios x(iSi)/x(28Si) have an uncertainty too large to fulfil this condition. Therefore, a modified isotope dilution mass spectrometric (IDMS) technique has been developed to overcome this problem [18, 44, 45]. The IDMS technique is based on the introduction of a 'virtual element' (VE), treating silicon as a matrix containing the VE (29Si and 30Si). In the VE-IDMS, only the isotope ratios R30,29 = x(30Si)/x(29Si) have to be measured, giving uncertainties urel(R30,29) < 1%, sufficient for urel(M) = 1 × 10⁻⁸. Experimentally, the VE-IDMS approach is performed using high resolution multicollector inductively coupled mass spectrometry (MC-ICP-MS). The R30,29 = x(30Si)/x(29Si) have to be measured in the silicon sample (x) enriched in 28Si and in a blend (bx) of the sample material and a spike material (y) enriched in 30Si (see figure 9). In practise, the molar mass M obtained from VE-IDMS measurements is not calculated with equations (18) and (19) because of the rather complex correlation of the amount-of-substance fractions x(iSi), but rather using a single equation yielding M without any correlated intermediate results like x(iSi) [46] (meaning of symbols see below and figure 10):

Figure 9. VE-IDMS principle: the VE consists of the 29Si and 30Si isotopes (dashed frame). The isotope ratios R = x(30Si)/x(29Si) are measured in the sample, blend, and spike, yielding the mass fraction w(VE) = w(29Si) + w(30Si), that in turn yields all x(iSi) and M.
Download figure:
Standard image High-resolution image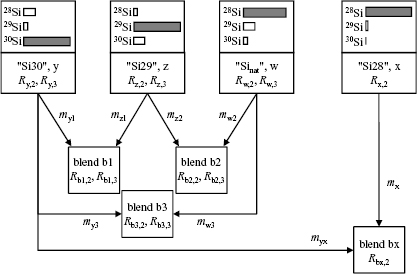
Figure 10. Schematic diagram indicating the preparation of blends b1, b2, and b3 for the determination of K factors originating from the starting materials y, z, and w. The sample x and the IDMS blend bx are also displayed together with all relevant quantities to be measured.
Download figure:
Standard image High-resolution imageAfter the revision of the SI, M(iSi) in equation (20) are substituted by Ar(iSi)Mu, and dividing both sides of the resulting equation by Mu yields the following equation:
In the revised SI, this equation (which describes the determination of the quantity M/Mu = Σix(iSi)Ar(iSi) is used in conjunction with equation (11) to determine the mass of the silicon sphere.
The VE-IDMS method has been successfully applied by several other national metrology institutes (NMIs): the National Research Council (NRC, Canada) [47], NMIJ [48], the National Institute of Standards and Technology (NIST, USA) [49], and the National Institute of Metrology (NIM, People's Republic of China) [50].
ICP-MS isotope ratio measurements are accompanied by mass discrimination. To correct for this, a closed-form mathematical design has been developed to determine the calibration (K) factors used to convert the measured isotope ratios  into the 'true'ones directly during the experiment [51].
Two blends are necessary to measure Rj(30Si/29Si) = Rj,2 and Rj(28Si/29Si) = Rj,3, as shown in figure 10. One blend (b2) consists of a mixture of silicon with natural isotopic composition (material w) and silicon highly enriched in the 29Si isotope "Si29"(material z). Another blend (b1) consists of a mixture of "Si29" and "Si30"(material y). A third possible blend is prepared using materials y and w (blend b3). The set of two K-factors is chosen from an over-determined system of 12 possible K-factor pairs [45, 46, 52]. The selection of the K2/K3 pair is based on an uncertainty analysis where all the results using data from all three blends were calculated. The best results were obtained when blends b1 (materials: z and y; measured ratio: Rb1,2 = Ib1(30Si)/Ib1(29Si)) and b2 (materials: z and w; measured ratio: Rb2,3 = Ib2(28Si)/Ib2(29Si)) were used to determine the K factors (K2 and K3) [52]. Using these methodological tools, the way for the determination of M with urel(M) < 5 × 10⁻⁹ was cleared.
The experimental details are given elsewhere [44, 52, 53]. The samples of the first enriched Avogadro crystal (Si28-10Pr11) were cut in the vicinity of the two spheres ('AVO28-S5' and 'AVO28-S8'). A 'homogeneity' study concerning local variations of the molar mass has been carried out on 14 samples of the Si28-10Pr11 crystal originating from three different axial positions of parts 4, 7 and 9 [52]. For each of these three positions, four or five adjacent samples were cut from a crystal bar in order to get information about the effects of the radial position. Most of the crystal samples from the 'kilogram-2' project, further enriched in 28Si, were obtained during the production steps for validating proper enrichment. Recently, first samples of the first crystal (Si28-23Pr11) of the 'kilogram-2' project were measured, also with the intention of obtaining information on the distribution of M in the crystal. After exact weighing, the cleaned and etched samples were dissolved in aqueous tetramethylammonium hydroxide (TMAH) [49]. This solvent has several advantages compared to aqueous sodium hydroxide used in initial studies [54]. The main advantage of using TMAH is the strong increase in signal intensity due to the absence of sodium, which acts as a sink for ionization efficiency. In fact, this is especially important for the detection of the extremely low-abundant 30Si. The solutions were then further diluted to mass fractions of w(TMAH) = 0.0006 g g−1, ready for measurement with MC-ICP-MS.
The isotope ratio measurements were conducted in high mass resolution (HR) mode using an MC-ICP-MS Neptune™ instrument (Thermo Fisher Scientific GmbH, Bremen, Germany) with a modified sapphire torch and several parts almost free of natural silicon (e.g. perfluoroalkoxy alkane (PFA) spray chamber). Typical machine parameters are reported in [52]. In a 'K-factor sequence', the calibration (K) factors were determined using samples of the materials WASO04, "Si29", "Si30", and the blends b1, b2, and b3, together with a blank (w(TMAH) = 0.0006 g g−1) in order to determine the respective 'true' isotope ratios. Subsequently, a solution of the WASO04 natural material (w) could be used as a 'transfer' calibrant for the 'IDMS sequence', where only the Rj,2 = Ij(30Si)/Ij(29Si) of the sample (x) and IDMS blend (bx) were measured. Carry-over effects and contamination with natural silicon can be reduced and corrected for, since each sample (x, y, w) measurement was bracketed by blank measurements. This is one of the key advantages of the MC-ICP-MS technique using liquid samples. Contaminations due to natural silicon are detected and subtracted from the samples using matrix-matched blank solutions.
The latest molar mass determined using the first enriched crystal Si28-10Pr11 and published by the International Avogadro Coordination (IAC) was M = 27.976 970 09(15) g mol−1 [21]. This was a joint result obtained by NMIs using the improved VE-IDMS method and TMAH solvent to probe several crystal samples in the vicinity of the spheres AVO28-S5 and AVO28-S8. As mentioned above, a comprehensive homogeneity study has been conducted at PTB with the aim of investigating possible variations in the molar mass and the amount-of-substance fractions x(iSi) as a function of sample position in the crystal [52]. Figure 11 displays the variations of x(28Si) in the crystal, clearly indicating a homogeneous distribution of this isotope throughout the crystal within the limits of uncertainty. The same result was obtained for M and x(29Si). For x(30Si), small variations could be observed [52]. However, the presence of inhomogeneities with respect to x(30Si) in the crystal cannot be proven at this stage. In summary, the measured values of M used for the determination of NA show a clear homogeneous distribution in the crystal, covered by the limits of uncertainty, and are therefore highly reliable. Table 4 lists the molar mass values and the corresponding amount-of-substance fractions of the AVO28 crystal (Si28-10Pr11) performed by different NMIs during the last years.
Table 4. Molar mass and amount-of-substance fractions determined for the AVO28 crystal (Si28-10Pr11) during the last years by applying the VE-IDMS-principle using MC-ICP-MS [21].
| NMI | M (g mol−1) | x(28Si) (mol mol−1) | x(29Si) (mol mol−1) | x(30Si) (mol mol−1) | Solvent | Ref. |
|---|---|---|---|---|---|---|
| PTB 2011 | 27.976 970 27(23) | 0.999 957 50(17) | 0.000 041 21(15) | 0.000 001 29(4) | NaOH | [21] |
| NRC 2012 | 27.976 968 39(24) | 0.999 958 79(19) | 0.000 040 54(14) | 0.000 000 67(6) | NaOH | [47] |
| NMIJ 2014 |
27.976 970 09(14) | 0.999 957 64(3) | 0.000 041 14(7) | 0.000 001 22(4) | TMAH | [48] |
| NIST 2014 | 27.976 969 880(41) | 0.999 957 701(41) | 0.000 041 223(41) | 0.000 001 076(88) | TMAH | [49] |
| PTB 2015 | 27.976 970 12(12) | 0.999 957 52(12) | 0.000 041 36(11) | 0.000 001 121(14) | TMAH | [52] |
aThe values of the amount-of-substance fractions x(iSi) for NMIJ 2014 given in this table are slightly different from those given table 8 of [48] because the values obtained from selected measurements are given in [48] as examples, and they do not represent averages of all x(iSi) measurements. This table therefore carries the averages of all x(iSi) measurements. Note: Numbers in parentheses denote the uncertainties (k = 1) of the last digits.
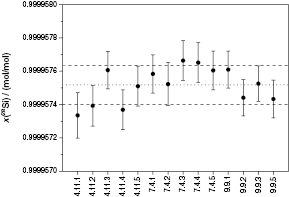
Figure 11. Distribution of x(28Si) as a function of the origin in the initial crystal ingot Si28-10Pr11 (parts 4, 7, and 9). Error bars denote standard uncertainties u(x(28Si)) with k = 1. The dotted line displays the average value of x(28Si), whereas the dashed lines denote the upper and lower limits of u(x(28Si)).
Download figure:
Standard image High-resolution imageIn 2012, PTB initiated the 'kilogram-2 project' in collaboration with Russian companies and institutes to produce several even higher 28Si-enriched crystals (x(28Si) > 0.999 98 mol mol−1). Three crystal batches were produced (denoted Si28-22, Si28-23, and Si28-24); the first for test purposes, the other two for the production of four additional spheres. First results of the molar mass determination and isotopic composition of these new higher-enriched silicon crystals (polycrystals and single crystals) were obtained, with x(28Si) ranging from 0.999 984 mol mol−1 to 0.999 994 mol mol−1, accompanied by a reduction of urel(M) with increasing enrichment. The consequence of increased enrichment, compared to the first enriched 'Avogadro' crystal, is the reduced sum of x(29Si) and x(30Si) in the new crystals. This might hamper the detection of these isotopes (x(29Si) ≈ 5 × 10⁻⁶ mol mol−1 and x(30Si) ≈ 4 × 10⁻⁷ mol mol−1). The recent results for the 'kilogram-2' crystals nevertheless show that 29Si and 30Si can be determined at least as accurately or even better than in the case of the first AVO28 crystal. The molar masses of three adjacent crystals of the first 'kilogram-2' crystal (Si28-23Pr11, parts N.2.2–N.2.4) have been measured (see figure 12). An average molar mass M = 27.976 942 721(48) g mol−1 was determined with urel(M) = 1.7 × 10⁻⁹. The uncertainty of M is mainly influenced by the measurement of Rx and Rbx. The mass determinations, important for the preparations of IDMS blends, no longer have any influence on the uncertainty of M.
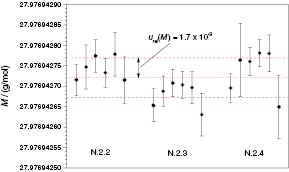
Figure 12. Distribution of M in three different samples (parts N.2.2–N.2.4) of the first final 'kilogram-2' single crystal Si28-23Pr11. Six measured sequences are displayed for each sample. Error bars denote standard uncertainties u(M) with k = 1. The dotted line represents the average value of M, and the dashed lines depict the corresponding upper and lower uncertainties.
Download figure:
Standard image High-resolution imageA milestone in the 'Avogadro'-project was delivered by the analysis results for the crystal of the third batch (Si28-24Pr7, see table 5): for the first time, the molar mass has been determined with urel(M) < 1 × 10⁻⁹ for silicon highly enriched in 28Si (in that measurement series, in a single case, urel(M) = 5 × 10⁻¹⁰ was observed). This extremely low uncertainty is directly related to the extreme enrichment of that material: x(28Si) = 0.999 994 751(20).
Table 5. Molar mass and amount-of-substance fractions determined at PTB for the first and second 'kilogram-2' crystals (Si28-23Pr11 and Si28-24Pr7) compared to the AVO28 crystal (Si28-10Pr11).
| Crystal | M (g mol−1) | x(28Si) (mol mol−1) | x(29Si) (mol mol−1) | x(30Si) (mol mol−1) | Ref. |
|---|---|---|---|---|---|
| Si28-10Pr11 | 27.976 970 12(12) | 0.999 957 52(12) | 0.000 041 36(11) | 0.000 001 121(14) | [52] |
| Si28-23Pr11 | 27.976 942 721(48) | 0.999 984 416(46) | 0.000 014 973(45) | 0.000 000 6104(62) | (This paper) |
| Si28-24Pr7 | 27.976 932 214(27) | 0.999 994 751(20) | 0.000 004 815(16) | 0.000 000 434(09) | (This paper) |
Note: Numbers in parentheses denote the uncertainties (k = 1) of the last digits.
Figure 13 shows the dependence of urel(M) on x(28Si). The relative uncertainty decreases with increasing x(28Si), proving the success of the 'kilogram-2' project, the target of which was a silicon crystal material with further reduced uncertainties. Additionally, M of natural isotopic composition (WASO), measured at the Institute for Reference Materials and Measurement (EC-JRC-IRMM, Belgium) using isotope-ratio mass spectrometry (IRMS) is shown for comparison [55]. In one decade, urel(M) was reduced by almost three orders of magnitude.
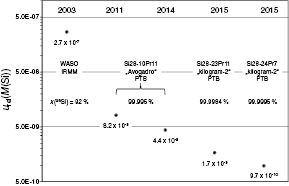
Figure 13. Reduction of the uncertainty associated with the molar mass of silicon highly enriched in 28Si. For comparison, M of the natural isotopic composition is plotted, measured at IRMM [55].
Download figure:
Standard image High-resolution imageIn conclusion, the decreasing uncertainty associated with M is a result of both improved material properties (increased x(28Si)) and further improved capabilities of the molar mass measurement, required to measure the extremely weak signals of 29Si and 30Si. In the near future, homogeneity measurements and comparisons, organized within the framework of the Consultative Committee for Amount of Substance (CCQM), are also scheduled using these enriched materials. With these new silicon crystals, the molar mass will have a further reduced contribution to the uncertainty of NA.
7. Surface evaluation for silicon spheres
As introduced in section 2, corrections regarding the surface layers (SL) have to be applied for the determination of the core volume Vcore, and the mass of the silicon sphere is deduced using the mass of the surface layers. Consequently, information on thickness dSL and mass mSL of the surface layers is required to realize the kilogram. In this section, an outline of analysis techniques used to characterize the surface layers and the procedure to determine mSL are described.
In order to design an appropriate measurement strategy, it is necessary to consider the influence of mass and thickness of the surface layers on the overall uncertainty of the silicon sphere mass. The importance for the mass correction is straightforward, since the surface layer is creating a mass additional to the core mass mcore, giving the mass of the silicon sphere as

For the volume determination, the influence of the surface layer is a little bit more complicated. Details on the influence of surface layers on the determination of Vcore are given in section 8.4. To understand this approach, it should be noted that the influence of layer thickness on the uncertainty of realized mass is more than one order of magnitude smaller than that of mSL. Hence, the focus should be on reducing the uncertainty for determining mSL. Fulfilling this requirement would also satisfy the target uncertainty for the layer thickness.
An additional question to be addressed is whether the surface layers (namely the oxide layer) are stable and when the stability of the oxide layer is sufficient to carry out all measurements required for realizing the kilogram. The concept described here can also be used as the basis for monitoring the mass change of silicon spheres due to surface evolution during use and storage.
7.1. Surface layer model
To characterize the sphere surface, an appropriate model of the surface is required, being a prerequisite for selecting appropriate measurement techniques. In order to set up a first draft of the layer model, the following facts have to be noted: the silicon will be oxidized. A carbonaceous contamination and water are expected to be present on the silicon surface, since none of the experiments used for the realization was performed under the vacuum (10−8 Pa) required to avoid any adsorption of water or hydrocarbon molecules from the surroundings. All experiments were carried out in ambient or low-vacuum conditions.
All other types of elements or molecules on the sphere surface can be avoided by appropriate processing and handling during manufacture and measurement. Consequently, all elements except for silicon, oxygen, carbon, and hydrogen are contaminations and can be removed from the surface. In the 2011 determination of NA, a metal silicide contamination was found on the spheres [19, 20], stemming from the manufacturing process. Meanwhile, a new manufacturing process was developed at PTB, and the silicide contamination is now eliminated [56].
The surface layer model shown in figure 14 is derived as a result of these considerations. In this model, a SiO2 layer (OL) covers the silicon core of the sphere. The following two surface layers are the carbonaceous contamination layer (CL) the water layer. The latter consists of chemically (CWL) and physically adsorbed water (PWL). The distinction between these two types is made using their specific adsorption energy. PWL is only present in ambient conditions and desorbs in high vacuum. The CWL remains even in high vacuum.
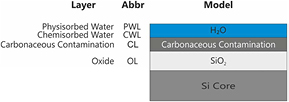
Figure 14. Surface layer model of the silicon spheres.
Download figure:
Standard image High-resolution imageFinally, the carbonaceous contamination layer is a stochastic mixture of different hydrocarbon molecules. The subdivision of the surface layers into CWL, PWL, and CL is an approximation of the real surface structure. The amount of material in these layers is approximately equivalent to a monolayer or less. Furthermore CL and CWL/PWL form a kind of intermix layer.
Surface characterization is therefore divided into two parts. The first part is a screening measurement, carried out after the manufacture of the spheres. In these measurements, the absence of all chemical elements (except Si, O, C, and H) on the surface is checked. In practice, XRF analysis is used to check that all elements are below the detection limit of the XRF instrumentation [56]. The second part of surface characterization is the quantitative determination of the mass and thickness of the surface layer on the silicon spheres. For this, a set of different surface analysis methods is used. The principles of the different methods and their application are explained in the next section.
In order to achieve the best measurement results for the silicon sphere, cleaning the surface is mandatory before each measurement. The recommended cleaning of the sphere follows two principles: no modification should be applied to the sphere, and the presence of substances other than Si should be reduced to the lowest achievable amount.
7.2. Methods of surface characterization
To determine the mass and average thickness of the surface layers (SL), NMIJ and PTB use different approaches [16]. Table 6 gives an overview of the methods applied. Both parameters must be measured with the smallest possible uncertainty, therefore requiring high accuracy.
Table 6. Overview of the different methods used for surface layer characterization of silicon spheres.
| Method | Measure | Screening | Quantitative | Primary | Accuracy | Precision | Speed |
|---|---|---|---|---|---|---|---|
| SE | Thickness | No | Yes | No | Medium | High | High |
| XRR | Thickness | No | Yes | Yes | High | High | Low |
| XRF | Area mass | Yes | Yes | (Yes) | High | High | Medium |
| XPS | Area mass | Yes | No | No | Low | Low | Medium |
| Gravimetric | Mass | No | Yes | Yes | High | High | Slow |
SE: spectroscopic ellipsometry, XRR: x-ray reflectometry, XRF: x-ray fluorescence analysis, XPS: x-ray photoelectron spectroscopy.
The oxide covering the silicon sphere is not completely equivalent to the oxide of the silicon wafer, since oxide growth depends on the crystallographic orientation of substrate. For silicon spheres, the orientation is surface-variable, and all main orientations such as (1 0 0), (1 1 0), or (1 1 1) are present. Hence, a topographic inspection of the whole surface is required to cover local variations of the OL. The best method for this task is SE, which is very fast (single measurement within seconds) and precise (on a picometre level). Unfortunately, its accuracy (one nanometre or less) is not sufficient, and therefore a calibration of SE by other methods is required.
At NMIJ, calibration wafers certified by XRR and XPS are used. A simulation model is used for proper calibration of SE. PTB, on the other hand, uses calibration points directly on the spheres, with thickness values determined with a combination of XRF and XRR analysis at the synchrotron beam line of PTB at BESSY. With this approach, a simplified ellipsometric model can be utilized for data refinement.
As a prerequisite for measuring OL, the stoichiometric composition of the original oxide after the manufacture of the sphere has to be determined. This has been done with XPS measurements at the Federal Institute of Metrology of Switzerland (METAS, Switzerland). It has been proven that the OL corresponds to pure SiO2, and all other oxidation states of silicon (such as SiO and Si2O3) are below the detection limit of the instrument [16].
These methods are briefly outlined below, where a short description of the physical mechanism and some application details with respect to sphere characterization are presented.
7.2.1. Spectroscopic ellipsometry (SE).
This technique is widely used to measure the thickness of a thin oxide layer on Si substrate, since the measurement time is very short and the reproducibility is very high. SE is therefore used for rapid topographical measurements of the SiO2 layer thickness on Si spheres [16, 21, 57]. The physical basis of SE is the measurement of the change in the polarization of a light beam after reflection from the sample surface. In the ellipsometry theory, the complex ratio ρ of the reflected light beam is described by

where rp and rs are the reflection coefficients of the p- and s-polarization of the reflected light beam. The ratio ρ is measured to determine the ellipsometric parameters ψ and Δ. These parameters are measured over a large wavelength range and are fitted by a multilayer model. If the structure of the multilayers is identified and the optical constants are available, the thickness of the layer can be determined. Details of the SE theory are found in textbooks [58–60].
To ensure traceability of the thickness measurement to SI, a calibration of the ellipsometric measurement process must be carried out [21]. The measurements on the silicon sphere are carried out in ambient conditions. Due to the fast SE measurement speed, a complete mapping of the sphere surface with approximately 2500 data points can be finished within 24 h.
7.2.2. X-ray reflectometry (XRR).
XRR is a surface-sensitive analytical technique used in chemistry, physics, and materials science to characterize surfaces and multilayers. It measures the thickness of a single film or multilayer. An x-ray beam illuminates the sample at a small angle (<4°), and the incident beam is reflected from the surface and partly transmitted into the film, according to Fresnel's law. The transmitted part of the beam is also partly reflected at the internal interface. Finally, the two reflected parts interfere in the far field. By changing the x-ray incidence angle, an interference pattern is formed. If the thickness of the layer is above 5 nm, the film thickness is determined from the wavelength of the x-rays and the oscillation period of the interference pattern. By calibrating the x-ray wavelength and the incident angle, the traceability of the thickness measurement to SI is secured. This technique also has a high accuracy with a standard uncertainty of approximately 0.1 nm. The direct traceability to SI is the strongest advantage of XRR compared to other techniques. It is therefore used as a primary method, suitable for calibration of other methods like XRF, XPS, etc.
For direct application of XRR to silicon spheres, the use of synchrotron radiation is required to overcome the limitations due to the divergence of the reflected beam. In addition, changing the photon energy of the x-rays provides more reliable data evaluation, since it boosts the amplitude of the interference pattern. Consequently, this increases the accuracy of the measured angle for maxima and minima and finally leads to a smaller uncertainty. In the case of synchrotron radiation, measurements are carried out in vacuum (10−6 Pa). In commercial instruments, XRR measurements are conducted in ambient conditions.
7.2.3. X-ray photoelectron spectroscopy (XPS).
XPS is a surface-sensitive technique for identifying the chemical elements present on a surface. The typical analysis depth is limited to 10 nm. In addition, XPS also provides information on the chemical binding state of the elements and is therefore used to clarify the stoichiometry of the OL, validating that the OL on the silicon sphere is pure SiO2. XPS spectra are obtained by irradiating a sample with monochromatic x-rays. The electrons escaping from the sample and their residual kinetic energies are analysed by an electron spectrometer. The energies of the released electrons are characteristic for each element. Additionally, the energy of the photoelectrons may slightly change due to their specific binding states (chemical shift), making it possible to analyse the sample stoichiometry.
XPS has low detection limits for chemical elements. This fact, in combination with its surface sensitivity, makes XPS a convenient method for screening the spheres for contamination. The number of electrons detected in the electron spectrometer is strongly dependent on the take-off angle of the detector, which is related to the orientation of the crystal lattice of the sphere. Hence, for an accurate measurement, a so-called reference geometry must be established [61]. Currently, the reference geometry for direct measurements on the spheres cannot be established.
The high sensitivity of detecting chemical elements, i.e. the low detection limits and surface sensitivity, makes XPS a strong tool for contamination screening measurements. It also enables improving the accuracy of OL measurements, due to the high specific sensitivity for carbon (C). Currently, an integrated XPS/XRF instrument is in preparation for combined measurements on the silicon spheres [62].
At the Federal Institute of Metrology of Switzerland (METAS), an XPS system was used to characterize the surface of the Si spheres [16]. The results were used to validate a surface layer model (involving a metallic contamination layer) and to investigate the stoichiometry of the oxide layer. At NMIJ, an XPS system was used to determine the thickness of the oxide layer and the carbonaceous layer of a silicon sphere with 30 mm diameter [63].
7.2.4. X-ray fluorescence (XRF) analysis.
XRF analysis is an element-analytical method. The excitation of atoms is again achieved by x-rays (as for XPS), but now the emitted x-rays are detected and analysed. Information on the element chemical binding state is not available for this method. With XRF, it is possible to measure the amount of material or layer thickness with small uncertainties, if well-calibrated reference standards are available. Measurements of ultra-thin films (1 nm or below) are also possible. The measured quantity corresponds to surface density, i.e. the mass per unit area. In contrast to XPS, this method requires no specific reference geometry of the crystal lattice, which makes it well suited for quantitative measurements directly on the spheres.
At PTB, reference samples calibrated by XRR were used for the calibration, and an XRF system with synchrotron radiation was directly used to determine the thicknesses of SiO2 and CL for the SE calibration points described in section 7.2.1. The standard uncertainties of the thickness measurements were estimated to be 0.13 nm and 0.18 nm for SiO2 and CL, respectively [21]. Additionally, XRF measurements were used to screen the spheres for contaminations after production.
7.2.5. Gravimetry.
In this method, a sample is weighed in different environmental conditions using a balance. The mass of adsorbed gas (such as water vapour) on the sample surface can be evaluated. Mizushima measured the mass of chemisorbed water on Si wafers by using this method [64]. Adsorption isotherms of water vapour on the Si wafer surface, outgassed at a temperature of 500 °C, were measured, and the chemical adsorption coefficient was estimated to be 0.028 µg cm−2. From this value, the CWL mass for a 1 kg Si sphere was estimated to be 7.7 µg, leading to a CWL thickness estimate of 0.28 nm, assuming the density of CWL to be 1.0 g cm−3. The adsorption coefficient of chemisorbed water on a 1 kg Si sphere was directly measured at the Bureau International des Poids et Mesures (BIPM) to be 0.026 µg cm−2 [21], which is in good agreement with the result obtained by Mizushima.
The PWL mass can be measured by gravimetry. NMIJ determined the PWL mass of the two Si spheres by weighing them in nitrogen gas at a pressure of ~1200 Pa, and in water vapour at a pressure of ~1200 Pa [21]. The masses of PWL were 10.8 µg and 11.9 µg for AVO28-S5c and AVO28-S8c, respectively. The thicknesses of PWL were estimated to be 0.39 nm and 0.43 nm for AVO28-S5c and AVO28-S8c, respectively, assuming the density of PWL to be 1.0 g cm−3. General methods for evaluating the mass difference of the mass standards transferred between in air and in vacuum are given in [65].
The gravimetric method has a high accuracy, and is well suited to investigate the evolution of the surface layer with time. However, it does not evaluate the contribution of each surface layer, i.e. it does not distinguish whether the mass increase of a sphere is caused by the growth of the OL or by adsorption of material to the PWL or the CL. Hence, a special experimental setup is required, combining mass determination with surface analysis techniques as described previously. Investigations revealed that in the first few weeks after production the SL is growing fast and the stability of the spheres is not suitable for carrying out a complete measurement cycle [66]. After this initial period the stability is improved, allowing one to perform the complete measurement cycle.
7.3. Current status of surface characterization
At NMIJ, a spectroscopic ellipsometer was calibrated by using flat Si samples covered with thermal SiO2 layers of different thicknesses. These thicknesses were calibrated by XRR at NMIJ [16]. The ellipsometer at NMIJ [57] is equipped with a rotating polarizer, with spectral bandwidth ranging from 250 nm to 990 nm. Figure 15 shows the sphere rotation system, polarizer arm, and analyser arm of the ellipsometer. The sphere rotation system is integrated into the ellipsometer, automatically mapping the oxide layer thickness over the entire surface of the sphere. The ellipsometric measurement was performed at 2594 points, regularly distributed over the entire surface. Figure 16 shows a typical topography of the surface layer thickness measured by the ellipsometer.
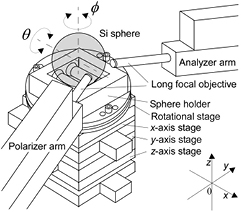
Figure 15. Schematic drawing of the automatic sphere rotation system integrated into the spectroscopic ellipsometer. The system consists of a sphere holder and a rotational stage. A Si sphere is placed on two rollers of the sphere holder. The rollers are made of polyether ether ketone (PEEK). Reproduced with permission from [57]. Copyright IEEE 2015.
Download figure:
Standard image High-resolution image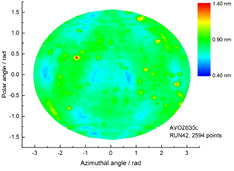
Figure 16. Topography of the oxide layer thickness of the 28Si-enriched sphere, AVO28-S5c, obtained by the ellipsometer at NMIJ and shown in the mollweide projection.
Download figure:
Standard image High-resolution imageFor the investigations at PTB, a spectroscopic ellipsometer of type GES-5E (Semilab) is used. This instrument has characteristic parameters comparable to the instrument described above. A PTB-produced sample holder is integrated in this instrument to enable automatic mapping of the entire sphere surface. Details of this ellipsometer are given in [16]. The instrument is located in the PTB clean room facility with a stabilized temperature of T = 20.0(0.1) °C and a relative humidity of approximately 50%.
The calibration of the PTB ellipsometer is based on the production of special calibration points directly on the Si sphere using a synchrotron-based combination of XRF and XRR [16]. The calibration points are then used for SE calibration during the mapping of the sphere surface (effectively an internal calibration), i.e. the calibration point is re-measured within 30 min. Consequently, only the short-term stability of the ellipsometer is contributing to the uncertainty, estimated to be 20 pm. This internal calibration also influences the setup of the simulation model for data refinement. In fact, it can be dramatically simplified, since the influence of the CWL and CL layers are already taken into account by a calibration constant. This approach assumes that the CWL and CL layers are homogeneously distributed on the surface. Using this method of internal calibration, the smallest uncertainty for average SL thickness and mass is currently achieved.
The ellipsometric mapping of the sphere shown in figure 17 utilizes ~16 000 points. The standard uncertainty of the oxide layer thickness measurement was estimated to be 0.13 nm [21].

Figure 17. Thickness topography of the 28Si-enriched sphere, AVO28-S8c, measured with the ellipsometer at PTB.
Download figure:
Standard image High-resolution imageThe reference data of the calibration points are determined with a combined XRR/XRF measurement at the synchrotron radiation laboratory of PTB at BESSY II [67]. Besides the OL thickness, the XRF data are used to determine the CL mass. The methodology of the calibration measurements is described in [21]. For the XRR measurements, photons with an energy of 529 eV are used. In the SL calculation, only the CWL has to be taken into account, since the PWL is desorbed in the reflectometer vacuum chamber. The CWL influence on the measured OL thickness is corrected using the data published for chemisorbed water [64].
Characterization of the CL layer was performed at the synchrotron beam line using XRF. The chemical structure of the carbonaceous contamination is highly unpredictable and has stochastic behaviour. Furthermore, the exact chemical composition of the CL, being present on the spheres, is not easily measurable by XRF. Therefore, only a rough estimation of the CL using the XRF data for carbon is available, allocating a large uncertainty to this value. The derived CL thickness is required for NMIJ ellipsometric measurements as input data for the surface layer model and is used for the volume determination.
The mass of the surface layers, mSL, is calculated by summing the mass of each layer, directly measured by XRF and gravimetry. On the other hand, XRR, XPS, and SE measure the thickness of the layer. The mass is therefore deduced from the assumed density of the layer. Based on the surface model described in figure 14, mSL is given by

where mOL, mCWL, mPWL, and mCL are the masses of the OL, CWL, PWL, and CL, respectively. When mSL is used to realize the sphere mass under vacuum, the physisorbed water layer is not taken into account.
Azuma et al [21] determined mSL under vacuum to be 77.7 µg for AVO28-S5c and 85.5 µg for AVO-S8c. By adding mSL to the core mass mcore, the mass of the sphere under vacuum can be derived (msphere). Tables 7 and 8 summarize the values for the 28Si spheres 'AVO28-S5c' and 'AVO28-S8c' [21]. These measurements are not independent determinations at all, since some values (CL and CWL) from the same measurements are used in both determinations. Table 7 demonstrates two ways for the calibrating the spectroscopic ellipsometers, one using internal calibration and the other using external calibration artefacts.
Table 7. Thickness of the surface layers and its constituent sub-layer components, dCL, dCWL, dPWL, and dOL.
| Sphere | Lab. | dCL (nm) |
dCWL (nm) |
dPWL (nm) |
dOL (nm) | dSL (nm) |
|---|---|---|---|---|---|---|
| AVO28-S5c | PTB | 0.60(18) | 0.28(8) | — | 0.91(14) | 1.79(24) |
| NMIJ | 0.60(18) | 0.28(8) | 0.39(9) | 0.76(27) | 1.64(33) | |
| Average | 0.60(18) | 0.28(8) | 0.88(12) | 1.76(23) | ||
| AVO28-S8c | PTB | 0.49(16) | 0.28(8) | — | 1.17(13) | 1.94(22) |
| NMIJ | 0.49(16) | 0.28(8) | 0.43(9) | 0.64(25) | 1.41(31) | |
| Average | 0.49(16) | 0.28(8) | 1.06(22) |
1.83(28) |
aThe CL thickness measured by XRF at PTB was based on the assumption that the density of CL is 1.1 g cm−3. The uncertainty of this thickness was estimated using the results of surface analysis from the previous measurement [20]. bCalculated from data reported by Mizushima [64]. cThe data for dPWL came from comparison of weighing results of the two spheres in nitrogen gas (at a pressure of ~1200 Pa) and in water vapour (at a pressure of ~1200 Pa) [21]. The density of PWL was assumed to be 1.0 g cm−3. dThis value does not include the thickness of PWL. eThe Birge ratio of the oxide layer thickness values for AVO28-S8c is 1.8. Therefore, the uncertainty of the weighted mean was multiplied by 1.8. A possible reason for the difference in the oxide layer determinations may be that NMIJ used the CL thickness value of PTB, while the surface cleaning procedures were not identical at PTB and NMIJ. Note: See figure 14 for the key to subscript abbreviations.
Table 8. Mass of the surface layers and constituent sub-layers.
| Sphere | Lab. | mCL (µg) | mCWL (µg) | mPWL (µg) | mOL (µg) | mSL (µg) |
|---|---|---|---|---|---|---|
| AVO28-S5c | PTB | 16.6(5.7) | 7.7(2.2) | — | 55.2(8.9) | 79.5(10.9) |
| NMIJ | 16.6(5.7) | 7.7(2.2) | 10.8(2.5) | 46.1(16.5) | 70.4(17.7) | |
| Average | 16.6(5.7) | 7.7(2.2) | 53.4(7.7) | 77.7(10.0) | ||
| AVO28-S8c | PTB | 13.5(5.2) | 7.7(2.2) | — | 71.0(8.5) | 92.2(10.2) |
| NMIJ | 13.5(5.2) | 7.7(2.2) | 11.9(2.7) | 38.9(15.3) | 60.0(16.3) | |
| Average | 13.5(5.2) | 7.7(2.2) | 64.3(13.7) | 85.5(14.8) |
aThe mass of PWL was not included in mSL to deduce the mass of the sphere in vacuum. Note: See figure 14 for the key to subscript abbreviations.
7.4. Further developments
The dominant uncertainty sources in the determination of mSL are mOL and mCL. Analysis of the present uncertainty in surface characterization and estimation of further uncertainty reduction indicate that the carbonaceous contamination would be the defining parameter. Hence, improvement of the C content measurement would contribute to reducing the uncertainty in realizing the kilogram.
To reduce the contributions of these uncertainty sources, new surface analysis apparatuses are being developed at PTB and NMIJ. The new apparatus of PTB is based on XPS and XRF for direct measurements on the sphere. A sample holder with two rotational axes is implemented within the vacuum chamber to enable full mapping of the surface during measurement [62].
The new NMIJ instrument is based on XPS and equipped with a sphere rotation stage for 1 kg silicon spheres, in which the rotation of the sphere around the horizontal and the vertical axes can be realized for the mapping of the entire surface [68].
The OL is currently created in an uncontrolled process during the manufacturing of the spheres. To improve the quality of the oxide layer, an alternative process for the extension or replacement of the original oxide layer is investigated by PTB in cooperation with the Fraunhofer Institute IST. Alternatively, a defined deposition of SiO2 on silicon spheres is investigated. With this approach, the mass of the deposited layer can be directly measured by gravimetry, and this result can be compared with the values determined by the methods currently used.
8. Diameter and volume measurements
The core volume of the Si sphere is measured by optical interferometry. Several NMIs have developed interferometers to measure the sphere volume [69], in which the diameter is measured in many different directions. The volume is calculated from the measured mean diameter with high accuracy when the deviation from a perfect spherical shape is small. The effect of asphericity on the sphere volume measurement was examined by Johnson [70] and Mana [71]. When we consider an approximate sphere of 100 mm mean diameter with tetrahedral symmetry and a peak-to-peak radial deviation of 100 nm, the relative contribution of asphericity to the measured volume is 1 × 10⁻¹¹ [70–72]. At present, silicon spheres with an asphericity less than 100 nm can be polished at PTB [21] (see section 3.3).
Recent technological advances make it possible to measure the volume of silicon spheres with a relative uncertainty of about 2 × 10⁻⁸ [21]. In this section, two examples of interferometers enabling such high-accuracy volume measurements are introduced. The sphere is covered by the surface layers described in section 7, which cause a phase retardation of the reflected light beam. The diameter measured by the interferometer therefore provides information only on the 'apparent diameter', which is different from the 'core diameter' Dcore introduced in section 2. In order to deduce Dcore, the total phase retardation on reflection from the sphere surface, which includes the influence of multiple reflections in the surface layers, should be evaluated by surface measurements given in section 7. Details on the evaluation of Dcore are given in section 8.4.
8.1. Interferometer with spherical reference plates
The first example is a spherical interferometer developed at PTB [15]. Figure 18 shows the principle of diameter measurement using the spherical interferometer, where the sphere is placed in an etalon formed by two spherical reference surfaces. The measured quantities are the distances between the sphere surface and the reference surfaces, d1 and d2, and the length of the empty etalon D. The apparent diameter d of the sphere is then given by d = D − d1 − d2. The volume is calculated from the integral of spherical harmonics over the surface as the best representation of all measured diameters.
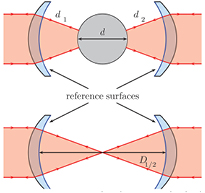
Figure 18. Principle of diameter measurement by the PTB spherical interferometer. The measurements of d1 and d2 and that of D are performed alternately. By rotating the sphere, the diameter topography of the entire sphere surface is available.
Download figure:
Standard image High-resolution imageFigure 19 shows the experimental setup of the PTB interferometer [73]. The sphere and the etalon are installed in a temperature-controlled vacuum chamber to eliminate the influences of the refractive index of air. The etalon is formed by the spherical reference surfaces of two Fizeau lenses. These lenses are adjustably mounted in a solid stainless-steel frame, with its centre defined by the sphere resting on a three-point support tightly fixed to the frame. The illuminating and imaging optics are symmetrically installed on both sides of the interferometer. The input collimators convert the divergent beam from a multimode fibre into plane waves. After entering the vacuum chamber, the plane waves are transformed into spherical waves by Fizeau lenses. On both sides of the interferometer, the beam reflected from the sphere surface and that from the reference surface are interfered, and the Fizeau fringes are observed by a CCD camera. Evaluation of the interference to determine the distances d1 and d2 is done by phase-shifting interferometry with wavelength tuning. The laser wavelength used can be varied so that the path difference of the interference observed changes by just one order. The laser system consists of a diode laser with an external cavity which is stabilized with respect to an I2-stabilized He–Ne laser via a frequency chain with a fast frequency offset lock [73].
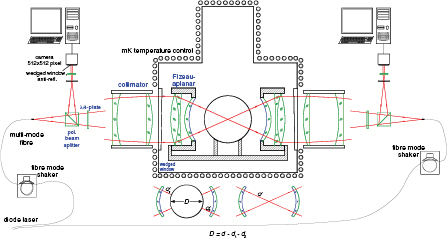
Figure 19. Experimental setup of the spherical interferometer with spherical reference plates, a vacuum chamber, and external collimators. The input and output beams are separated by polarizing optics.
Download figure:
Standard image High-resolution imageBelow the three-point support, a lifting and positioning mechanism for the sphere is placed. When the sphere is lifted into a position above the spherical etalon, a hole in the supporting cylinder allows the measurement of d. In this lifted position, the sphere can be rotated around horizontal and vertical axes.
This interferometer can measure about 10 000 diameters of the sphere simultaneously with an aperture angle of 60°. The result is a topography of the sphere, initially only within the aperture angle of the interferometer, but after a new orientation of the sphere to successively covering the entire complete surface, finally for the complete surface of the sphere [74]. About 20–50 different orientations of the sphere cover the entire surface of the sphere so that the volume is represented by some hundreds of thousands of diameters. Figure 20 shows an example of the volume measurement by using the PTB interferometer [21].

Figure 20. Diameter topographies of the 28Si-enriched spheres AVO28-S5c (left, (p − v)diameter = 69 nm) and AVO28-S8c (right, (p − v)diameter = 38 nm) [21], where (p − v)diameter expresses the difference between the maximum and minimum diameters.
Download figure:
Standard image High-resolution image8.2. Interferometer with flat reference plates
The second example is an optical interferometer developed at NMIJ. Although the interferometers of PTB and NMIJ have several common features, their optical configurations are completely different. Figure 21 shows a comparison of the principles used in the two interferometers.
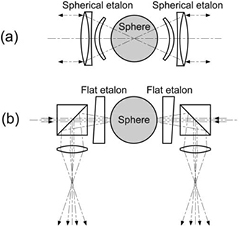
Figure 21. Comparison of interferometers used to measure the diameter of silicon spheres. Optical configurations used at PTB (a) and at NMIJ (b) [13, 14].
Download figure:
Standard image High-resolution imageFigure 21(a) shows the optical configuration of the PTB interferometer with an etalon having spherical reference surfaces, which enable diameter measurements in numerous directions without rotating the sphere, as described in section 8.1, whereas at NMIJ an etalon with flat reference surfaces, shown in figure 21(b), is used for the interferometer. Although the sphere should be rotated by a mechanism installed underneath it, this configuration has a strong advantage of being able to optimize the visibility of interference fringes [75].
Figure 22 shows a block diagram of the NMIJ interferometer. The sphere is placed in a fused quartz etalon with flat reference surfaces. A laser beam emitted from an external cavity laser diode is split into two beams, labelled Beam 1 and Beam 2, which are reflected by mirrors towards the opposite sides of the etalon. The light beams reflected from the inner surface of the etalon plate and the adjacent surface of the sphere produce concentric circular interference fringes, which are projected onto CCD cameras (CCD 1 and CCD 2).

Figure 22. Schematic drawing of the NMIJ interferometer. Reproduced with permission from [57]. Copyright IEEE 2015. E: etalon plate, L: lens, W: window, BS: beam splitter, SH: shutter. To determine L, the shutter SH intercepts Beam 1 and the sphere is removed from the light path by a lifting device.
Download figure:
Standard image High-resolution imageThe fractional fringe order of interference for the gaps between the sphere and the etalon, d1 and d2, is measured by phase-shifting interferometry using optical frequency tuning [14, 76], with an optical frequency comb used as the optical frequency standard [57]. This comb is used as the primary length standard of NMIJ. Using this system, the optical frequency of the diode laser can be continuously tuned over a frequency range of 19 GHz and stabilized at any desired frequency [14]. The phase maps produced by phase-shifting interferometry are used to fit a linear combination of the first nine Zernike polynomials by the method of least-squares, and the fractional order of interference is calculated from the extremum of each phase map. The apparent diameter is given by D = L − d1 − d2. To determine the distance between the two etalon plates, L, a shutter intercepts Beam 1 and the sphere is removed from the light path by a lifting device. Beam 2 passes through a hole in the lifting device, and the beams reflected from the two etalon plates produce fringes on a third CCD camera (CCD3). These fringes are also analysed by phase-shifting interferometry.
8.3. Silicon sphere temperature measurement
The linear thermal expansion coefficient of silicon crystal is about 2.6 × 10⁻⁶ K−1 [77]. If, for example, an uncertainty of 10 mK is assumed for the temperature measurement of 1 kg silicon spheres, this results in a relative uncertainty of 7.8 × 10⁻⁸ in terms of volume, corresponding to a large mass uncertainty of 78 µg in the realization of the kilogram. A precise sphere temperature measurement is therefore needed.
In the PTB interferometer, the temperature of the sphere is measured by a thermocouple, which records the temperature difference between a thin gold ring and a copper block installed in the chamber. The gold ring is supported by a copper wire and is directly attached to the sphere. Since the thermocouple is operated without letting current pass through, it is not necessary to take the influence of self-heating on the temperature measurement into account [78]. A platinum resistance thermometer is installed in the copper block, calibrated at the triple point of water (0.01 °C) and the melting point of gallium (29.7646 °C) to ensure traceability to the thermometric fixed points of ITS-90 [79]. The thermocouple is calibrated in a separate arrangement with the aid of two platinum resistance thermometers. The standard uncertainty of the sphere temperature measurement was estimated to be 0.8 mK [20].
In the NMIJ interferometer, the sphere and etalon are installed in a vacuum chamber equipped with an active radiation shield [14] to control the sphere temperature precisely. Figure 23 shows the interferometer in the vacuum chamber.
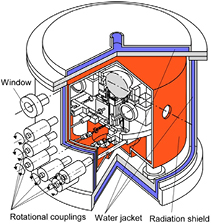
Figure 23. Schematic drawing of the vacuum chamber equipped with an active radiation shield [14]. Film heaters are glued to the outer surface of the shield. The heaters are connected to dc power sources, and the outputs of the sources are controlled by a computer-based proportional–integral–derivative (PID) algorithm, so that the output of the temperature sensors inserted into the radiation shield is equal to the target temperature.
Download figure:
Standard image High-resolution imageThe sphere temperature is measured by small platinum resistance thermometers (PRTs) directly calibrated at the triple point of water (0.01 °C) and the melting point of gallium (29.7646 °C). The PRTs are inserted into small copper blocks in direct contact with the sphere. The current used for measuring the temperature is 0.1 mA, resulting in self-heating of about 0.2 mK. Measured temperatures are extrapolated to find the temperature at zero current. The standard uncertainty of the correction for this self-heating is estimated to be smaller than 0.1 mK. The combination of the radiation shield and small thermometers thus provides reliable temperature measurements with a standard uncertainty of 0.6 mK [14].
8.4. Core volume
Silicon spheres are covered with surface layers (SL), consisting mainly of SiO2, as shown in figure 14. In addition to the oxide layer (OL), a chemisorbed water layer (CWL), a physisorbed water layer (PWL), and a carbonaceous layer (CL) are present on the surface. When the reference phase is set at the top of the surface layers, the total phase retardation δ is derived based on the procedure in [14]. Figure 24 shows the scheme for deducing δ. Since the interferometry measurement is performed in vacuum, the physisorbed water layer (PWL) shown in figure 14 is usually ignored in this evaluation.

Figure 24. Scheme for evaluating the total phase retardation δ for reflection at the surface of the silicon sphere.
Download figure:
Standard image High-resolution imageIn figure 24, Nj is the complex refractive index of layer j defined by Nj = nj − ikj, where nj and kj are the refractive index and extinction coefficient of layer j, respectively, rj,k is the amplitude reflection coefficient at the j/k interface, dj is the thickness of layer j, Njsinθj = Nksinθk, βj = 2πdjNjcosθj/λ, θj is the incident angle at the j/k interface, and λ is the wavelength of the light beam in vacuum. The amplitude reflection coefficients rj,k for the p- and s-polarizations,  and
and  , are generally expressed as
The amplitude reflection coefficient, R2,1,0, at the interface between layers 1 and 2, that takes into account the influence of multiple reflections in layer 1, is then given using r1,0 by
The amplitude reflection coefficient, R3,2,1,0, at the interface between layers 2 and 3 is similarly given using R2,1,0 by
Repeating this procedure, the overall amplitude reflection coefficients,  and
and  , are given by
The value for δ is obtained from the argument of Rall. The additional phase shift for reflection at the surface layers with a total thickness of dSL is δ − π. The difference between the mean apparent diameter (Dapparent observed by interferometry) and the mean true diameter (Dsphere = Dcore + 2dSL) is therefore given by Δd = λ((δ − π)/2π). The mean core diameter is thus given by

Details on the evaluation of the thickness of each surface layer are given in section 7. The core volume is finally obtained as Vcore = (π/6) , as discussed in section 2.
8.5. Current status of volume measurement
The relative standard uncertainties in the core volume measurement by two interferometers are almost the same and are about 2 × 10⁻⁸ [21]. Figure 25 compares the core diameters measured at PTB and NMIJ for the two 28Si-enriched spheres [21]. The mean diameters obtained by using the two interferometers with different optical configurations show excellent agreement within their uncertainties. The difference in the mean diameter measurements is less than 0.3 nm, showing a very high reliability of the diameter and volume measurements at NMIJ and PTB.
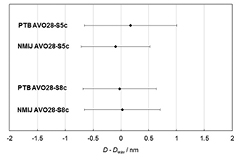
Figure 25. Comparison of the apparent diameters of the 28Si-enriched spheres measured at PTB and NMIJ. Their deviations from the weighted mean diameter (Dwav) are plotted, calculated from the diameters measured by the two different interferometers. The horizontal error bars denote the standard uncertainty.
Download figure:
Standard image High-resolution image8.6. Further improvements
The largest uncertainty source in the PTB interferometer is the wave front aberration [21]. A new interferometer, having a set of objectives with considerably reduced wave front aberrations, is currently being developed to reduce the relative uncertainty of the volume measurement to 1.0 × 10⁻⁸.
The largest uncertainty source in the volume measurement by the NMIJ interferometer is the phase correction due to the diffraction effect [14, 80]. The uncertainty of the diffraction effect is being checked experimentally. This will reduce the diffraction-related uncertainty in the phase correction, decreasing the relative uncertainty of the volume measurement to 1.0 × 10⁻⁸.
9. Mass measurement
Based on equation (11), the mass of a well-characterised silicon sphere is determined as a function of the Planck constant, i.e. without relation to another mass standard. Therefore, the silicon sphere is a primary mass standard [81, 82]. Mass comparisons between primary mass standards and other primary or secondary mass standards are required for the maintenance and dissemination of the realization. Such comparisons are currently performed with uncertainties significantly smaller than the uncertainty of the realization experiments, i.e. within a range of only a few micrograms (relative uncertainty of a few parts in 109). In principle, mass comparisons can be performed in air or in vacuum. However, due to the significant density differences between silicon, platinum–iridium, and stainless steel, the smallest uncertainties were obtained in vacuum, i.e. without the buoyancy and sorption corrections required in air.
Mass comparisons in air and vacuum are performed with high-resolution mass comparators. Typically, the resolution of such mass comparators is of the order of 0.1 µg, i.e. 1 part in 1010 at a nominal load of 1 kg. Due to the high resolution, the electrical weighing range of the mass comparators lies, in the majority of cases, within 0.1 % or 1 % of the maximum load. In order to minimise the influence of nonlinearities, large weighing differences are reduced by means of auxiliary weights. In practice, the high resolution can only be exploited by application of the differential weighing (substitution) method, i.e. not with a simple proportional weighing. In case of the highest requirements, the mass comparators are almost exclusively installed in pressure-tight enclosures, which ensure a significantly improved pressure and temperature stability. The enclosures can be evacuated, in order to perform mass determinations under vacuum conditions. Relative standard deviations of less than 2 × 10⁻¹⁰ are achieved in air and in vacuum.
Sorption effects on mass standards have to be considered for the air-vacuum transfer as well as for the evaluation of the stability of mass standards under vacuum. Extensive analyses were performed by means of gravimetric measurements with sorption artefacts and surface analysis techniques, such as XPS, XRR, XRF, and SE [16, 21, 64, 83–89]. A significant dependence of the sorption effects on the surface quality of the artefacts (cleanness, roughness, homogeneity) and environmental conditions (humidity, pressure range) was observed. Measurements on well-polished and cleaned silicon and stainless steel surfaces in moist air (105 Pa, 50 % relative humidity) and vacuum (0.1 Pa, about 0 % relative humidity) have shown that reversible adsorption and desorption of surface layers change the sorption coefficient by about 0.030 µg cm−2 and 0.040 µg cm−2, respectively [21, 85, 86, 90]. The changes of the surface layers would lead to mass differences between air and vacuum of about 6 µg and 8 µg for well-polished and cleaned 1 kg stainless steel weights and silicon spheres, respectively. Since variations of the sorption layers on the surface of mass standards have to be taken into account (hysteresis effects) in a pressure range between 0.l Pa and 105 Pa, mass comparisons in vacuum were performed in most cases in a pressure range between 10−4 Pa and 0.1 Pa. In this pressure range, a significant variation of the sorption layers was not observed [65, 85, 91, 92].
In practice, sorption artefacts are used as transfer standards between air and vacuum (see figure 26) [65, 87, 90, 93]. They consist of a pair of artefacts, designed in such a way that both items have almost the same masses, volumes, and surface properties, but a large surface difference in order to increase the sensitivity to sorption effects. Typically, one artefact is manufactured as a solid cylinder, whereas the other is composed of four to sixteen discs. From the known surface areas and change of the mass difference between the two artefacts, the mass change of the sorption layers per unit of surface area and the sorption correction for the mass of the artefacts can be determined experimentally, to establish a link between a silicon sphere in vacuum and a secondary standard in air.

Figure 26. View into the weighing chamber during the mass determination of the 28Si-enriched sphere AVO28-S8 (1) with a prototype of the kilogram no. 70 (2), platinum–iridium sorption artefacts (3, 5), and air buoyancy artefacts (4, 6).
Download figure:
Standard image High-resolution imageRelevant influences on the mass of the silicon sphere have to be considered for the maintenance and dissemination of the mass unit. Information on mass stability is required for uncertainty analysis, drift correction, and the determination of appropriate realization intervals. Essentially, the mass stability of silicon spheres is influenced by the growth of the oxide layer and by the sorption of water and carbonaceous layers on the sphere surface. Approved cleaning procedures are applied [94, 95] in order to remove most of the carbonaceous layers and to minimise the amount of physisorbed water. Combined XPS and ellipsometry measurements on cleaned and etched silicon wafers with (1 0 0) orientation have shown that the growth of the oxide layer in air is diffusion-limited and follows a logarithmic law [96]. The oxide layer growth on cleaned and etched single-crystal spheres was characterized by combined gravimetric, XRR, XRF, XPS, and SE measurements [66]. The results confirmed the characteristic function measured by Morita et al [96]. For two silicon spheres, a mass increase of about 30 µg–40 µg in the first 2 months and 40 µg–50 µg in total during the first year after etching was determined. The model showed a continued mass increase by 2 µg–4 µg in the second year and 1 µg–2 µg in the third year. These results revealed that the oxide layer needs a stabilisation time of several months after the manufacturing and etching processes.
In order to compare the mass determination of silicon spheres in vacuum and to derive reference values for their masses, three international mass comparisons were performed between 2004 and 2014 [21, 93, 95]. Standard uncertainties in the range between 7 µg and 17 µg and between 4.3 µg and 7.8 µg were achieved by the participants in 2008/09 and 2013/14 (see figure 27), respectively. Depending on the last recalibration of the national prototype of the kilogram at the BIPM [97], the uncertainty of the prototype used as reference mass in air contributed significantly to the combined standard uncertainty of the results. The contribution was in the majority of cases between 3 µg and 7 µg, with the remaining uncertainty contributions dominated by the sorption correction, the influence of the sensitivity and linearity of the balance, the position dependence, and the mass of auxiliary weights. Depending on the properties of the sorption artefacts used and the weighing differences between the artefacts, standard uncertainties between 2 µg and 4 µg can be achieved for the mass transfer between vacuum and air (without uncertainty of the reference mass). In case of a future realization of the kilogram with uncertainties between 10 µg and 20 µg, this contribution is almost negligible.

Figure 27. Comparison between the results of mass determination in vacuum for the 28Si-enriched spheres AVO28-S5c (a) and AVO28-S8c (b) [21]. The bars represent standard uncertainties (k = 1). WM: weighted mean.
Download figure:
Standard image High-resolution image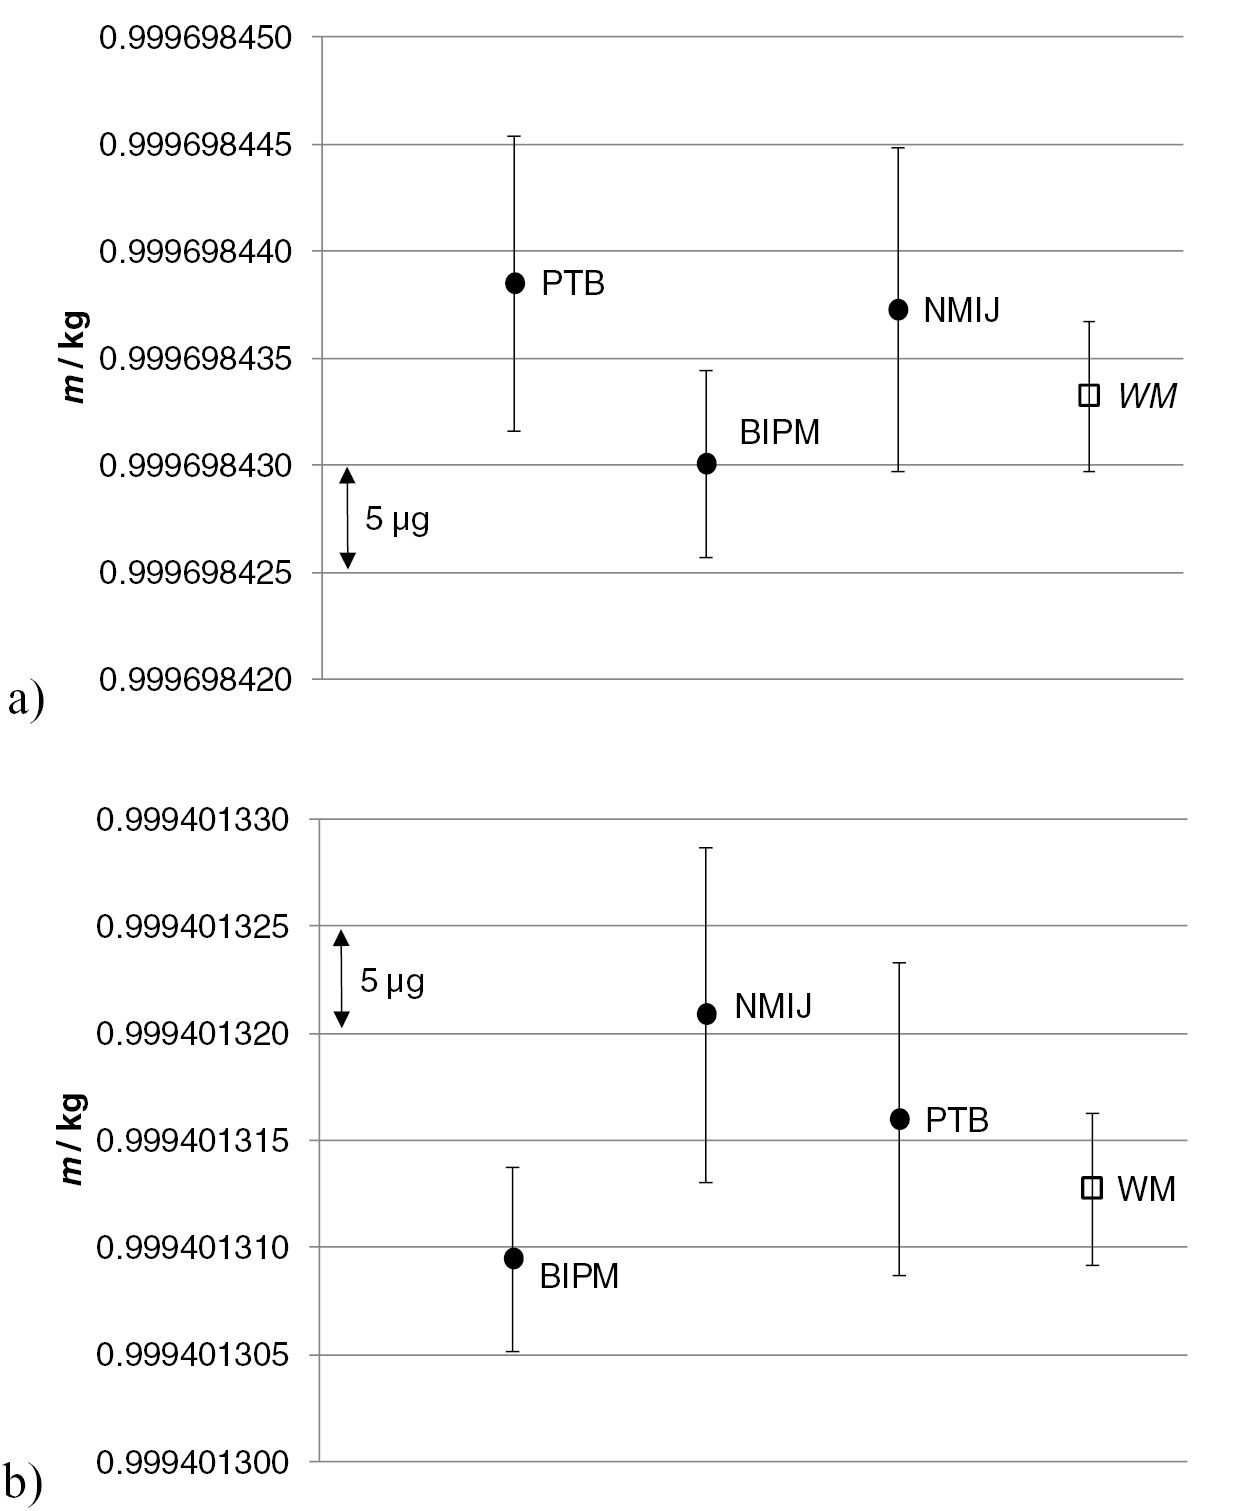
10. Uncertainty in the XRCD method
The latest determination of the Avogadro constant by the XRCD method quoted a relative standard uncertainty of 2.0 × 10⁻⁸ [21], where a lot of institutes collaborated to reach the lowest uncertainty possible. The largest uncertainty source lies in the volume determination of silicon spheres. In order to check its reliability, the two silicon spheres, AVO28-S5 and AVO28-S8, were measured independently by NMIJ and PTB using different methods for volume determination, showing an excellent agreement of better than 0.3 nm in the mean diameter measurement. Further improvements are undertaken by the two institutes for reducing the uncertainty, as discussed in section 8.6.
The second largest uncertainty source lies in the mass determination of the surface layers. As discussed in section 7.6, new apparatuses using XPS and XRF are now available at NMIJ and PTB for a more accurate determination of the mass and thickness of the surface layers.
As introduced in sections 3 and 4, the new 28Si-enriched crystals with a higher enrichment degree and lower impurity concentrations will reduce the uncertainties of M/Mu and point defect concentrations, respectively. The measurements for M/Mu conducted at PTB for the new enriched material have already achieved a substantial reduction of uncertainty, as given in section 6.
In addition, as discussed in section 5, a new and independent lattice parameter measurement is set up at PTB for a confirmation of the existing value measured by INRIM and for a further reduction of uncertainty.
Considering all those intensive on-going research activities, it is feasible to reach an uncertainty of about 1 part in 108 in the near future for the redefined kilogram. However, after the redefinition, each institute will probably measure the sphere(s) by its own method and thus might have to quote a larger relative uncertainty for the realization of the mass unit, see table 9. The consistency of those measurements is currently checked by a pilot study organized within the framework of the consultative committee for mass and related quantities (CCM). Published values of molar mass, lattice parameter, and impurity concentrations can (and will) be used for the realization. Nevertheless, a relative standard uncertainty of 2 × 10⁻⁸ is what the CCM expects for the realization of the redefined kilogram.
Table 9. The foreseen uncertainty contributions for the realization of the new kilogram in the case when only one institute determines the volume of the sphere(s) and the mass of the surface layers [21]; m(28Si) is the mass of a single 28Si atom.
| Quantity | Relative standard uncertainty/10−9 |
|---|---|
| Planck constant h | 0 |
| h/m(28Si) | <1 |
| Lattice parameter | 5 |
| M/Mu = Σi x(iSi)Ar(iSi) | 5 |
| Point defects | 3 |
| Surface layer mass | 13 |
| Volume of the sphere | 20 |
| Total uncertainty | 25 |
Since the invention of the XRCD method at the beginning of the 20th century, it has experienced a steady evolution supported by the development of many cutting-edge technologies, such as x-ray interferometry, manufacturing of silicon spheres, isotope enrichment of 28Si, mass spectrometry, precise and accurate laser interferometry, surface evaluation, high-resolution mass comparison, etc. Although the realization of the redefined kilogram with a standard uncertainty of better than 2 × 10⁻⁸ still requires a lot of research, history tells us that SI revision stimulates science and technology, being a driving force for the production of new measurement technologies. It is therefore confidently believed that the kilogram redefined using the fixed numerical value of the Planck constant h will open a new way to realize the unit of mass, based on new principles with higher accuracy and better reliability.