

Abstract
Electrothermal (ET) plasma launchers have a wide array of applications as mass acceleration devices. An ET plasma launcher utilizes an ET plasma discharge to accelerate a projectile. ET plasma discharges are arc-driven capillary discharges that ablate liner materials and form partially ionized plasmas. ET plasma discharges are generated by driving current pulses through a capillary source. Current pulses typically have peak currents on the order of tens of kA with pulse lengths on the order of hundreds of μs. These types of plasma discharges have been explored for their application to military ballistics, electric thrusters, and nuclear fusion power. ET plasma discharges have been studied using 0D, 1D, and semi-2D fluid models. In this work, a three-fluid, fully two-dimensional model of ET plasma discharges is presented. First approximations used in the newly developed model and code are discussed and simulation results are compared with experiment. Simulation results indicate the development of back flow inside ET plasma discharges due to collisional drag forces between individual plasma species. This back flow is observed for simulations of ET plasma discharges receiving current pulses with peak currents of 10, 20, 30, and 40 kA. Simulation results also reveal the development of fluid perturbations near the breech of the plasma source. These perturbations cause variations in the plasma electrical conductivity and ultimately cause changes in the local ablation rate of the source liner. At higher current pulses, these perturbations are more localized in the region of the source closest to the breech. This effect causes a decrease in the ablated mass in this region relative to the region of the source experiencing the highest ablation.
Export citation and abstract BibTeX RIS
1. Introduction
Electrothermal (ET) plasma discharges are created by passing high currents (on the order of tens of kA) through a capillary, also called a source. The source dimensions are typically on the order of millimetres in internal diameter and centimetres in length. The source liner material ablates by melting, vaporization, and sublimation and then ionizes to form a partially ionized plasma. Energy is transferred to the source liner material primarily through radiative energy transport [1]. The partially ionized plasma fills the source and is ejected out the open end of the source, entering an acceleration barrel. A schematic of an ET plasma source is shown in figure 1.
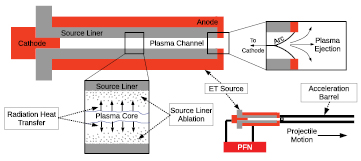
Figure 1. Schematic of an ET plasma source with additional components. A pulse forming network (PFN) is used to drive an electric current pulse through the ET source. Electric current flows from the cathode end to the anode end. A plasma core forms and radiant heat transfer induces ablation of the source liner material. The plasma is ejected out the open end of the source into an acceleration barrel. This figure is not drawn to scale.
Download figure:
Standard image High-resolution imageET plasma discharges have been used in a wide array of applications. These discharges have been used to pre-inject plasma armatures into rail guns [2, 3]. The plasma armatures produced by an ET plasma discharge provide a means of control over the properties of the armature and mitigation of ablation in the rail gun. Electrothermal-chemical (ETC) guns have used ET plasma discharges to provide better burn rate control of solid propellants in ballistic devices [4, 5]. The electrothermal ignition of the solid propellants in ballistic devices has been shown to require shorter and more consistent ignition delay times compared with conventional ignition. ET plasma launchers may prove to be a valuable means of pellet injection in tokamak fusion reactors. ET plasmas can be used to accelerate pellets to velocities needed for deep fueling of fusion reactors and also can be used to launch pellets at a sufficient frequency for pellet pacing in tokamak fusion reactors [6–9]. These devices can also be used to simulate the high heat flux conditions that are expected in tokamak fusion reactors [10–13]. ET plasma discharges have also been explored for use as plasma thrusters in space applications [14, 15].
Theoretical exploration and analysis of ET plasma discharges can be traced back to [16] and [17]. Theoretical studies are neatly summarized by Ruchti and Niemeyer [18]. Numerical, semi-analytical analysis of ET discharges was performed by Kovitya and Lowke [19]. Time-dependent numerical simulation of ET plasma discharges was first undertaken by Gilligan and Mohanti [20] using a 0D model. Their model solved the equations of continuity and energy, and their ablation/radiation model was based on a black-body description of the plasma and relied on a variable radiation shielding parameter. This shielding parameter accounted for the radiation heat flux to the ablating surface that is blocked by the presence of ablated material. This shielding parameter is often called the vapor shield factor. Later advancements to these simulation models included advancement to 1D, time-dependent simulations [21, 22]. These authors solved the equations of continuity, momentum, and internal energy. Hurley et al paid close attention to the formulation of the internal energy equation; he incorporated ionization energy and sublimation energy. Hurley et al also utilized an adaptive vapor shield factor to account for the vapor layer that forms between the ablating surface and the plasma core. One-dimensional simulation capabilities were later advanced by [23] and [24]. These authors developed a semi-2D model of an ET plasma source. This model relied upon the numerical solution of the 1D governing equations of continuity, momentum, and energy. A radial energy equation was then used to approximate radial gradients inside the plasma source.
The simulation and modeling capabilities available for pulsed ET plasma discharges have previously been limited to 0D, 1D, and semi-2D models. It has been noted by [25] that a fully-2D model is needed in order to capture phenomena occurring at the ablating surface and correctly evaluate the heat flux to the capillary wall. Fully-2D simulations relevant to ET plasma discharges have been limited to steady-state analyses [26] and models of the plasma boundary layer [25, 27] which have not fully captured the plasma-fluid dynamics involved in ET plasma discharges. A new model and code have been developed to address this need for fully-2D simulation capabilities of pulsed ET plasma discharges.
This new model and code is called the three-fluid, 2D ET plasma flow simulator (THOR). THOR represents the first step in fully-2D, time-dependent simulation of ET plasma discharges. THOR has been developed as a computational framework to capture significantly more relevant details involved in ET plasma discharges than previously possible. THOR captures radial gradients inside ET plasma discharges which can provide valuable insight into the ablation processes occurring at the ablating surface boundary, a topic which has been the subject of considerable study [28, 29]. THOR has the capability of including charge exchange effects which have been shown to be more important for discharges at lower pressures (tens of kPa) and shorter pulse lengths (∼μs) [30]. THOR simulates the three plasma species (ions, neutrals, and electrons) with independent temperatures. It therefore has the potential to capture certain phenomena arising from thermal non-equilibrium effects. Simulations of similar devices have been shown to have significant differences from thermal equilibrium simulations when thermal non-equilibrium is included [31].
In this work, the underlying fluid models for the three plasma constituents are briefly described. A first approximation for the electric field currently utilized in the simulation code is presented and discussed. This approximation facilitates simulation of the macroscopic fluid behavior inside ET plasma discharges. Simulation results are compared with experiment and analyzed. Analysis of simulation results focuses on emergent fluid behavior of the plasma inside ET plasma discharges. It should be noted that only simulation results for the ET plasma source have been reported in this work. Simulation of the acceleration barrel has been put off to later date.
2. Model formulation
The THOR model and code uses three sets of governing equations to simulate the ion, neutral, and electron species in a two-dimensional, axisymmetric domain. The governing equations used in the model are based on the derivation presented by Meier and Shumlak [32]. The THOR model equations have been presented previously by Esmond and Winfrey [30] and are briefly described in this section. THOR simulates the evolution of the electrons using the drift-diffusion approximation and simulates the ion and the neutral species using separate sets of the Euler gas-dynamic equations with thermal conduction included in the energy equations. Radiation heat transfer from the plasma to the ablating surface is approximated using a black-body radiation approximation. The plasma species interact through ionization, recombination, collisional drag, and collisional heat exchange. In this work, the effects of charge exchange have been neglected as their inclusion is not expected to alter simulation results by more than a few percent [30]. Relations used for the plasma transport properties and collision terms have been presented previously [30]. The ionization and recombination rates are determined using coefficients from the literature [33, 34].
Due to computational constraints, the full solution of Maxwell's equations has been put off to a later date. The induced magnetic fields inside these devices have been shown to be negligible [24]. Only the electric field components are needed for the simulation. For the simulation results presented in this work, a first approximation to the electric field has been utilized. From the simulated plasma composition, the plasma electrical conductivity can be computed as discussed by Esmond and Winfrey [30]. From the plasma conductivity, the electric field can be approximated using Ohm's law.

where  is the electric field,
  is the current density, and σ is the plasma electrical conductivity. The current density is determined from the input current pulse. The current is assumed to be uniform throughout the ET source which is reasonable given the geometry of the problem. The current density is then only a function of time and has only an axial component. The relation for the electric field then reduces to
where J(t) is the axial current density at time t determined from the input current pulse, and  represents the equivalent resistance of the plasma at an axial location, z. As discussed in section 4, this approximation yields physical and realistic results that show reasonable agreement with experimental measurements.
3. Model verification
The THOR simulation code utilizes a first order, scalar-dissipative technique in order to simulate the fluid dynamics [35]. The fluids module of the THOR simulation code has been verified against two well-known gas dynamic test problems. To verify the fluids module of the THOR simulation code, the Sod test problem was simulated in the axial direction, and the Sedov test problem was simulated in the radial direction. A single neutral species was simulated in each test problem to compare results with the analytical solution. The convergence results for the Sod test problem have been presented elsewhere [30].
Qualitative convergence to the analytical solution was observed for the Sedov test problem [36]. This test problem involves a blast wave propagating from the center of the domain outward. The direction of propagation for this verification study was in the radial direction inside the cylindrical geometry. The convergence to the analytical solution is shown in figure 2. The fluids module of the THOR simulation code demonstrates convergence to the analytical solution, and the fluids module used in the THOR code is verified.

Figure 2. Convergence to the Sedov blast wave test problem in cylindrical coordinates for a single neutral species simulated using the fluids module of the THOR simulation code. The domain length is 1 m, the blast energy simulated is  J m−1 in the cylindrical geometry. The factor α used in [36] was set to
  in this work to account for the geometry. The output time is 0.02 μs.
Download figure:
Standard image High-resolution image4. Model validation
Experimental measurements of the total ablated mass inside ET plasma discharges have played a vital role in the validation of simulation models in the past. Recent experimental results have been reported by Winfrey et al [37]. In their work, Winfrey et al focus on a range of experimental current pulses performed with the plasma interaction with propellant experiment (PIPE). These current pulses range from nominally 10 to 40 kA in peak current. All pulses have an active pulse length of approximately 100 μs. Four current pulses have been selected from this range to use in the present work. These current pulses are shown in figure 3. The THOR simulation code was used to simulate the four current shots shown in figure 3. The results for the total ablated mass are compared to experimentally measured values as well as predictions made using the 1D simulation code, ETFLOW [37]. These comparisons are made in figure 4. ETFLOW has been widely used and is shown to achieve good agreement with the measured data especially in the case of the ideal conductivity model. The THOR simulation results over-estimate the ablated mass in the cases where greater than 3 kJ of input energy is used. This over-estimation is attributed the fact that THOR does not explicitly include a vapor shielding mechanism. The vapor shielding mechanism has been shown to become more important at higher input energies [38]. Good agreement is observed between experiment and the THOR simulation results for input shot energies less than 3 kJ.
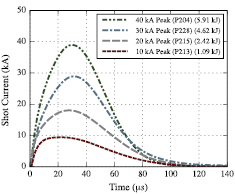
Figure 3. Selected experimentally measured current pulses from the plasma interaction with propellant experiment (PIPE) reported by Winfrey et al [37]. The measured current pulses are used as simulation inputs to the THOR code. The legend indicates nominal peak current, PIPE shot identifier, and energy deposited in the experimental system during discharge.
Download figure:
Standard image High-resolution image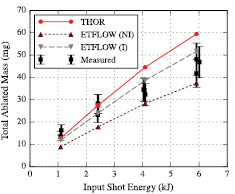
Figure 4. Simulation results are compared with experimental results for the total ablated mass inside ET plasma discharges for varying current shots. ETFLOW simulation results as well as results generated with THOR are shown. ETFLOW results include predictions made with the ideal(I) and nonideal(NI) conductivity models. The experimental uncertainty is approximately 15%. All THOR simulations were run to a simulation time of 250 μs. Experimental results and ETFLOW simulation results have been reported previously [37].
Download figure:
Standard image High-resolution imageFurther validation of the present model is accomplished by comparing the measured electrical conductivity of the ET plasma source with that predicted by the THOR simulation code. The electrical conductivity measured at the time of peak current in the PIPE shots is shown in figure 5. The THOR simulation values corresponding to these measurements are also shown.
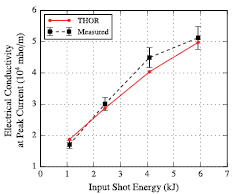
Figure 5. Electrical conductivities (measured and predicted) of the ET plasma source at time of peak current.
Download figure:
Standard image High-resolution imageThe time varying electrical conductivity was measured for the PIPE shots. The simulated and measured time-varying electrical conductivities for four current shots are shown in figure 6. The uncertainties plotted in figures 6 and 5 represent measurement uncertainties. It should be noted that the measurements were taken over the entire electrical system while simulation results are only representative of the plasma domain. Naturally this introduces some small systematic error due to stray currents and minor electronic phenomena. This error is not readily quantifiable and does not affect results and is noted here for completeness.
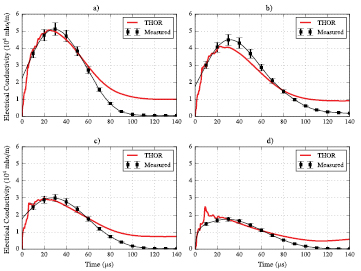
Figure 6. Simulation results from the THOR code for the total electrical conductivity of the ET plasma source during discharge. Measured values are also shown with measurement uncertainty. (a) 40 kA peak current. (b) 30 kA peak current. (c) 20 kA peak current. (d) 10 kA peak current.
Download figure:
Standard image High-resolution imageAs the current pulse dissipates (i.e. at a simulation time above 80 μs) the simulated electrical conductivity over-predicts the measured electrical conductivity. During this time, the discharge is undergoing significant recombination effects. It is clear from figure 6 that the THOR simulation code is lacking in its ability to capture these particular physics. The authors are considering possible improvements to the simulation code in order to enhance its ability to correctly capture these phenomena. However, these recombination effects are not expected to greatly influence the fluid dynamics involved in the simulation and discussed here. Other than these discrepancies near the end of the discharge, the predicted shapes of the electrical conductivity match the measured shapes very well. The predicted peak values of electrical conductivity of the ET plasma source are very close to those measured as shown in figure 5.
Simulated values for the electric field are consistent with measurements performed by [16]. The measured data taken by Niemeyer is shown with simulated results from the THOR simulation code in figure 7. For the present work, the THOR simulation code has been used with Lexan, or  , as the source liner material. This material is similar in composition to those used by [16]. The predicted electric field values correspond very well to the trends discovered by Niemeyer. This provides further validation of the THOR model and code.
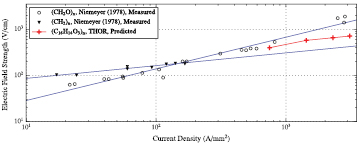
Figure 7. Measured values for the electric field strength as a function of current density. Different materials are represented. Measured data taken by [16]. THOR simulation results shown at time of peak current at an axial position along the source of 6 cm from the cathode (closed) end of the source.
Download figure:
Standard image High-resolution image5. Model results
The THOR simulation model and code have been used to simulate four different current pulses. These current pulses have been measured experimentally and are shown in figure 3. These current pulses were performed on the plasma interaction with propellant experiment (PIPE). Experimental results from this device are reported by Winfrey et al [37]. For the simulation results presented in this work, Lexan polycarbonate has been used as the source liner material. The geometry of the source was held constant with a 2 mm radius and 9 cm length. For each simulation, a mesh with  mm and
  mm was used.
In order to illustrate the two-dimensional flow patterns that develop inside ET discharges as predicted by the THOR simulation code, the results from a 30 kA peak current pulse simulation are shown in figure 8. The two-dimensional flow patterns predicted by THOR show the development of two zones inside the capillary. One zone develops at the source centerline and involves plasma-fluid flow in the negative axial direction toward the cathode (closed) end of the source. The second zone develops near the radial wall of the source and is characterized by the plasma-fluid moving toward the anode (open) end and exiting the source. Near the cathode end of the source, the plasma flow from the centerline is redirected into the near-wall region. This redirection of the flow causes convective mixing of more energetic particles coming from the source centerline with the cooler plasma fluid near the ablating surface. This mixing causes changes in the plasma transport properties and drives fluid-dynamic perturbations near the cathode end of the source. These effects are observed for each of the current pulses simulated.
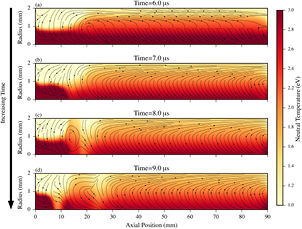
Figure 8. Two-dimensional flow patterns inside an ET plasma discharge with current pulse peaking at 30 kA. Streamlines indicate neutral species flow direction which is representative of plasma flow. The neutral temperature distribution is also shown. The source centerline is at the bottom of each plot. The cathode (closed) and anode (open) ends are on the left and right of each plot, respectively. Simulation times are (a) 6 μs, (b) 7 μs, (c) 8 μs, and (d) 9 μs.
Download figure:
Standard image High-resolution imageThe development of a centerline and a near-wall zone inside of the ET plasma discharge is due to the interaction between the electron species and the heavy species. The electrons are driven toward the cathode end of the source by the electric field. The electron density and plasma temperature are higher near the centerline of the source due to colder, ablated neutral particles entering at the radial wall. The electrons interact with the heavy species via elastic collisions. The elastic collisions induce a frictional drag on the heavy species and cause a back flow of heavy species toward the cathode. Eventually the heavy species are redirected into the near-wall region and are ejected once they reach the anode end of the source.
The effects of this back flow are illustrated in figure 9 by showing the time evolution of the radial distribution of the neutral species velocity over time. The radial distributions at the midpoint of the source are shown (i.e. z = 4.5 cm measured from the cathode). Contour lines on figure 9 indicate sign changes in the neutral species axial velocity. The neutral species is the predominant species, and its axial velocity is representative of the heavy species axial velocity. Figure 9 illustrates further the development of the plasma back flow and the centerline and near-wall zones. It is observed that the distinction between the two zones is strongest during the beginning of the discharge when the discharge current is increasing. Eventually the velocity becomes relatively uniform over the source cross section at its midpoint. It is also observed that, for the 10 kA peak current pulse, the typical behavior of the velocity distribution at the source midpoint is interrupted by a brief period of negative axial velocity over the entire source cross section. This phenomena occurs at a simulation time of 15 μs. This interruption in the behavior of the velocity is caused by the propagation of the fluid-dynamic perturbations, similar to those observed in figure 8, down the length of the source eventually reaching its midpoint, which is shown in figure 9.

Figure 9. Time variations of the radial distribution of the neutral species axial velocity. Radial distributions are shown only at the midpoint of the source and are plotted up to a simulation time of 100 μs. Results are plotted for the (a) 40 kA, (b) 30 kA, (c) 20 kA, and (d) 10 kA peak current pulses.
Download figure:
Standard image High-resolution imageIt has been shown that the THOR simulation code predicts the development of fluid-dynamic perturbations that originate at the cathode end of the source. These perturbations are caused by plasma back flow inside the source and the resultant convective mixing of the plasma near the cathode end of the source. These perturbations influence the plasma transport properties and cause temporal and spacial variations in the plasma parameters inside the ET plasma discharge. These variations in the plasma parameters affect the ablation rate inside the source. The time variation in the local ablation rates inside the source is shown in figure 10. Figure 10 illustrates how the ablation rate is affected by the fluid-dynamic perturbations near the cathode (i.e. left) end of the source. These types of discharges are often referred to as ablation controlled arcs because of the stabilizing role that ablation plays. As larger currents are applied to the source, figure 10 indicates the expected rise in ablation rates. Figure 10 also illustrates the stabilizing effects of higher ablation rates. As larger currents are applied in the source, the variations in the ablation rate become more localized in region of source nearest the cathode. It is expected that discharge current pulses with peak currents higher than 40 kA will continue to exhibit these stabilizing effects.
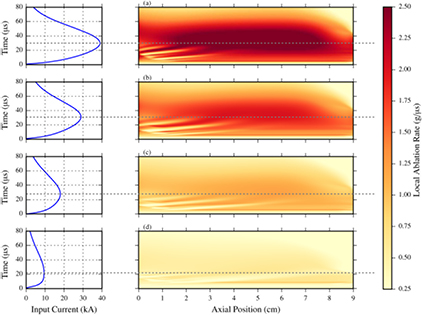
Figure 10. Time variation of local ablation rates along the source length for four different current pulses: (a) 40 kA, (b) 30 kA, (c) 20 kA, and (d)10 kA peak current. The current pulses are shown on the left side of the figure. A single dotted line across the figure indicate the time of peak current in each current pulse.
Download figure:
Standard image High-resolution imageAs variations in the ablation rate become more localized in the region of the source near the cathode, their impact over the course of the discharge affects the topology of the total ablated mass at the end of discharge. The predicted ablation topology inside the source at the end of the discharge is shown in figure 11. Simulation results indicate post-discharge ablation is typically less near the exit of the discharge located at an axial position of 9 cm. This occurs because the exit region tends to be cooler relative to the inner region of the source due to ejection of the plasma and conduction of heat out of the domain through the open boundary. However, as the peak discharge current increases, the THOR simulation code predicts lower ablation near the cathode end of the source compared with the internal region of the source that experiences the largest ablation.

Figure 11. Variation in the total ablated mass along the axial length of the source after completion of discharge.
Download figure:
Standard image High-resolution image
6. Conclusions
A fully-2D, time-dependent model of an ET plasma discharge has been developed. This represents a considerable advancement in the simulation and modeling capabilities of these discharges. The fluid dynamics of the model have been captured using the Euler gas dynamic equations. The electron fluid has been simulated using the drift-diffusion approximation. Approximations based on Ohm's law have been used for the electric field that develops inside the source. Using this approximation, reasonable agreement is achieved between simulation and experiment, and the macroscopic behavior of the plasma can be estimated. Simulation results also show consistency with the work of [16] who conducted similar experiments using a variety of materials. The use of this model and code provides the opportunity to perform more detailed analysis of ET plasma discharges than previously possible. This detail includes a more full description of the plasma-fluid dynamics involved inside the source during discharge.
A brief investigation of these plasma-fluid dynamic details has been performed. Results show that the flow of heavy gaseous particles is affected by the flow of electrons travelling away from the source exit and toward the cathode. This induces back flow of heavy particles near the source centerline. Near the closed end of the source, the heavy particles are redirected toward the radial extent of the source and toward the source exit to be ejected from the source. This causes fluid dynamic perturbations and transience in the plasma transport properties near the cathode (closed) end of the source. This transience causes variations in the local ablation rate near the cathode. It has been observed that these effects become more localized to the cathode end of the source as the discharge peak current increases. As a result, at higher current pulses, there is up to 15% less ablated mass in the region near the cathode than the location of highest ablation occurring in the internal region of the source. These results are significant because they predict and characterize uneven ablation of the source liner material at higher discharge current pulses.
Acknowledgments
This work is made possible by the Virginia Tech Nuclear Engineering Program. The authors acknowledge the use of the plasma interaction with propellant experiment (PIPE) located at North Carolina State University (NCSU). The authors also acknowledge the useful discussion provided by Dr Bourham at NCSU. The authors acknowledge Advanced Research Computing at Virginia Tech for providing computational resources that have contributed to the results reported within this work. This work was supported in part by NSF grant CNS-0960081 and the HokieSpeed supercomputer at Virginia Tech.