

Abstract
Improvements in ozone synthesis from air and oxygen by increasing the number density of plasma channels and lower voltage for the same specific input energy (SIE) were explored in a nonthermal plasma based on a sliding discharge. The number of plasma channels and energy per pulse increased in direct proportion to the increase in the effective length of the anode (the high voltage electrode). Decreasing the discharge gap increased the energy per pulse for the same length and allowed the installation of more electrode pairs in the same space. It allowed the increase of the number of plasma channels in the same space to achieve the same SIE at a lower peak voltage with less energy per plasma channel. The ozone concentration gradually increased to ~1500 ppmv (140 to 50 g kWh−1) from air and to ~6000 ppmv (400 to 200 g kWh−1) from oxygen with a gradual increase in the SIE to ~200 J L−1, irrespective of the variations in electrode geometry, applied voltage or flow rate of the feed gas. A gradual increase in SIE beyond 200 J L−1 gradually increased the ozone concentration to a certain maximum value followed by a decline, but the rate of increase and the maximum value was higher for the greater number of plasma channels and lower peak voltage combination. The maximum ozone concentration was ~5000 ppmv (~30 g kWh−1) from air and ~22 000 ppmv (~80 g kWh−1) from oxygen. The results are explained on the basis of characteristics of the plasma and ozone synthesis mechanism.
Export citation and abstract BibTeX RIS
Introduction
Ozone (O3), an allotrope of diatomic oxygen, O2, is a very powerful oxidizing agent, second only to fluorine among elements. It can oxidize many organic compounds and is used commercially as a bleach for waxes, oils, and textiles, and as a deodorizing agent. Because it is a powerful germicide, it is also used to sterilize air and drinking water. The largest use of ozone is in municipal drinking water and wastewater treatment [1].
Since first reported in the 1850s, ozone is usually synthesized by passing O2 or air through an electrical discharge [2, 3]. A majority of ozone generators are based on dielectric barrier discharge (DBD) [3–7]. Other types of electrical discharges, such as pulsed corona discharge (PCD) [8–10], direct current (DC) corona [11], glow discharge (GD) [12], ferroelectric packed bed reactor [13], surface plasmas [14–23], plasma hybridized with catalyst [13, 17, 25–28], etc, have also been explored in order to increase ozone concentration and/or energy efficiency.
Electrical discharge generates partially ionized gas, i.e. plasma. Generally, the electrical discharge propagates in the gas phase. It is called a volume plasma. In surface plasmas, the electrical discharge slides at the solid–gas interface [29]. The interaction of plasma with the solid surface can increase ionization in the plasma due to additional electrons coming from the surface, e.g. through photoemission and/or thermionic emission [29]. Further, some surface mediated reactions can take place when the plasma produces reactive species in close proximity to the surface [30]. For example, production of NO [31], NO2 [32], and O3 [33] through surface mediated reactions in plasma has been reported.
The stronger interaction of plasma with the solid surface in the case of a surface plasma can significantly enhance ozone generation [19]. Several versions of surface plasmas have been explored for ozone generation from air and/or oxygen, including surface-DBD [14–23], coupled surface-DBD [34], coupled sliding discharge (SD) [35] and shielded SD [36].
In a SD electrode assembly, the electrodes are placed on a dielectric surface. The plasma channels (streamers) propagate in the discharge gap between the electrodes at the solid-gas interface [29, 36]. A shielded SD is a high current version of a SD in which one of the electrodes is extended to cover the inter-electrode gap on the opposite side of the dielectric layer [36]. A strong electric field component normal to the surface, due to the extended electrode, makes the plasma strongly attached to the surface resulting in a higher current and enhanced surface mediated plasma chemical reactions [37]. It has been found to be efficient for applications such as aerodynamics [38–40], pumping lasers, excimer lamps, ultraviolet (UV) sources [41–43], remediation of nitric oxide from air [44–46], diesel fuel reforming for remediation of nitrogen oxides (NOx) [47], and ozone synthesis from air and oxygen [36].
The ozone formation and decomposition reactions are temperature dependent [48]. Ozone formation decreases and ozone decomposition increases in general with an increase in the temperature. It has been reported that the average gas temperature is not a major factor in ozone decomposition. Temperature in a small volume occupied by the plasma channels, which is usually significantly higher compared to the average gas temperature, is identified as a major cause of ozone decomposition [49–51]. External cooling of the discharge chamber accelerates the rate of heat dissipation from the plasma channel resulting in a higher ozone concentration for the same specific input energy (SIE) [21, 50].
One hypothesis is: a decrease in the initial temperature of the plasma channel should increase the ozone concentration for the same SIE. Heating occurs because about 80% of the electrical energy ends up as heat, initially in the plasma channels. Therefore, an attempt was made in this study to increase the number density of plasma channels and apply a lower voltage so that less energy may be injected into each of the plasma channels for the same overall energy density. This approach not only improved ozone synthesis from air as well as from the oxygen feed, it also allowed a lower voltage to be applied to the plasma reactor. The pulsed power supply becomes economically cheaper and technologically simpler for lower peak voltage operations. Findings of this study will be useful in developing and optimizing ozone generators for various applications.
Experimental
Figure 1 shows a schematic of the experimental setup which is similar to the one used in our earlier study [52]. A magnetic pulse compression-based pulsed power supply (MPC3000S-OP1, Suematsu) that can deliver up to 30 kV,⩽500 ns duration pulses at pulse repetition rates from a single shot to 500 Hz was used to drive the plasma reactor. For the experiments, a range of pulsed voltages between 4 kV and 18 kV at 500 Hz were delivered to the plasma reactor using a 30 cm long high voltage cable (TUFLEX 16awg, 45 kV, Part #39X1645 White from Dearborn/CDT). The range of the peak voltage was chosen to be sufficiently high so that reliable breakdown, in the form of corona discharges, would occur in the reactor and sufficiently low so that there is no glow-to-arc transition for the various electrode geometries. The pulse repetition rate was fixed at its maximum value, i.e. 500 Hz in order to dissipate the maximum energy in the plasma at each selected peak voltage. The high voltage probe (Tektronix P6015A) and the current monitor (Ionphysics Corp. Fremont, NH, USA, Model CM-100-L) were inserted at approximately the same point of the power input line and recorded with a high speed digital oscilloscope (Tektronix TDS 3052) using identical cable lengths to ensure accurate power/energy measurements. The energy per pulse (Ep) was calculated by integrating the product of voltage and current pulses over a sufficient period of time, i.e. Ep = ∫VIdt, where V and I are the pulsed voltage and current, respectively.
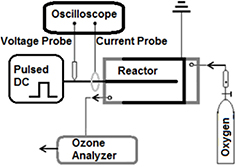
Figure 1. Schematic of the experimental setup.
Download figure:
Standard image High-resolution imageThe electrodes were made of 50 μm thick aluminum foil (ALF200L from Intertape Polymer Groups, USA). The electrodes were parallel strips, the anode strips connected with each other at one end while the cathode strips were connected at the opposite end as shown in figure 2. The electrode assemblies are referred to by the number of anode strips, i.e. 1HV, 2HV, 3HV, and 5HV as shown in figures 2(a)–(d), respectively. High voltage pulses of positive polarity were applied to the anode while the cathode was at ground potential. The effective length, i.e. the overall length of the portions of the HV electrodes that overlapped with the cathodes on the same side of the dielectric, were 95.3 mm, 203.2 mm, 324 mm and 639.5 mm, respectively. The corresponding width of the discharge gap (inter-electrode gap), i.e. the distance between the anode and the parallel cathode strip on the same side of the dielectric, were 16 mm, 9.5 mm, 6.4 mm and 3.2 mm, respectively. Widths of the electrode strips were 6.4 mm for the case of 1HV and 1.6 mm in all other cases.
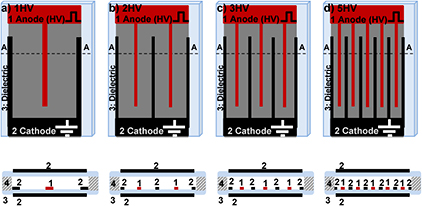
Figure 2. Schematics of shielded sliding discharge electrode assemblies employed in this study showing top views (top row) and cross-sections along A---A lines (bottom row). 1 is the anode to which the pulsed positive high voltage (HV) is applied, 2 is the cathode at ground potential, 3 is the dielectric layer and 4 is a spacer. The electrode assemblies are referred to by the number of anode strips: (a) is 1HV, i.e. it has one HV electrode strip; (b) is 2HV, i.e. it has two HV strips; (c) is 3HV, i.e. it has three HV strips; and (d) is 5HV, i.e. it has five HV strips.
Download figure:
Standard image High-resolution imageThe electrodes were glued to a dielectric sheet made of soda glass measuring 152.4 mm × 76.2 mm × 2.4 mm. A rectangular-shaped cathode (at ground potential) of 50.8 mm width was glued on the opposite side of the dielectric covering the discharge gaps. It was at a distance equal to the thickness of the dielectric layer, i.e. 2.6 mm in all the electrode assemblies employed in this study. A second dielectric sheet, carrying only the rectangular-shaped cathode (at ground potential) on the outer side was placed on top of the first dielectric layer and separated by a silicon spacer. The silicon spacer was made from a sheet measuring 152.4 mm × 76.2 mm × 6.4 mm, from which a 127 mm × 50.8 mm × 2.4 mm block (defining the inside dimensions of the reactor) was cut from the middle. The gas inlet and outlet were nylon tubes of 2.4 mm ID and 3.2 mm OD extending through holes in the top dielectric on opposite corners as illustrated in figure 1.
The experiments were carried out at atmospheric pressure and room temperature, i.e. 25 °C. All gas volumes are expressed under the condition of 25 °C and 1 atm. Pure oxygen or dry air were supplied from pressurized gas cylinders at a flow rate (Q) of 1/60 liter per second (L s−1) in all the experiments. Ozone was analyzed based on an UV absorption technique using an ozone analyzer (gFFOZ, IN USA, Inc., Needham, MA, USA) with an accuracy of 1% of the reading.
The ozone concentration was recorded in grams per normal meter cubed (g Nm−3), where 'normal' stands for 1 atmospheric pressure and 0 °C condition. It was converted to ppmv by the following relationship:

where '(O3)' is ozone concentration in g Nm−3, 'C' is a conversion factor equal to 467. The conversion factor is based on the following facts: 1 Nm3 is equal to 1000 L at 0 °C, the molar mass of ozone is 48 g mol−1, the molar volume of gas at 1 atmosphere and 0 °C is 22.414 L mol−1, there are 1000 L Nm−3 at 0 °C, and ppmv is 10−6 by volume.
The SIE in joules/liter (J L−1) was calculated using the formula:

where 'Ep' is the energy per pulse in joules, 'f ' is the pulse repetition rate (frequency) in s−1 and 'Q' is the flow rate of feed gas in L s−1. The energy yield (EY) in grams of ozone produced per kilowatt hour of energy consumed in the plasma (g kWh−1) was calculated using the formula:

where 'D' is a constant equal to 7.063. The constant is a result of conversions based on the following information. 'Ozone' is the ozone concentration in ppmv, molar volume at 25 °C is 24.465 L, one mole of ozone is 48 g, and 1 kWh is 3600 000 J. Note that the D will be equal to 3298 if the ozone concentration is in g Nm−3. The ozone production rate (OPR) in mmol h−1 is calculated using the formula:

where 'Q' is L s−1, 'Ozone' is in ppmv and 'G' is a constant equal to 6.796 that is a result of unit conversions.
Time integrated images of the discharge showing top views of the electrode assemblies were obtained with a digital camera, Canon 4 × Optical zoom, 12.1 megapixels. Each image was obtained at a pulse repetition rate of 500 Hz in atmospheric pressure air by superimposing discharges of approximately 100 consecutive voltage pulses, unless stated otherwise. The portion of electrode number 2 in figure 2 on the outer side of the top dielectric was removed in order to expose the electrode assembly and the plasma. The number density of the luminous strips in the images were determined by counting strips along a known length of the electrode edge. The known value of the discharge gap was used as internal calibration for estimating the length. Experimental values are shown by symbols in the following figures while the lines are drawn just for a visual guide of the trend.
Results
Electrical characterization of the plasma
Four electrode assemblies, i.e. 1HV, 2HV, 3HV and 5HV shown in figure 2 were evaluated for energy deposition and ozone synthesis from air and oxygen. All electrode assemblies had electrodes in the shape of parallel strips with each of the high voltage anodes surrounded by two cathodes and the space between them was the discharge gap. The main difference between them was that the discharge gap was gradually decreased and more electrode pairs were added in the space so created. Figure 3 shows the representative voltage and current waveforms for ~8 kV peak voltage for the case of 1HV, 2HV and 3HV. The voltage waveform contains both a positive peak and a negative swing, indicating that the plasma, as a load, did not match the characteristic impedance of the high voltage delivery cable. The duration of the main positive pulse, measured by the full width at half maximum (FWHM), of the voltage was ~220 ns for the three electrode assemblies compared in figure 3(a).
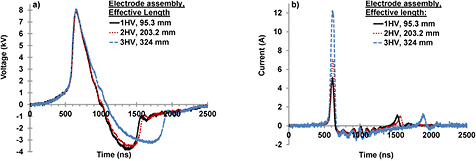
Figure 3. Voltage waveforms (a) and current waveforms (b) for the electrode assemblies of figure 2.
Download figure:
Standard image High-resolution imageThe peak current gradually increased from 5.1 A to 7.1 A and to 12.1 A with an increase in the length of the anode from 95.3 mm to 203.2 mm and to 324 mm, in the case of 1HV, 2HV and 3HV, respectively. Note that the pulsed current includes both the displacement and conduction components. The current peak became broader in the same order. The voltage and current waveforms implied that the plasma was in non-equilibrium without undergoing an arc mode, as the current peaks at the same time as the voltage and vanished before the voltage, rather than the typical V–I characteristics as in arc plasmas, where the voltage drops sharply when the current increases.
The energy per pulse delivered from the pulsed power source to the electrode assembly was calculated by integrating the product of the voltage and current over a sufficiently long period, e.g. 2.5 μs. Results are shown in figure 4(a) for air and in figure 4(b) for an oxygen feed. The energy per pulse increased with an increase in peak voltage for each electrode assembly. Occasionally a streamer to arc transition was observed when the peak voltage was increased beyond the maximum peak voltage values shown in figure 4. The maximum peak voltage up to which no streamer to arc transition occurred was 18 kV, 13 kV, 9 kV and 5 kV for 1HV, 2HV, 3HV and 5HV electrode assemblies, respectively.

Figure 4. Energy per pulse versus peak voltage curves for different electrode assemblies of figure 2 with air (a) and oxygen (b) as working gas. Effective length of the anode is shown in the figure.
Download figure:
Standard image High-resolution imageThe energy per pulse increased with an increase in effective length of the anode at the same peak voltage. For example, at 8 kV peak voltage and an air feed, the energy per pulse increased from 0.8 mJ to 1.8 mJ and to 3.9 mJ for an increase in effective anode length from 95.3 mm to 203.2 mm and to 324 mm. It means that the reactor with a longer anode needs a lower peak voltage for the same energy density.
Note that the ratio of the increase in energy per pulse was more than the ratio of the increase in the length of the anodes for the same peak voltage. For example, an increase in the electrode length by 2.1 and 1.6 times in going from 1HV to 2HV and then from 2HV to 3HV increased the energy per pulse by 2.3 and 2.2 times, respectively, for an 8 kV peak voltage. Further, note that the ratio of the increase in energy per pulse was significantly more than the ratio of the anode length when the width of the discharge gap (d) was reduce to values comparable to the thickness of the dielectric, i.e. 2.4 mm. For example, increase in length of the anodes by 2.1 times from 3HV (d = 6.4 mm) to 5HV (d = 3.2 mm) increased the energy per pulse by 6 times, i.e. from 0.43 mJ to 2.6 mJ for a 5 kV peak voltage.
The following experiments were carried out to differentiate between the effect of electrode length and the effect of the width of the discharge gap on energy per pulse. Energy per pulse and ozone concentration from air were measured for a peak voltage gradually varying from 5 kV to 9 kV in the case of 3HV. One of the three anode strips was removed, which reduced the effective anode length from 324 mm to 216 mm, and the measurements were repeated. The width of the discharge gap, i.e. the distance between the remaining two anode strips and the corresponding cathode strips around them, remained the same. Then a second anode strip was removed leaving only one anode strip. It reduced the effective anode length to 108 mm without affecting the width of the discharge gap and the measurements were repeated. The results are shown in figure 5.
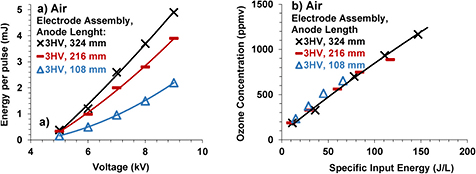
Figure 5. Energy per pulse versus peak voltage (a) and ozone concentration versus specific input energy (b) curves for electrode assembly of figure 2(c) with three anode strips (324 mm effective length, x symbols), two anode strips (216 mm effective length, - symbols) and one anode strip (108 effective length, Δ symbols). Working gas was air flowing @1 liter per minute (lpm) and width of the discharge gap remained constant equal to 6.4 mm.
Download figure:
Standard image High-resolution imageIt can be observed from figure 5(a) that the ratio of energy per pulse was almost the same as the ratio of the anode length for the same peak voltage. It shows that the energy per pulse increases in direct proportion to the increase in effective anode length when all other experimental parameters are kept constant. Therefore, the difference in energy per pulse predicted based on anode lengths in electrode assemblies 1HV, 2HV, 3HV and 5HV and the measured values was associated with the corresponding variation in the width of the discharge gap.
Overlapping figures 4(a) and (b) shows that energy per pulse was almost the same for air and oxygen in the case of 1HV. For example, the energy per pulse was the same, i.e. 6.0 mJ for air as well as for oxygen at a 16 kV peak voltage. This result is in agreement with our earlier study with the same electrode geometry [53]. However, the energy per pulse was lower in oxygen than in air for the same peak voltage for the case of 2HV. For example, the energy per pulse decreased by ~0.8 times, i.e. from 6.4 mJ for air to 5.0 mJ for oxygen at 13 kV peak voltage. This effect was amplified in 3HV and 5HV. For example, the energy per pulse decreased by ~0.5 times, i.e. from 5.1 mJ for air to 2.3 mJ for oxygen at 9 kV in the case of 3HV and by ~0.4 times, i.e. 2.6 mJ for air to 1.0 mJ for oxygen at 4.8 kV in the case of 5HV.
Ozone synthesis from air and oxygen
Figure 6 shows the ozone concentration and production rate with respect to the peak voltage and SIE for the different electrode assemblies of figure 2 from the oxygen feed. The ozone concentration and rate of production increased with an increase in the peak voltage in all cases, which is due to the higher energy dissipation at a higher voltage. The increase in anode length resulted in an increase in the ozone concentration for the same peak voltage, which is due to the higher energy dissipation for a longer effective anode length. The ozone concentration was directly proportional to the rate of ozone production because the flow rate of oxygen was kept constant at 1 lpm in these experiments. Figure 6(b) shows that ozone concentration followed a common curve with respect to the SIE irrespective of the electrode assembly in these experiments. It means the shorter inter-electrode gap and longer anode length combination allowed for operation at a lower peak voltage for the same SIE and same ozone concentration under the conditions of this set of experiments. The EY for ozone was 400–200 g kWh−1, i.e. ~400 g kWh−1 for the lowest concentration and gradually decreasing to ~200 g kWh−1 for the highest concentration in this set of experiments. A similar trend was observed in the case of air (1 lpm) as the working gas, except that the ozone concentration was lower (40–1500 ppm) than in the case of oxygen (300–8000 ppm). It is shown in figure 5(b) for the case of 3HV and was almost the same in the case of all other electrode assemblies employed in this study. The EY was 140–50 g kWh−1 in the case of air.
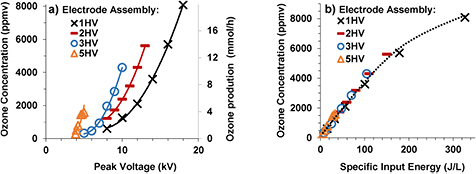
Figure 6. Ozone concentration, ozone rate of production versus peak voltage (a) and ozone concentration versus specific input energy (b) curves for oxygen @1 lpm in the electrode assemblies of figure 2.
Download figure:
Standard image High-resolution imageIn the next set of experiments the SIE was gradually increased by a gradual increase in the peak voltage until the maximum peak voltage below arcing point was reached while keeping the flow rate of the feed gas constant at 1 lpm. Then the peak voltage was kept constant at the maximum and the SIE was further increased by a gradual decrease in the flow rate of the feed gas. For SIE up to ~200 J L−1, all the electrode assemblies produced almost the same ozone concentration for the same SIE as shown in figure 7, which is in agreement with the results shown in figures 5(b) and 6(b). However, ozone production was different in different electrode assemblies for the same SIE when it was more than 200 J L−1 as shown in figure 7.
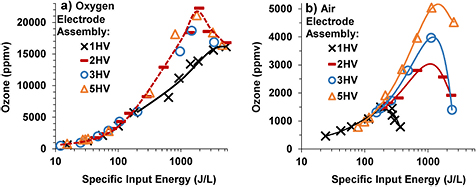
Figure 7. Ozone concentration versus specific input energy curves for oxygen (a) and air (b) feed.
Download figure:
Standard image High-resolution imageThe ozone concentration from the oxygen feed was lower in the case of 1HV than the other electrode assemblies for the same SIE. The maximum ozone was ~16 000 ppm in the case of 1HV which was lower than the ~22 000 ppm reached in the other electrode assemblies. The electrode assemblies 2HV, 3HV and 5HV appear to produce ozone from oxygen with almost the same efficiency.
The ozone concentration from the air feed was lower than that from the oxygen feed. For the condition where SIE is greater than 200 J L−1, the ozone concentration yield was in the following order: 1HV < 2HV < 3HV < 5HV for the same SIE as shown in figure 7(b). The maximum ozone concentration that could be reached was also in the same order. For example the maximum ozone concentration reached was ~1500 ppm, 3000 ppm, ~4000 ppm, and ~5000 ppm for 1HV, 2HV, 3HV and 5HV, respectively. After reaching the maximum value, the ozone concentration declined with a further increase in SIE in all cases.
OPRs corresponding to the experiments described in previous paragraphs are shown in figure 8. The OPRs were significantly higher in the case of oxygen compared to that in the case of air for the same SIE. The OPR initially increased with an increase in the SIE. This part of the curve corresponds to experiments where increasing the peak voltage increased the SIE keeping the flow rate of the feed gas constant at 1 lpm. After reaching the maximum production rate, corresponding to the maximum peak voltage before the arcing point, it started to gradually decrease with a further increase in the SIE. This decreasing part of the curve corresponds to the experiments in which decreasing the flow rate of the feed gas decreased the SIE keeping the applied voltage constant. The applied voltage was 18 kV, 13 kV, 9 kV and 5 kV for 1HV, 2HV, 3HV and 5HV electrode assemblies, respectively. The higher ozone generation efficiency by the proposed method were observed in this part of the curve, i.e. at the expense of reduced OPR. Note that the OPR in the case of 2HV was comparable with the case of 1HV although the peak voltage and energy per pulse were higher in later case.
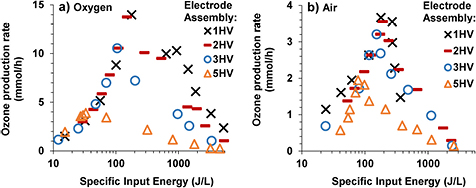
Figure 8. Ozone production rate versus specific input energy curves for oxygen (a) and air (b) feed.
Download figure:
Standard image High-resolution imageNumber density of plasma channels
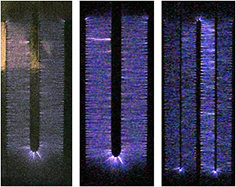
Figure 9 shows time integrated images of about a hundred consecutive discharge events in the electrode assemblies of figure 2. Luminous strips perpendicular to the edges of the electrodes and bridging the inter-electrode gap can be observed. The striped appearance of the plasma indicates that the plasma channels (streamers) repeatedly follow the path of previous discharge events. This is most likely because the discharge leaves behind reactive species, like metastable species, that facilitate the development of the plasma of a subsequent event. The strips have a brighter region close to the anode followed by less luminous areas in the rest of the discharge gap and a bright spot at the cathode edge. It can be observed from figure 9 that the bright portion of the strips extends from anode to about: one third of the discharge gap in the case of 1HV, the middle of the discharge gap in the case of 2HV and whole of the discharge gap, i.e. up to cathode, in the case of 3HV and 5HV. In other words, the bright portion of the plasma channels occupy more of the discharge gap in the following order: 1HV < 2HV < 3HV ⩽ 5HV.
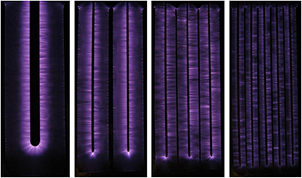
Figure 9. Time integrated images of the plasmas obtained at constant magnification and constant exposure time. Each image was obtained by superimposing approximately 100 consecutive discharge images at maximum peak voltage below the arcing point. The images are top views (from left to right) for the electrode assemblies 1HV, 2HV, 3HV, and 5HV, respectively.
Download figure:
Standard image High-resolution imageThe number of luminous strips was about 1.5 per mm of length of the electrode edge, almost the same in all the electrode assemblies. The plasma of a single voltage pulse was not luminous enough for recording in the case of air or oxygen. However, as shown in figure 10 (left), plasma in nitrogen was more luminous and an image of the plasma for a single voltage pulse could be recorded in the case of 1HV. The number of plasma channels (streamers) per unit length of electrode edge was about the same as the luminous strips in figure 9.
Figure 10. Time integrated image of plasma of a single voltage pulse just below the arcing point in the case of the electrode assembly 1HV and nitrogen (left), 1HV and 75% nitrogen + 25% helium (middle), 2HV and 75% nitrogen + 25% helium.
Download figure:
Standard image High-resolution image
Mixing ~25% helium in the nitrogen made the plasma brighter. Therefore, an image of the plasma of a single voltage pulse could be recorded in 1HV and 2HV as shown in figure 10 (middle and right, respectively). The number of plasma channels per unit length of electrode was almost the same as the luminous strips in figure 9. In a study using the electrode assembly 1HV, it was observed that lowering the peak voltage reduced the luminosity of the plasma but the number of plasma channels per unit length of electrode remained almost the same. It can be concluded from these observations that the number of plasma channels varies in direct proportion to the effective length of the anode with a number density of about 1.5 per mm of length in all the electrode assemblies of figure 2 under the conditions of this study.
Discussion
The high voltage pulse initiates multiple plasma channels (streamers) in the discharge gap distributed along the edges of the anode. This is because the electric field is the most intense at the edges of anode at the time of the voltage pulse application [35]. The streamers propagate toward the counter electrode and transition into a GD after bridging the inter-electrode gap. They remain in the glow phase until the voltage pulse decays. The glow to arc transition was avoided in this study by applying pulsed voltage and keeping the peak voltage below the arcing point in all the experiments. Since the number of plasma channels per unit length of the anode remained almost the same, an increase in the electrode length increased the number of plasma channels, the current flow and the energy delivered to the plasma by the same proportion at the same peak voltage. In other words, the peak voltage can be reduced when the anode length is increased for the same SIE.
Since the number of plasma channels per unit length of electrode remain almost the same, one can expect the ratio of energy per pulse to be almost the same as the electrode length ratio if all other factors are kept constant. This was indeed observed in the results shown in figure 5. However, in the case of the electrode assemblies of figure 2, the width of the discharge gap was also varied along with the electrode length. The electric field (E) is equal to the applied voltage (V) divided by the distance between electrodes (d), i.e. E = V/d. Therefore, for a shorter width of the discharge gap, the electric field is stronger, resulting in increased ionization, current flow and energy delivery to the plasma. It explains the energy per pulse as being more than corresponding to the increase in electrode length in the case of the electrode assemblies of figure 2.
The cathode was also extended, covering the discharge gaps on the opposite side of the dielectric, which was at a gap of 2.4 mm from the anode, i.e. the thickness of the dielectric layer. It causes an electric field component mainly oriented perpendicular to the surface of the dielectric that keeps the plasma firmly attached to the dielectric surface. The strip counter electrode on the same side of the dielectric caused the electric field to be mainly oriented parallel to the dielectric surface. The overall electric field is a vector sum of these two. When the width of the discharge gap is large relative to the thickness of the dielectric, the overall electric field is mainly determined by the electrode on the opposite side of the dielectric. It explains why an increase in anode length by 2.1 times from 1HV to 2HV resulted in an increase in energy per pulse by almost the same proportion, i.e. 2.3 times, while the width of the discharge gap was reduced from 16 mm to 9.5 mm. However, when the gap between parallel strip electrodes becomes comparable to the thickness of the dielectric layer, its contribution to the overall electric field also becomes significant. It explains why an increase in anode length by the same proportion, i.e. 2.1 times, from 3HV to 5HV resulted in a significantly greater increase in energy per pulse, i.e. 6 times, than in the earlier case.
The electric field causes any free electrons to accelerate. The high energy electrons ultimately face collision with ambient gas molecules causing dissociation, excitation, ionization or electron attachment. Ionization produces more free electrons while electron attachment removes the free electrons. An electronegative gas, like oxygen in air, favors electron attachment reactions. Therefore, replacing air with oxygen generally decreases the current and, consequently, the energy density in nonthermal plasmas [53]. In a surface plasma, like the one employed in this study, additional electrons coming through thermionic or photoemissions from the surface minimize the effect of the loss of electrons to an electronegative gas like oxygen [29, 53]. When the width of the discharge gap was gradually reduced, the electric field component lateral to the surface gradually increased and the component perpendicular to the surface decreased. It caused a weaker attachment of the plasma to the surface, which most likely decreased the supply of additional free electrons from the surface. This would explain the decrease in energy per pulse upon replacing air with the more electronegative oxygen as being in the same order as the decrease in the width of the discharge gap from 1HV to 2HV to 3HV and to 5HV.
When the ambient gas is pure oxygen, the following are the main chemical reactions responsible for ozone formation [4, 49]:


where * represents the high energy/excited state and M is a third collision partner that can be O2, O3 or any surface in contact with the plasma. Part of the ozone and its precursor O goes to waste, e.g. through reactions such as the following [49, 54]:


Therefore, the net ozone concentration is a compromise between the rate of ozone formation and the rate of ozone decomposition [54–56]. Especially the EY for ozone synthesis decreases as the ozone concentration is increased because the rate of ozone decomposition reaction is increased simultaneously. It explains a nonlinear increase in ozone with a decreasing slope with an increase in SIE.
The total number of plasma channels was increased by increasing the effective length of the anode in this study. It allowed operating at a lower peak voltage and injecting less energy into each plasma channel for the same SIE. Therefore, there was less heating and the initial ozone formed was diluted in a greater number of plasma channels, both factors favoring ozone formation and reducing ozone decomposition. It explains the increased efficiency for ozone synthesis with the increase in anode length. Another factor that can explain it is that the brighter portion of the plasma channel occupied a larger fraction of the discharge gap when the width of the discharge gap was decreased. Ozone is mainly formed in the brighter portion of the plasma channel [57], therefore a more homogeneous distribution of ozone at the time of its formation in the case of a smaller width of the discharge gap can also decrease ozone losses. These results are in agreement with those in the case of a DBD where less power per unit area resulted in more efficient ozone generation [58]. Higher values of the maximum ozone concentration were achieved in a smaller discharge gap in the case of the DBD which is also in agreement with the results of the present study.
The main conclusion of this study is that increasing the number density of plasma channels and operating at a lower voltage improves ozone synthesis. It was validated for the case of shielded SDs in this study. However, it is expected to be valid for other nonthermal plasmas as well. The following observations noted from earlier literature support this view. For example, in an ac powered DBD reactor, changes in electrode configuration from plane to a multipoint pyramid shape projection on the plane resulted in an increase in the number of micro-discharges from ~20/cycle to ~2500/cycle at the same SIE of 200 J L−1 [59]. It resulted in ozone enhancement from ~1500 ppm (~55 g kWh−1) to ~2700 ppm (~105 g kWh−1). In another study, ozone was ~1400 ppmv (22 g kWh−1) at SIE ~550 J L−1 [60, 61]. Replacing the stainless wire with a tungsten wire improved ozone to ~3500 ppmv (~50 g kWh−1). It was explained on the basis of less bending and causing less arcing in the case of the tungsten wire than the stainless steel wire. However, when a 1 mm diameter stainless steel wire was replaced with four 0.3 mm diameter stainless steel spiral wires the ozone improved to ~5800 ppmv (~90 g kWh−1) for the same SIE of ~550 J L−1 [61]. Less arcing along with an increase in the number density of streamers from thinner and longer wires in the case of the four spiral wires compared to the single wire was the most likely factor responsible for the improvement of ozone production. Same conclusion can be drawn from the results where the number of micro-discharges was increased by employing porous glass fibers [62], a slit barrier on the electrode [6, 63] or a mesh electrode [5]. This study explored the effect of the number density of plasma channels and lower voltage operation combination in a more systematic way and offers a more practical approach to ozone production improvement based on this effect.
The improvement in ozone energy efficiency was observed when the 1HV electrode assembly was replaced with the 2HV. No further improvement was observed when the electrode assembly was replaced with the 3HV or 5HV in the case of oxygen feed. However, in the case of air feed all the electrode assemblies showed different efficiencies. This is because, in addition to the thermal effects and the gas residence time primarily affecting ozone production in the case of oxygen [64, 65], there is a strong ozone poisoning effect by nitrogen-based reactive species in the case of the air feed [65–67]. When oxygen is replaced with air as a feed gas, dissociation and excitation of nitrogen competes with the dissociation of oxygen through the following reactions:


Atomic nitrogen and excited nitrogen molecules then produce atomic oxygen (the precursor of ozone) through reactions such as the following [4]:


However, the net ozone concentration remains about four-fold lower compared to that from oxygen under the same conditions. It is due to the following additional reactions that consume ozone or its precursor, atomic oxygen, in the case of the air feed [66, 67].


Especially, the cycles formed by reaction (17) followed by reaction (21) and also by reaction (20) followed by reaction (21) cause an ozone poisoning effect in the case of air. The ozone poising effect becomes stronger when the power density is higher [20]. In the present study, the number of plasma channels was increased by increasing the effective electrode length within the same space. So, the power per plasma channel was reduced resulting in an improved efficiency for ozone synthesis. It also allowed the achievement of a higher maximum concentration before the ozone poisoning effect dominated the ozone formation reactions.
Forced cooling was not implemented in this study. However, the concept of increasing the number of plasma channels and decreasing the voltage can be expected to have a synergistic effect with forced cooling on ozone generation. Heat removal by the coolant will be faster when it is distributed more homogeneously in the case of the higher number density of plasma channels. Further, a single discharge chamber was operated in all the experiments in this study. The reactor can be scaled up by stacking and operating multiple discharge chambers in parallel for practical applications in the future [68].
Conclusions
In a shielded SD electrode assembly with each strip anode (high voltage electrode) surrounded by two parallel counter electrode strips at ground potential and the counter electrode extended and covering the discharge gap on the opposite side of the dielectric, the following was observed:
- 1.Varying the effective length of the anode varied the number of plasma channels and energy per pulse by the same proportion.
- 2.Decreasing the discharge gap increased the energy per pulse for the same effective length of anode.
- 3.Decreasing the discharge gap allowed the installation of more electrode pairs in the same space, and allowed a lower voltage operation with less energy per plasma channel while keeping the same overall SIE.
- 4.The energy per pulse was the same in air and oxygen for the same peak voltage when the discharge gap was longer (16 mm) but was lower in oxygen than in air when the discharge gap width was reduced, more so when the later became comparable with the thickness of the dielectric layer.
- 5.Ozone concentration and rate of production were determined by the composition of the feed gas (air or oxygen) and SIE up to 200 J L−1, irrespective of the variations in the electrode geometry and peak voltage.
- 6.For a SIE increase beyond 200 J L−1, the ozone concentration and EY were higher for a narrower discharge gap, longer effective length of the anode and lower voltage combination. For example, ~2200 ppm ozone was observed in the case of the 2HV electrode assembly operating at 13 kV voltage which is significantly higher than the ~1400 ppm ozone in the case of 1HV electrode assembly operating at 18 kV voltage for the same SIE (~1200 J L−1) and oxygen feed. The maximum ozone concentration that could be reached also followed the same trend. For example, the maximum ozone concentration that could be reached with air feed was ~1500 ppm, ~3000 ppm, ~4000 ppm, and ~5000 ppm for the 1HV, 2HV, 3HV, and 5HV electrode assemblies, respectively.
Acknowledgments
This work is supported by 'Frank Reidy Fellowship in environmental Plasma Research' and with internal funds of the Frank Reidy Research Center for Bioelectrics. Authors are thankful to Barbara C Carroll of the Frank Reidy Research Center for Bioelectrics, for corrections and improving the English of the manuscript.