

Abstract
Pulsed dielectric barrier discharges (DBDs) have become a promising solution to generate atmospheric-pressure non-equilibrium plasmas. In this work, a one-dimensional fluid model is carried out to research particle densities of the pulsed nitrogen DBDs at atmospheric pressure. Averaged particle densities, time evolutions of axial distributions of particle densities and influences of discharge gap distance dg on the particle densities are systematically illustrated and discussed. The calculation results show that averaged electron densities are lower than averaged N2+ densities, but higher than other averaged ion densities. Time evolutions of axial distributions of electron, N+ and N2+ densities show two peaks during rising and falling phases of applied voltage when dg is 0.2 cm but present gradual increases during pulse width when dg is 0.6 cm, which are similar to those of N2(a') and N2(B). Maximums of N3+ densities are close to the momentary cathode under dg of 0.2 cm but locate near the grounded electrode under dg of 0.6 cm, which are alike to those of N2(A) and N2(C). Besides, N4+ densities nearby the momentary anode are higher than those nearby the momentary cathode when dg is 0.2 cm. N(2D) has low averaged particle densities and complex time evolutions compared to N.
Export citation and abstract BibTeX RIS
1. Introduction
Dielectric barrier discharges (DBDs) have attracted an increasing amount of attention because they can produce atmospheric-pressure non-equilibrium plasmas in different working gases without need for a vacuum chamber [1]. Recent advances of pulsed power technology have permitted submicrosecond or nanosecond voltage pulses to drive the DBDs [2, 3]. More importantly, the DBDs driven by repetitive short-pulse voltages can generate stable and homogeneous plasmas under various discharge conditions and exhibit plenty of advantages compared to the traditional DBDs excited by continuous sinusoidal voltages, including less averaged dissipated power density, lower gas temperature, more robust plasma stability as well as active and diverse plasma chemistry [3, 4]. In particular, the use of submicrosecond and nanosecond pulsed excitation would facilitate the possibility to manipulate the electron energy distribution function and in turn manipulate plasma chemistry [5]. Therefore, the pulsed DBDs have great potential for a variety of industrial and biomedical applications, such as thin film deposition, surface modification of biodegradable polymers and plasma disinfection [6–8].
Helium, argon, nitrogen and air are the common working gases used in the DBDs at atmospheric pressure [5, 6, 9]. Although it is possible to generate the homogeneous plasmas in the above gases, the DBDs in nitrogen have received the long-lasting experimental and theoretical interest of the researchers due to their lower operational cost and better stability than the DBDs in the noble gases [6]. In the past decade, the characteristics and mechanisms of the DBDs in nitrogen driven by continuous sinusoidal voltages have been researched, but the results are controversial. Golubovskii et al have found that the discharge in nitrogen, in which the space charge plays a crucial role, is a glow-like discharge [10]. In contrast, Massines et al have reported that in nitrogen the glow discharge cannot be achieved and the only solution to get homogeneous plasmas is the Townsend discharge [6]. In addition, the mechanisms resulting in the homogenous plasmas in nitrogen are not fully understood. It has been pointed out that Penning ionization between metastable state nitrogen molecules is responsible for producing sufficient seed electrons to initiate a Townsend breakdown. Nevertheless, electron desorption from the dielectric surfaces and secondary electron emission caused by the collision between metastable state molecules and the charged dielectric surfaces have been proposed as the probable mechanisms [11]. On the other hand, the productions of nitrogen atoms in the DBDs at atmospheric pressure have been simulated and discussed [12], and the densities of charged and neutral particles have been compared under varying discharge conditions [13]. These studies on the nitrogen DBDs have mainly focused on the DBDs driven by the sinusoidal voltages. Although the atmospheric-pressure DBDs driven by the short-pulse voltages have aroused great interests among researchers [2–6], these investigations have mainly focused on helium, argon, or inert gas with small addition of oxygen. For the atmospheric-pressure pulsed nitrogen DBDs, the attempts to explore both time-resolved and spatial-resolved particle density information have been less reported so far. Furthermore, the use of shorter pulse width can lead to larger reduced electric field E/N and higher discharge current density, which results in more abundant electrons, active species and UV emissions [14]. Consequently, systematic researches of the particle densities of the pulsed DBDs in atmospheric-pressure nitrogen can contribute to not only gaining a further understanding of discharge mechanisms but also achieving optimum application efficacy.
In this work, a 1D fluid model is employed to research the non-equilibrium plasmas produced by the pulsed DBDs. In fact, the DBDs are more often analyzed by the 2D or the 3D fluid model because the discharge usually occurs at the streamer criteria. Based on the assumption of the homogeneous discharge along the dielectric surfaces, the plasma dynamics can be assumed to be treated by a 1D description. Thus, a 1D fluid model is utilized for the present calculation. This model can easily take the abundant particles and reactions into account and its results are consistent with published experimental results [15, 16]. In comparison with other research papers regarding the atmospheric-pressure nitrogen DBDs driven by the sinusoidal voltages [11–13], the present paper illustrates and discusses the calculation results of the particle densities for the nitrogen DBDs driven by the short-pulse voltages in detail. These results include not only time-resolved, but also spatial-resolved particle density information. Therefore, the aim of this work is to systematically investigate both averaged particle densities and time evolutions of axial distributions of the particle densities for the pulsed DBDs in atmospheric-pressure nitrogen. The rest of this manuscript is organized as follows. The simulation model is introduced in section 2. Averaged particle densities, time evolutions of axial distributions of particle densities and influences of discharge gap distance on the particle densities are studied and discussed in section 3. Finally, conclusions are summarized in section 4.
2. Simulation model
Figure 1 shows a schematic diagram of the pulsed dielectric barrier discharges in atmospheric-pressure nitrogen. The plasmas are produced between two parallel-plate electrodes, one is a grounded electrode and the other (powered electrode) is connected to repetitive positive voltage pulses. The two electrodes are separated by a small discharge gap and covered with the dielectric layers. In this work, the distance of the discharge gap can be changed but other operating conditions of the plasma reactor are fixed. To improve computational efficiency, only 12 main particles and 32 key chemical reactions are taken into account. The main particles include background molecules N2, electrons e, ions N+, N2+, N3+ and N4+, ground state atoms N, metastable state atoms N(2D), metastable state molecules N2(A), N2(a'), N2(B) and N2(C). The key chemical reactions and the corresponding rate coefficients are listed in table 1.
Table 1. Key chemical reactions and the corresponding rate coefficients in nitrogen.
| No. | Reaction equation | Rate coefficienta | Reference |
|---|---|---|---|
| 1 | N2 + e → N2+ + 2e | 5.05 × 10⁻¹¹Te0.5(1 + 1.1 × 10⁻⁵Te)exp(−1.82 × 10⁵/Te) cm3 s−1 | [17] |
| 2 | N2 + e → N+ + N + 2e | 4.29 × 10⁻¹²Te0.5(1 + 6.76 × 10⁻⁶Te)exp(−2.96 × 10⁵/Te) cm3 s−1 | [17] |
| 3 | N2 + e → N2(A) + e | 6.21 × 10⁻¹¹Te0.5(1 + 2.46 × 10⁻⁵Te)exp(−8.21 × 10⁴/Te) cm3s−1 | [17] |
| 4 | N2 + e → N2(a') + e | 5.81 × 10⁻⁹exp(−7.57/Te) cm3 s−1 | [18] |
| 5 | N2 + e → N2(B) + e | 8.44 × 10⁻⁹ε−0.33exp(−9.15/ε) cm3 s−1 | [19] |
| 6 | N2 + e → N(2D) + N + e | 3.99 × 10⁻¹¹ε2.24exp(−9.1/ε) cm3 s−1 | [19] |
| 7 | N + e → N+ + 2e | 1.45 × 10⁻¹¹ε2.58exp(−8.54/ε) cm3 s−1 | [19] |
| 8 | N + e → N(2D) + e | 5.06 × 10⁻⁹exp(−10.8/ε3.95) cm3 s−1 | [19] |
| 9 | N2(A) + N2(a') → N4+ + e | 5 × 10⁻¹¹ cm3 s−1 | [20] |
| 10 | N2(a') + N2(a') → N4+ + e | 2 × 10⁻¹⁰ cm3 s−1 | [20] |
| 11 | N2(A) + N2(A) → N2(B) + N2 | 7.7 × 10⁻¹¹ cm3 s−1 | [21] |
| 12 | N2(A) + N2(A) → N2(C) + N2 | 1.5 × 10⁻¹⁰ cm3 s−1 | [21] |
| 13 | N2(A) + N2 → 2N2 | 2.2 × 10⁻¹⁴ cm3 s−1 | [19] |
| 14 | N2(A) + N → N + N2 | 5 × 10⁻¹¹ cm3 s−1 | [19] |
| 15 | N2(B) + N2 → N2(A) + N2 | 5 × 10⁻¹¹ cm3 s−1 | [19] |
| 16 | N2(a') + N2 → N2(B) + N2 | 1.9 × 10⁻¹³ cm3 s−1 | [21] |
| 17 | N2(C) → N2(B) + hv | 2.74 × 10⁷ s−1 | [21] |
| 18 | N2(B) → N2(A) + hv | 2 × 10⁵ s−1 | [21] |
| 19 | N2+ + e → 2 N | 1.66 × 10⁻⁶/Te0.7 cm3 s−1 | [19] |
| 20 | N2+ + e → N + N(2D) | 1.55 × 10⁻⁶/Te0.7 cm3 s−1 | [19] |
| 21 | N3+ + e → N + N2 | 3.46 × 10⁻⁶/Te0.5 cm3 s−1 | [19] |
| 22 | N4+ + e → 2N2 | 4.73 × 10⁻⁵/Te0.53 cm3 s−1 | [19] |
| 23 | N+ + 2e → N + e | 1 × 10⁻¹⁹(Tg/Te)4.5 cm6 s−1 | [19] |
| 24 | N2+ + 2e → N2 + e | 1 × 10⁻¹⁹(Tg/Te)4.5 cm6 s−1 | [19] |
| 25 | N2+ + N → N2 + N+ | 1 × 10⁻¹² cm3 s−1 | [19] |
| 26 | N4+ + N → 2N2 + N+ | 1 × 10⁻¹¹ cm3 s−1 | [19] |
| 27 | N+ + 2N2 → N2 + N3+ | 5.2 × 10⁻³⁰ cm6 s−1 | [17] |
| 28 | N2+ + N2(A) → N + N3+ | 3 × 10⁻¹⁰ cm3 s−1 | [19] |
| 29 | N3+ + N → N2 + N2+ | 6.6 × 10⁻¹¹ cm3 s−1 | [19] |
| 30 | N2+ + 2N2 → N2 + N4+ | 6.8 × 10⁻²⁹(300/Tg)1.64 cm6 s−1 | [21] |
| 31 | N4+ + N2 → 2N2 + N2+ | 2.1 × 10⁻¹⁶exp(Tg/121) cm3 s−1 | [21] |
| 32 | N(2D) + N2 → N + N2 | 5 × 10⁻¹²exp(−1620/Tg) cm3 s−1 | [19] |
aε = 3Tekb/2e, where Te is electron temperature, e is electron charge and kb is Boltzmann constant.
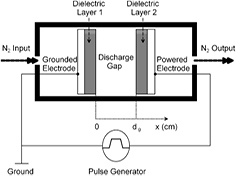
Figure 1. Schematic diagram of the pulsed dielectric barrier discharges in atmospheric-pressure nitrogen.
Download figure:
Standard image High-resolution imageOn the basis of the assumption of the homogeneous discharge along the dielectric layer surfaces, a 1D fluid model is utilized for the present calculation. This fluid model consists mainly of the 1D continuity equation, the current conservation equation and the electron energy conservation equation. These equations are coupled with each other and thus electron temperature Te and electric field E are solved simultaneously. So the model is partly based on the assumption of the local field approximation [22] because many reaction rate coefficients are relative to Te and depend on reduced electric field E/N. The detailed principles of this fluid model can be found elsewhere [23, 24]. Therefore, only a brief description for the equations used in this model is given below.
The general form of the 1D continuity equation is
where n is the particle number density, j is the particle flux density, S stands for the sources and losses of the particles and subscripts e, i and np represent electron, ion and neutral particles, respectively.
Within the drift-diffusion approximation, the particle flux densities are given by


where E is the electric field, μ is the mobility and D is the diffusion coefficient.
The electric field E is determined by the current conservation equation, taking the form of
where J0 is the total current density, ε0 is the permittivity of the free space and e is the electron charge. The total current density consists of the displacement current density and the conduction current density. Thus, J0 should be further expressed as
where dg is the discharge gap distance, Va(t) is the applied voltage, Jg is the conduction current density and x is directed from the grounded electrode (x = 0) towards the powered electrode (x = dg).
The gas temperature is assumed to be a constant value of 300 K, but the electron temperature is obtained by solving the following electron energy conservation equation
where kb is the Boltzmann constant, Te is the electron temperature, Δεi is the energy loss per electron in an inelastic collision event caused by the ith reaction, ri is the reaction rate of the ith reaction and the electron thermal flux Q is calculated using
where λe is given by
Considering the effect of the secondary electron emission, the total electron flux density je' at the surface of the dielectric layer is given by
where γ is the secondary electron emission coefficient.
The improved Scharfetter–Gummel scheme is utilized to solve the above nonlinear equations. The detailed description for the discrete scheme can be found elsewhere [24, 25]. FORTRAN is employed to structure the code for the present calculations. In table 1, a number of reaction-rate coefficients are relative to the electron temperature Te, which is a function of the reduced electric field E/N since the Te and the E are solved simultaneously. However, it should be pointed out that the more accurate reaction-rate coefficients can be calculated by using the information of the cross sections for the collisions between the particles in the working gas [22]. This approach will be taken into account in the future researches.
3. Simulation results and discussion
In this section, the discharge gap distance dg is changed from 0.1 to 1.0 cm and all other operating conditions of the plasma reactor and pulse parameters of applied voltage are fixed as follows: relative dielectric constant of dielectrics is 6.0, thickness of each dielectric layer is 0.15 cm, secondary electron emission coefficient of dielectric surfaces is 0.02, amplitude is 6 kV, frequency is 1 kHz, pulse width is 950 ns. For the rectangular shaped pulse voltage, the rise time (=fall time) of 50 ns is used in the simulation. This value is based on the experimental setups of Walsh, Martens and Lu [5, 26, 27]. On the basis of the above discharge conditions and the aforementioned fluid model, the pulsed DBDs in atmospheric-pressure nitrogen are simulated. The detailed results and analyses are presented below.
3.1. Averaged particle densities
Figure 2(a) illustrates averaged particle densities of charged species, including electron e, ions N+, N2+, N3+ and N4+, as a function of discharge gap distance dg. The averaged particle density is a result of the sum of the particles in the gap in one period of applied voltage divided by both the volume of the gap and the period of the applied voltage. It can be seen that the averaged particle densities of the charged species decrease with increasing dg. Averaged particle densities of e are lower than averaged particle densities of N2+ but higher than averaged particle densities of N+, N3+ and N4+, implying that N2+ ions are the dominant positive ions in the pulsed nitrogen DBDs. However, for the nitrogen DBDs driven by the sinusoidal voltage, N4+ ions have been found to be the most dominant charged species since the conversion of N2+ ions to N4+ ions is efficient at atmospheric pressure [28]. The simulation results of fluid modeling also have shown that the density of N2+ is two orders of magnitude lower than that of N4+ [13]. However, it has been pointed out that the use of short-pulse excitation not only reduces the gas temperature, but also enables access to active and diverse plasma chemistry that is not easily obtained using sinusoidal excitation [5]. Thus, the differences of particle densities of the charged particles between the present calculation results and the rest of the literature on the topic of the nitrogen DBDs can be attributed to the different external power sources. For the nitrogen DBDs driven by the continuous sinusoidal voltages, electric power is mainly absorbed through the ions, rather than the electrons [13]. In contrast, the long off-time of the pulsed voltages allows significant gas cooling between the repetitive pulses, which plays an important role in obtaining low gas temperature, so that most of electric power is absorbed by the electrons. Therefore, the abundant energetic electrons in the pulsed DBDs cause more impact ionizations, leading to more N2+ ions. In addition, the N+ densities have been expected to be negligibly small because the threshold of dissociative ionization is high and the degree of the ionization is weak [28]. Accordingly, as shown in figure 2(a), averaged particle densities of N+ are far below averaged particle densities of N2+, N3+ and N4+.
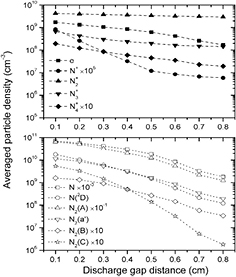
Figure 2. Averaged particle densities of (a) electron e, ions N+, N2+, N3+ and N4+ and (b) ground state atom N, metastable state atom N(2D), metastable state molecules N2(A), N2(a'), N2(B) and N2(C) as a function of discharge gap distance.
Download figure:
Standard image High-resolution imageFor the atmospheric-pressure DBDs, discharge modes can be divided into atmospheric pressure glow discharge (APGD) and atmospheric pressure Townsend discharge (APTD) [6, 29, 30]. In the APGD, discharge region includes a cathode fall region and a positive column during the breakdown. In the cathode fall region, the density of positive particles is usually higher than the density of negative particles. In the APTD, there is not a quasi-neutral region, but a positively charged space region. Thus, averaged particle densities of nitrogen ions are higher than those of electrons under different discharge gap distances.
Figure 2(b) shows averaged particle densities of neutral particles, including ground state atom N, metastable state atom N(2D), metastable state molecules N2(A), N2(a'), N2(B), and N2(C), as a function of dg. It is clear that the averaged particle densities of the neutral particles decrease with the increase of dg. This figure also illustrates that, under the calculated dgs, averaged particle densities of ground state atom N are at least two orders of magnitude higher than those of other neutral particles and averaged particle densities of metastable state molecule N2(A) are at least one order of magnitude higher than those of other metastable state molecules. Compared to other neutral particles, densities of N2(B) and N2(C) are relatively low, which should be attributed to the high rate constants of the radiative cascade reactions N2(C) → N2(B) + hv and N2(B) → N2(A) + hv (2.5 × 10⁷ s−1 and 1.3 × 10⁵ s−1, respectively) [12]. The present calculation results of the averaged particle densities of the neutral particles are agreement with those of the nitrogen discharges driven by the continuous sinusoidal voltages [11–13, 28]. In what follows, temporal evolutions of axial distributions of the particle densities in the pulsed nitrogen DBDs at atmospheric pressure will be systematically investigated to acquire information of not only time-resolved but also spatial-resolved particle density characteristics.
Figure 3 gives applied voltage Va and discharge current density Jg as a function of time t under dgs of (a) 0.2 cm and (b) 0.6 cm. Figure 4 presents averaged electron temperature Te − ave as a function of time t under dgs of (c) 0.2 cm and (d) 0.6 cm. The results indicate that there are obvious differences between the Jgs or the Te − aves under the different dgs. When dg is 0.2 cm, not only two discharge current pulses, but also two electron temperature pulses are observed during rising and falling phases of the applied voltage with little current density and low electron energy during pulse duration and time interval between two voltage pulses, which is alike to discharge characteristics of the pulsed DBDs in inert gas [27]. As dg rises to 0.6 cm, it can be seen that the Jg increases gradually, but the Te − ave declines slightly during pulse width. It also can be seen that peak values of the Jg and the Te − ave under dg of 0.2 cm are obviously higher than those under dg of 0.6 cm. The rise time of the pulsed voltage plays an essential role in the improvement of the performance of the pulsed DBDs. The effects of the rise time on the discharge characteristics of the pulsed DBDs have been calculated. The results show that the peak value of the discharge current density and the electron temperature increase with decreasing rise time, which are agreement with experimental results of the atmospheric-pressure non-equilibrium plasma [31]. Furthermore, the simulation results show that the averaged particle densities of simulated particles rise up with the decrease of the rise time.

Figure 3. Discharge current densities as a function of time t under discharge gap distances of (a) 0.2 cm and (b) 0.6 cm.
Download figure:
Standard image High-resolution image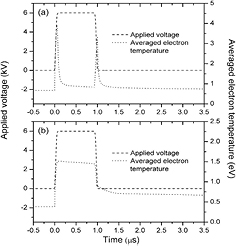
Figure 4. Averaged electron temperatures as a function of time t under discharge gap distances of (a) 0.2 cm and (b) 0.6 cm.
Download figure:
Standard image High-resolution image3.2. Time evolutions of axial distributions of charged particle densities
Figure 5 displays time evolutions of axial distributions of electron e densities under discharge gap distances of (a) 0.2 cm and (b) 0.6 cm, respectively. Time t starts from t = 0 μs and ends in t = 1.5 μs because discharge current densities and the majority of particle densities smoothly change after t = 1.5 μs. Figure 6 presents time evolutions of axial distributions of electron temperatures under discharge gap distances of (a) 0.2 cm and (b) 0.6 cm. It is clear that the increase of the discharge gap distance significantly influences axial distributions of both electron densities and electron temperatures. Figure 5(a) describes that time evolution of axial distributions of electron density presents two peaks nearby momentary cathode (MC) under dg of 0.2 cm, which corresponds to the two discharge current pulses in figure 3(a). The reason for this is that, under a small discharge gap distance, the effect of space charge field is strong enough to make electrons gather around the MC. In comparison with figures 5(a) and (b) indicates that the development and propagation of an electron avalanche and ionization wave driven by a space charge field have been limited due to the wider discharge gap. Thus, electron density presents a gradual increase during the whole pulse width, corresponding to the smooth profile of the discharge current density under dg of 0.6 cm in figure 3(b). Moreover, when dg is 0.6 cm, the peak of axial distributions of electron densities is close to momentary anode (MA) after the discharge current density has reached its maximum and quenching of electrons is relatively slow.

Figure 5. Time evolutions of axial distributions of electron e densities under discharge gap distances of (a) 0.2 cm and (b) 0.6 cm.
Download figure:
Standard image High-resolution image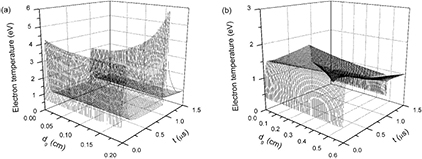
Figure 6. Time evolutions of axial distributions of electron temperatures under discharge gap distances of (a) 0.2 cm and (b) 0.6 cm.
Download figure:
Standard image High-resolution imageFigure 7 gives time evolutions of axial distributions of ion N+ densities under dg of (a) 0.2 cm and (b) 0.6 cm. It can be seen that peak moments of N+ densities in figure 7 are identical to peak moments of the discharge current densities in figure 3 and axial positions of N+ density maximums are alike to those of electron density maximums under dgs of 0.2 cm and 0.6 cm. However, the N+ densities, which are away from the above peak moments and axial positions, are extremely low. This can be attributed to the producing and reducing mechanisms of ion N+. N+ ions are mainly generated by electron impact ionizations with background molecules N2 or ground state atoms N (reactions 2 and 7 in table 1). Rate coefficients of the two reactions obviously increase with the increase of electron temperature Te. At the peak moments of the discharge current densities, both electron densities and Tes are greater than those at other moments, resulting in sharp increases of ion N+. At other moments, N+ densities can be swiftly reduced by three-body electron recombinations N+ + 2e → N + e and charge transfers N+ + 2N2 → N2 + N3+. Consequently, ion N+ is of the lowest density level of the calculated particles, in particular during time interval between the applied voltage pulses. Figure 8(a) presents time evolutions of axial distributions of ion N2+ densities under dg of 0.2 cm. It is clear that N2+ density appears as two peaks during rising and falling phases of applied voltage nearby the corresponding MC. Incorporation with figure 5(a), axial distributions of both the electrons and the dominant positive ions N2+, indicates that a cathode sheath and positive column can be formed at peak moments of the discharge current density in the pulsed nitrogen DBDs at atmospheric pressure. So the two short-pulse discharges in figure 3(a) can be regarded as the APGD [29]. It has been reported that the product of the pressure P and the gap distance d determines the ionization mechanism of the DBDs: for higher Pd values (Pd > 200 Torr cm) the formation of one electronic avalanche is large enough to create a sufficient amount of ions to get a space charge field of the order of magnitude of the applied field [32]. But the APGD is achieved under a lower Pd value in the present simulation. This should be attributed to higher dV/dt values of the pulsed voltages, which accelerate the formation and propagation of an electron avalanche and ionization wave. On the other hand, it has been pointed out that the typical gas gap of the APTD is less than 2 mm and the typical gas gap of the APGD is greater than 2 mm [32]. However, figures 5(b) and 8(b) show that, when dg rises to 0.6 cm both e and N2+ densities reduce by approximately two orders of magnitude, and there is no cathode sheath. This implies that for the dg of higher than 0.2 cm the discharge gap distance also significantly influences the discharge mode of the pulsed nitrogen DBDs.
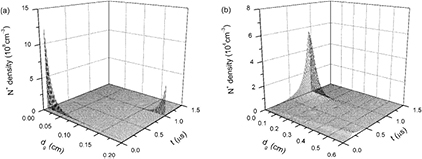
Figure 7. Time evolutions of axial distributions of ion N+ densities under discharge gap distances of (a) 0.2 cm and (b) 0.6 cm.
Download figure:
Standard image High-resolution image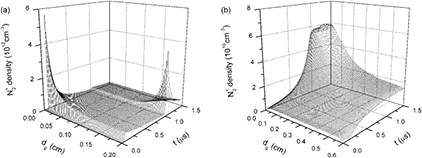
Figure 8. Time evolutions of axial distributions of ion N2+ densities under discharge gap distances of (a) 0.2 cm and (b) 0.6 cm.
Download figure:
Standard image High-resolution imageFigures 9 and 10 show different time evolutions of axial distributions of ion N3+ and ion N4+ densities. Comparing the two figures, there are apparent differences between the axial distributions of N3+ and N4+, which can be attributed to different production mechanisms of the two ions. N3+ ions are mainly generated by dissociative charge transfers (reactions 27 and 28), so the distributions of N+ and N2+ affect the distributions of N3+. Accordingly, maximums of N3+ densities are close to the MC under dg of 0.2 cm but locate near grounded electrode under dg of 0.6 cm. For N4+ densities, time evolutions of their axial distributions are different from those of any other charged and neutral species. Figure 10(a) clearly shows that N4+ densities near the MA are higher than those near the MC when dg is 0.2 cm. The reason for this is that N4+ ions can be produced not only by charge transfers between N2+ ions and N2 molecules, but also by Penning ionizations involving N2(A) and N2(a') molecules.

Figure 9. Time evolutions of axial distributions of ion N3+ densities under discharge gap distances of (a) 0.2 cm and (b) 0.6 cm.
Download figure:
Standard image High-resolution image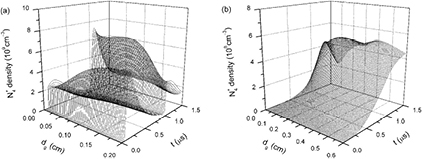
Figure 10. Time evolutions of axial distributions of ion N4+ densities under discharge gap distances of (a) 0.2 cm and (b) 0.6 cm.
Download figure:
Standard image High-resolution image3.3. Time evolutions of axial distributions of neutral particle densities
Time evolutions of axial distributions of ground state atom N densities and metastable state atom N(2D) densities under discharge gap distances of 0.2 cm and 0.6 cm are plotted in figures 11 and 12. Atom N could be produced through numerous reaction paths. Electron collisions of N2 (reactions 2 and 6) are significant in the production of N and the corresponding reaction-rate coefficients increase with the increase of electron temperature Te. The production paths of atom N also include ion–electron recombinations (reactions 19 − 21 and 23), but their reaction rate coefficients reduce with the increase of Te. Moreover, the reaction N2+ + N2(A) → N + N3+ with a rate constant of 3 × 10⁻¹⁰ cm3 s−1 and collisions between neutral molecules make contributions to the productions of N atoms. As a result, under the calculated dgs, atom N densities are at least two orders of magnitude higher than other particle densities and change slightly during the applied voltage period, as shown in figure 11, due to the abundant reaction paths and different types of reaction-rate coefficients. For metastable state N(2D) atoms, their densities partly depend on the electron density and electron temperature because the key producing mechanisms are electron collisional excitations with N2 or N (reactions 6 and 8). Consequently, N(2D) has complex time evolutions compared to N, as shown in figure 12.

Figure 11. Time evolutions of axial distributions of ground state atom N densities under discharge gap distances of (a) 0.2 cm and (b) 0.6 cm.
Download figure:
Standard image High-resolution image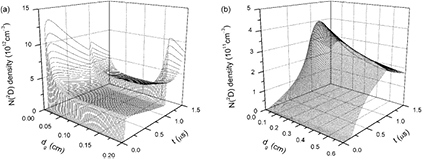
Figure 12. Time evolutions of axial distributions of metastable state atom N(2D) densities under discharge gap distances of (a) 0.2 cm and (b) 0.6 cm.
Download figure:
Standard image High-resolution imageFigures 13(a) and (b) illustrate time evolutions of axial distributions of metastable state molecule N2(A) densities under discharge gap distances of 0.2 cm and 0.6 cm, respectively. It can be seen that N2(A) densities are relatively high during pulse width in the whole discharge gap, which is in agreement with the experiment results of N2(A) density of the order of 1013 cm−3 for the DBDs in N2 [33]. Figures 14(a) and (b) give time evolutions of metastable state molecule N2(a') densities under dgs of 0.2 cm and 0.6 cm. In comparison with N2(A) densities, N2(a') densities are relatively low and swiftly decay after the peak moments of the discharge current density. In nitrogen discharges, it is well known that Penning ionizations involving the metastable state molecules N2(A) and N2(a') are the important ionization mechanisms. And however, the direct contributions of Penning ionizations to the increases of charged particle densities are relatively small because reaction rates of Penning ionizations are low and highly dependent on the metastable state molecule densities. On the other hand, N2(A) molecules can accumulate over several discharge periods because the lifetime of N2(A) is about 4 ms [6]. Therefore, the concentration of N2(A) can be high enough to become a key contributor to the plasma chemistry of the pulsed nitrogen DBDs, in particular providing seed electrons during discharge igniting phases.
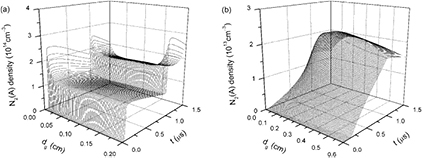
Figure 13. Time evolutions of axial distributions of metastable state molecule N2(A) densities under discharge gap distances of (a) 0.2 cm and (b) 0.6 cm.
Download figure:
Standard image High-resolution image
Figure 14. Time evolutions of axial distributions of metastable state molecule N2(a') densities under discharge gap distances of (a) 0.2 cm and (b) 0.6 cm.
Download figure:
Standard image High-resolution imageIt has been discovered in [34] that other metastable state nitrogen molecules N2(B) and N2(C) can be produced through N2(A) energy pooling reactions. Thus, metastable state molecules N2(B) and N2(C), as well as the corresponding reactions, have been taken into account in this work. Figure 15 gives time evolutions of axial distributions of N2(B) densities under different discharge gap distances. This figure shows that the distributions and evolution processes of N2(B) densities are similar to those of electron densities, which means that electron collisional excitations N2 + e → N2(B) + e play a dominant role in the producing of N2(B). Figure 16 gives time evolutions of axial distributions of N2(C) densities. It is clear that evolution processes of axial distributions of N2(C) densities are alike to those of N2(A) densities under the calculated dgs, indicating that the N2(A) energy pooling reaction N2(A) + N2(A) → N2(C) + N2 is an important reaction path to produce metastable state molecules N2(C) in the pulsed nitrogen DBDs.

Figure 15. Time evolutions of axial distributions of metastable state molecule N2(B) densities under discharge gap distances of (a) 0.2 cm and (b) 0.6 cm.
Download figure:
Standard image High-resolution image
Figure 16. Time evolutions of axial distributions of metastable state molecule N2(C) densities under discharge gap distances of (a) 0.2 cm and (b) 0.6 cm.
Download figure:
Standard image High-resolution image
4. Conclusion
In this work, particle densities of the pulsed DBDs in atmospheric-pressure nitrogen have been studied using a 1D fluid model. The simulated particles include electrons e, ions N+, N2+, N3+ and N4+, ground state atoms N, metastable state atoms N(2D), as well as metastable state molecules N2(A), N2(a'), N2(B) and N2(C). Averaged particle densities, time evolutions of axial distributions of particle densities and influences of discharge gap distance dg on the particle densities have been illustrated and discussed in detail. The calculation results show that averaged particle densities of the charged and neutral particles decrease with the increase of dg. For averaged particle densities of charged particles, averaged particle densities of e are lower than averaged particle densities of N2+, but higher than averaged particle densities of N+, N3+ and N4+. For averaged particle densities of neutral particles, the present calculation results of the nitrogen DBDs driven by the short-pulse voltages coincide with those of the nitrogen DBDs driven by the sinusoidal voltages. Averaged particle densities of N are higher than those of other neutral particles. Averaged particle densities of N2(A) are higher than those of other metastable state molecules because of the high rate constants of the radiative cascade reactions. On the other hand, the increase of dg significantly influences axial distributions of the particle densities. Time evolutions of axial distributions of e, N+ and N2+ densities show two peaks during rising and falling phases of applied voltage when dg is 0.2 cm but present gradual increases during pulse width when dg is 0.6 cm, which are similar to those of N2(a') and N2(B). Maximums of N3+ densities are close to the MC under dg of 0.2 cm but locate near grounded electrode under dg of 0.6 cm, which are alike to those of N2(A) and N2(C). Besides, N4+ densities nearby the MA are higher than those nearby the MC when dg is 0.2 cm, which are different from those of any other charged and neutral particles. Compared to N, N(2D) has low averaged particle densities and complex time evolutions.