
Abstract
We investigate the switching kinetics of oxygen vacancy (Ov) diffusion in La(5/8-y)Pr(y)Ca(3/8)MnO(3)-Ag (LPCMO–Ag) memristive interfaces by performing experiments on the temperature dependence of the high resistance state under thermal cycling. Experimental results are well reproduced by numerical simulations based on thermally activated Ov diffusion processes and fundamental assumptions relying on a recent model proposed to explain bipolar resistive switching in manganite-based cells. The confident values obtained for activation energies and the diffusion coefficient associated to Ov dynamics constitute a validation test for both model predictions and Ov diffusion mechanisms in memristive interfaces.
Export citation and abstract BibTeX RIS
1. Introduction
Resistive memories (ReRAMs) based on oxide's compounds are receiving a lot of attention in view of their potential use for the next generation of non-volatile memories. Its operation relies on the resistive switching (RS) effect, which is the change in resistance of the device between two different values, the high resistance state (HRS) and the low resistance state (LRS), by an appropriate electric stimulus [1, 2]. The transition from HRS to LRS is called a set while the opposite process is defined as reset.
A large variety of oxides have been explored for ReRAM applications, ranging from binary transition metal oxides [3–7] to complex ones—manganite and perovskite-like [8–14].
In the case of devices based on complex oxides, the emerged consensus points to voltage-driven ion migration toward the metal–electrode interfaces as the relevant mechanism controlling bipolar RS, i.e. the switching mode dependent on voltage polarity [2]. In particular, oxygen vacancies (Ovs) have been proposed as the active agents participating in the bipolar RS effect [15–19].
The introduction of dopants for the improvement of ReRAM has also been reported consistently. As an example, the efficiency of Ov migration by Nb doping Ba0.7Sr0.3TiO3 (BST) thin films, was tested in [20]. As stated in that work, the distribution of defects is strongly related to the RS properties, assisting Ov migration and making the ReRAM operation more efficient.
Although the exact microscopic origin behind the RS effect remains elusive, a recent phenomenological model, named the voltage enhanced oxygen vacancy (VEOV) migration model [21], succeeded in reproducing many non trivial characteristics of bipolar resistive switching found in experiments with complex oxides [12, 13, 22]. The VEOV model incorporates as main ingredients:
- the drift/diffusion of Ov along highly resistive metal/oxide interfaces, where strong electric fields are developed;
- a linear relation between resistivity and Ov concentration;
- the main contribution to the resistance comes from the density of oxygen vacancies in a region near the electrodes.
Depending on the polarity of the electric field during a switching operation, vacancies may accumulate or void nano-sized regions at the metal/electrodes interfaces, giving a place to the reset and set transitions, respectively. In spite of the success of the VEOV model in reproducing many experimental features of bipolar RS, the drift/diffusion of Ov has only been tested indirectly [12, 14].
The goal of the present work is to probe the switching kinetics proposed in the VEOV model, by studying the response of the switched high resistance state under thermal cycling in a manganite (LPCMO)–Ag device. Nian et al [15] studied the relaxation time of the HRS at a fixed temperature for different temperatures in samples of Pr0.7Ca0.3MnO3. Assuming a linear relation between resistance and Ov density, they estimated, e.g. the activation energy of vacancy diffusion. In section 2, we not only reproduce the same type of measurements on samples of La5/8 − yPryCa3/8MnO3, but we go a step further by varying sample temperature in a controlled manner during the experiments. We shall show that diffusion can be either activated by increasing temperature or 'frozen' by decreasing it.
In section 3 we put forth a simplified model of oxygen vacancy diffusion. As we shall show in section 4, our model fits experimental data quite well and allows us to extract confident values for the activation energy and diffusion coefficient associated to Ov dynamics. We close this manuscript with some conclusions in section 5.
2. Experimental results
We conducted experiments on two manganites La5/8 − yPryCa3/8MnO3 (LPCMO)-based samples. Contacts were made by depositing drops of silver paint of 1–2 mm diameter over the LPCMO pellet. Sample fabrication and some of its characteristics were presented by Levy et al [23]. Moreover, the bipolar RS behaviour of this compound has been broadly studied [11–14, 21, 22, 24]. Each sample was coupled to a different heating stage (see figure 1) in order to perform two completely independent analyses in different laboratories. In setup #1 temperature was controlled by a LakeShore 331 Temperature Controller, having an error lower than 1 K. Setup #2 consisted of an ad hoc heating stage based on a Peltier cell controlled by an Arduino board.
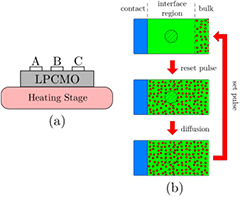
Figure 1. (a) Scheme of the experimental setup. (b) Model description and proposed mechanism described in the text. While the sample is in the LR state, Ov are mostly in the bulk. Under a reset pulse, the Ov move to the interface region and the HR state is attained. However, there is a region (shadow area in the figure) which still remains void of vacancies. When the pulse is switched off, the temperature activated diffusion process can further increase the interface resistance by the infilling of Ov in the previously void region.
Download figure:
Standard image High-resolution imageThe inset of figure 2 presents an example of the evolution of the resistance in setup #2 after setting the high resistance state at a fixed temperature (353 K). As it can be observed, resistance evolves in time even in the absence of an external stimulus. Indeed, based on the main assumptions of the VEOV model, we may hypothesize that, even after the reset pulse has been applied, oxygen vacancies continue diffusing into a region near the interface and, hence, resistance changes. In section 4 we shall come back to figure 2 and we shall estimate the activation energy of Ov diffusion by analysing the temporal evolution of resistance at constant temperature.

Figure 2. Diffusion coefficient as a function of temperature. The activation energy obtained is (0.18 ± 0.03) eV. Inset: time evolution of the HR state at 353 K. Two consecutive diffusion processes are observed at this temperature.
Download figure:
Standard image High-resolution imageFigures 3–4 present results corresponding to more complex experiments where the temperature was continuously varied. The general procedure employed consisted on the application of a reset pulse at an initial temperature and then recording the resistance of a single interface—RA corresponding to contact A in figure 1(a)—during several cyclic temperature sweeps. For each temperature, resistance was determined by applying a small bias current between terminals A and C and measuring the voltage drop between A and B.

Figure 3. Experimental results for setup #1 showing the temperature behavior of the contact HR, RA(T). The arrow indicates the starting direction. At T ≳ 373 K the sample is fully diffused. The solid blue line is the model fit. Inset: time evolution of RA(T), model fit and temperature (red dashed-line). Temperature was swept from 323 K to 455 K at a rate of ± 10 K min−1 using a LakeShore 331 Temperature Controller.
Download figure:
Standard image High-resolution image
Figure 4. Experimental results for setup #2 showing the temperature behavior of the contact resistance RA(T). The arrow indicates the starting direction. The sample continues the diffusion process for more than one cycle. The solid blue line is the model fit. Inset: time evolution of RA(T), model fit and temperature (red dashed-line). Temperature was swept from 303 K to 373 K at a rate of up to ± 6 K min−1 by heating the sample with a Peltier cell controlled by an Arduino board.
Download figure:
Standard image High-resolution image
In figure 3 we present results corresponding
to setup #1. We swept the temperature from 323 K to 455 K with a rate
of ± 10 K min−1. Results are plotted on a semi-log
scale versus
 .
As it can be seen, during the last temperature cycle, resistance measurements appear to fall on
a line. These results are consistent with the variable range-hopping (VRH) model [25]. Indeed, VRH postulates that the dependence of
resistance with temperature is given by
.
As it can be seen, during the last temperature cycle, resistance measurements appear to fall on
a line. These results are consistent with the variable range-hopping (VRH) model [25]. Indeed, VRH postulates that the dependence of
resistance with temperature is given by

where the characteristic temperature T0 depends on the localization of the charge carriers and R0 is a scaling factor. Although the temperature range of our experiments is far too small to rule out other transport mechanisms, variable range hopping has been proposed as a conduction mechanism for manganites in the paramagnetic region [26–28]. VRH, however, cannot explain the unexpected path followed by the resistance during the first heating ramp. The initial deviation from VRH may be explained by the diffusion of oxygen vacancies towards the interface, as in the case of figure 2.
We repeated the experiment with setup #2, this time with temperature in a narrower range from 303 K to 373 K, varying with a rate of up to ± 6 K min−1. Results are presented in figure 4. A qualitative similar behaviour is obtained: resistance deviates from the VRH prediction only during the first temperature cycle. Again, we may find a qualitative explanation of the observed behaviour by assuming that oxygen vacancies continue pouring into a region close to the interface after the external stimulus has disappeared. Furthermore, Ov diffusion is alternatively activated or 'frozen' by either increasing or decreasing the temperature, respectively. Extending these ideas, in the following section we put forth a simplified quantitative Ov diffusion model that accounts well for the observations in figures 2–4.
3. Diffusion model
Based on the predictions of the VEOV model, our interpretation of the observed behaviour is the following: the negative polarity of the reset pulse forces oxygen vacancies to move from the bulk to the interface region, increasing its resistance RA [12]. However, the Ov distribution is far from equilibrium because the reset pulse does not succeed in introducing vacancies homogeneously in all the interface and some nanoscale regions remain void of vacancies. After the reset pulse, the dynamics is governed by diffusion. At room temperature, the diffusion coefficient D(T) for Ov is too small to effectively compensate for the density gradient obtained as a consequence of the reset pulse. As temperature is raised, D(T) rapidly increases enabling former void regions to be infilled with vacancies, thus producing the concomitant increase in resistance. This process lasts until the steady configuration is attained. A picture of the proposed mechanism is shown in figure 1(b).
To be definite we proposed a very simplified 1D model of vacancy diffusion near the interface. Calling x to the spatial coordinate, we model the interface as the interval −L < x < L. We further assume that, after the reset pulse, Ov density n is constant everywhere but in a void region (−xo , +xo ),
t is the time. We do not expect the results to be qualitatively different for a different choice of n(x, t = 0), as long as it contains a strong discontinuity. In addition the extension to the 2D and 3D is straightforward in Cartesian coordinates. Vacancy infilling dynamics are governed by Fick's second law,
The diffusion coefficient D(T) is thermally activated with
activation energy 
where the prefactor D0 is the diffusion coefficient at infinite T and kB the Boltzmann constant.
Following the VEOV model assumption, we then consider a linear dependence between the value of R0 in (1) and the total number of vacancies in the formerly void region,

where R'0 and B are two arbitrary values.
Solving equations (1)–(5), we obtain that
where
4. Model fit
We fit (6) to the experimental
measurements of RA (see figures 3–4). First,
 was obtained from stable regions in the experiments presented in figures 3 and 4,
i.e. long after transients have passed. Fitted values of
was obtained from stable regions in the experiments presented in figures 3 and 4,
i.e. long after transients have passed. Fitted values of
 were in the range of [45, 57] K1/4. These values are not far from those reported
in [26]. Using (6), we then looked for the values of
xo
/L,
D0/L2 and which
minimized the mean square error between the experimental results and simulated values. As it can
be seen in figures 3–4, the simple model in section 3 fits experimental data well.
were in the range of [45, 57] K1/4. These values are not far from those reported
in [26]. Using (6), we then looked for the values of
xo
/L,
D0/L2 and which
minimized the mean square error between the experimental results and simulated values. As it can
be seen in figures 3–4, the simple model in section 3 fits experimental data well.
Among different experiments, we obtained
xo
/L ∼ 0.5. In
the case of —the height of the barrier that maintains the system in
a metastable out-of-equilibrium condition immediately after the writing pulse—we got
values ranging between 0.2–1.3 eV. As a reference, Nian et al [15] estimated 0.4 eV for another manganite.
Regarding the dispersion in the values, we hypothesize that it is evidencing a broad
distribution of anchoring energies instead of the mono-energetic level considered in our model.
Moreover, experimentally we have little control (if any) in the way this broad distribution of
states is infilled.
Extracting D0/L2 is not
straightforward because it is exponentially affected by the estimated value of
. In fact, there is a strong nonlinear covariance between
and D0/L2 in
the proposed minimization method. Therefore, we estimated
D(T)/L2 from the measured time
evolution of resistance for a fixed temperature and the first term in (6). In the inset of figure 2, we present an example of the evolution of the
resistance after setting the HR state at 353 K. We hypothesize that the two successive
exponential-like-increase intervals could correspond to the sequential infilling of two
vacancy-void regions. Indeed, we also obtained good fits (not shown here) of figures 3–4
with a two-vacancy-void-region model. Figure 2
displays the results for six temperatures (two measurements for each temperature) together with
the fit from which we extracted ∼ 0.2 eV,
D0/L2 ∼ 90 s−1.
A value of
D0 ∼ 2 · 10−7 cm2 s−1
is obtained by setting L = 500 nm, which is fully consistent
with reported oxygen diffusion constant in perovskite-based oxides [15, 29].
5. Conclusions
By performing temperature sweeps of the high resistance state in a perovskite-based memristive interface, and relying on simple assumptions of the VEOV model, we extracted confident values of relevant parameters involved in the kinetics of Ov diffusion. We found that the electric pulse might set the system in a metastable configuration that relaxes after overcoming a barrier of 0.2—1.3 eV. In addition the estimated diffusion coefficient values for Ov are consistent with the literature. Our results support a switching dynamics consistent both with the VEOV model and the assumption of a linear relation between resistivity and Ov concentration in regions near the electrode interface [21].
Finally, the metastability here reported could be also further exploited in resistive switching binary memories, as it actually increases the resistance of the high resistance state (i.e. it improves the ON/OFF ratio).
Acknowledgments
This work was partially supported by CONICET (PIP 11220080101821), Agencia Nacional de Promoción Científica y Technológica (ANPCyT) (PICT-2010 # 121), Fundación Balseiro and ITBA (ITBACyT-2013 # 6). We acknowledge P Levy and G Leyva for providing the LPCMO samples, and for the use of facilities at GIA-CAC-CNEA, Argentina. PS acknowledges the Ramón y Cajal program (RYC-2012-01031). GAP and PIF acknowledge F Sangiuliano Jimka for lab assistance. The authors would like to thank M Rozenberg, F Gomez-Marlasca, N Ghenzi, C Acha and D F Grosz for useful discussions.