


ABSTRACT
Four supernovae (SNe), exploding ⩽300 pc from Earth, were recorded 44, 37, 32, and 22 kyr ago in the radiocarbon (14C) record during the past 50 kyr. Each SN left a nearly identical signature in the record, beginning with an initial sudden increase in atmospheric radiocarbon, when the SN exploded, followed by a hiatus of 1500 yr, and concluding with a sustained 2000 yr increase in global radiocarbon due to γ-rays produced by diffusive shock in the SN remnant (SNR). For the past 18 kyr excess radiocarbon has decayed with the 14C half-life. SN22kyrBP, is identified as the Vela SN that exploded 250 ± 30 pc from Earth. These SN are confirmed in the 10Be, 26Al, 36Cl, and NO geologic records. The rate of near-Earth SNe is consistent with the observed rate of historical SNe giving a galactic rate of 14 ± 3 kyr−1 assuming the Chandra Galactic Catalog SNR distribution. The Earth has been used as a calorimeter to determine that ≈2 × 1049 erg were released as γ-rays at the time of each SN explosion and ≈1050 erg in γ-rays following each SN. The background rate of 14C production by cosmic rays has been determined as 1.61 atoms cm−2 s−1. Approximately 1/3 of the cosmic ray energy produced by diffusive shock in the SNR was observed to be emitted as high-energy γ-rays. Analysis of the 10Be/9Be ratio in marine sediment identified 19 additional near-Earth SNe that exploded 50–300 kyr ago. Comparison of the radiocarbon record with global temperature variations indicated that each SN explosion is correlated with a concurrent global warming of ≈3°C–4°C.
Export citation and abstract BibTeX RIS
1. INTRODUCTION
Enrico Fermi (1949) proposed the production of cosmic rays by diffusive shock acceleration at the outer front of expanding supernova remnants (SNRs). This prediction has recently been confirmed in observations by the Fermi Large Area Telescope collaboration (Ackerman et al. 2013). Detailed calculations have suggested that most of the SN explosion energy is converted into cosmic rays over a period of many centuries (Hillas 2005; Ellison et al. 2004; Berezhko et al. 2002). It was calculated (Berezhko et al. 2002) for the SN1006 supernova that ≈3 × 1050 erg, 60% of the explosion energy, was released as cosmic rays. Hadronic cosmic rays, mostly protons, diffuse slowly out of the SNR radiating from 1%–50% of their energy as secondary, high energy γ-rays (Povinek & Tokar 1979) by bremsstrahlung, pion decay, and inverse Compton processes. At the time of the SN explosion γ-rays with Eγ < 20 GeV may be produced as the high energy particles in the relativistic shock wave breaks through the SN envelope (Colgate & White 1968). It has been predicted (Povinek & Tokar 1979) that γ-rays emitted from a SN exploding 1 kpc from Earth would increase atmospheric radiocarbon by 1%–2% at the time of the explosion. Much later, cosmic γ-rays with energies up to Eγ > 100 TeV are produced over a period of <104 yr, as particles accelerated in the SNR interact with the explosion and swept-up mass and the ISP gas (Dermer & Powale 2013). Explosions of near-Earth SNe will subsequently deposit substantial amounts of γ-ray energy into Earth's atmosphere producing 14C and other cosmogenic isotopes that are subsequently recorded in Earth's geological record. This suggests that the Earth is an optimum calorimeter for quantitatively detecting the cosmic gamma ray emission following nearby SN explosions.
During the past millennium approximately six SNe are known to have exploded within ≈3 kpc of Earth. These SNe were reported in historical records from Asia and Europe (Green 2004) and are listed in Table 1. Terrestrial evidence of these SNe were also observed in the thermoluminescence analysis of Tyrrhenian Sea sediment profiles (Castagnoli et al. 1982). Castagnoli et al. estimated that the local cosmic ray energy influx from SN1054 (2.0 kpc) was 106 erg cm−2 corresponding to a total energy release of ≈4 × 1050 erg. Sudden increases in nitrate abundance in Antarctic ice cores (Rood et al. 2003; Dreschhoff & Laird 2006), from hard SN x-rays and γ-rays, have also been observed at the times of five of the six historic SNe. It was reported that an 0.61 ± 0.16% increase in tree ring radiocarbon (Damon et al. 1995) followed the explosion of SN1006, that occurred 1.56 kpc from Earth (Jiang & Zhao 2007), which is consistent with the prediction of Povinec and Tokar.
Table 1. Historical Supernovae
| Date | Location | Common | Dist. |
|---|---|---|---|
| Name | (kpc) | ||
| 1006 Apr 30 | Lupus | SN 1006 | 1.56a |
| 1054 Jul 4 | Taurus | Crab | 2.0 |
| 1181 Aug 6 | Cassiopeia | SN 1181 | 3.2 |
| 1572 Nov 6 | Cassiopeia | Tycho | 2.3 |
| 1604 Oct 9 | Ophiuchus | Kepler | 2.9 |
| 1671b | Cassiopeia | Cas A | 3.4 |
Notes. Data compiled by David Green (Green 2004). aFrom Jiang & Zhao (2007). bNot recorded historically. The age is from the expansion rate of the SNR.
Download table as: ASCIITypeset image
Nearby Type II SNe are expected to occur in regions of active star formation such as the twelve OB star associations that lie within 650 pc of Earth (de Zeeuw et al. 1999). For example, Scorpius-Centaurus OB, 116–144 pc from Earth (Hernandez et al. 2005), contains 6 stars with more than 10 solar masses (Preibisch et al. 2002). It is estimated (Benítez et al. 2002) that ≈20 SNe, <130 pc from Earth, have exploded during the past 11 million years. Assuming SNe are randomly distributed throughout the nearby regions of the galactic disk, based on the historical SN rate, we would expect ≈3 SNe to have exploded within 300 pc of Earth during the past 50 kyr.
In 1949 Libby et al. (1949) developed the radiocarbon dating method for dating fossil carbon. Radiocarbon is produced primarily by the 14N(n,p)14C nuclear reaction from secondary neutrons generated by cosmic ray interactions with the atmosphere. Radiocarbon reaches equilibrium between atmospheric, terrestrial and oceanic carbon reservoirs via the global carbon cycle (Schimel 1995), as described in Figure 1, and is retained in annual tree ring and sediment records. The atmospheric 14C reservoir is small, containing ≈2% of global radiocarbon, so sudden changes in the cosmic ray rate can change atmospheric radiocarbon abundance rapidly. However, ≈12% of atmospheric radiocarbon exchanges annually with the much larger ocean 14C reservoir, so atmospheric radiocarbon quickly returns to global levels. The global 14C abundance can only increase in response to truly massive cosmic ray events, in which case the high levels of radiocarbon will persist in all reservoirs until it decays away with a 5730 yr half-life.

Figure 1. Global carbon cycle (Schimel 1995). The atmospheric, terrestrial, and ocean carbon pools are in equilibrium. The carbon reservoirs and annual exchange rates are given in billions of metric tons. Volcanic activity (not shown) contributes 2 metric tons to the atmosphere. Radiocarbon (14C) is in equilibrium with global carbon and the radiocarbon abundance in the pools can be determined by multiplying by 1.2 × 10⁻¹² (Roberts & Southon 2007).
Download figure:
Standard image High-resolution imageLibby assumed that the radiocarbon abundance, 14C/C, in living organisms was always constant so that the age of a fossil could be determined simply by measuring the amount of 14C remaining following its death. Soon it became apparent, when comparing with alternate dating methods, that 14C/C was much larger in the past. This required the direct determination of earlier radiocarbon abundance calibration data in order to accurately date fossils. The higher 14C/C ratio indicates that the cosmic ray rate striking the atmosphere was much larger at earlier times. This can occur if Earth's magnetic field was much lower in the past (Elsasser et al. 1956), there was a massive solar flare, a γ-ray burst or galactic core explosion occurred, or a near-Earth SN exploded. For example, a significant increase in global radiocarbon might be expected to occur following the explosion of the Vela SN 250 ± 30 pc from Earth (Cha et al. 1999). In this paper I will explore the radiocarbon geologic record for evidence of Vela SN and other recent, near Earth cosmic ray producing events.
2. RESULTS
The IntCal working group was established to set the criteria for acceptance of data into the radiocarbon calibration data set (Reimer et al. 2002) that is used to correct radiocarbon dates for the actual amount of 14C in the atmosphere in the past. Figure 2 shows the excess radiocarbon, Δ14C(%) for the past 50 kyr. The original relative normalization scale, Δ14C(%) = 0.0 in 1950, was set arbitrarily at the beginning of the nuclear age and has been adjusted in this work to an absolute scale based on the analysis discussed below. Data for 0–26 kyr BP in Figure 2(a) are from the INTCAL04 radiocarbon calibration (Reimer et al. 2003), based on tree ring (0–12.4 kyr BP) and marine sediment (12.4–26.0 kyr BP) records. Data for 26–50 kyr BP (Hughen et al. 2004) in Figure 2(b) are based on measurements of a Cariaco Basin ocean core off of the coast of Venezuela. The Δ14C(%) values from Hughen et al. were systematically lower than the INTCAL04 data and have been increased by 22.5% to coincide with INTCAL04 results at 26 kyr BP. A more recent radiocarbon calibration, INTCAL09 (Reimer et al. 2009), published for 0–50 kyr BP, has been rejected in this analysis. These data are comparable to INTCAL04 for 0–26 kyr BP, but significant differences exist for the earlier data. The INTCAL09 evaluation combines numerous discrepant measurements by using a Markov Chain Monte Carlo (MCMC) approach to fit the data leading to rapid, nonphysical fluctuations in Δ14C(%) that appear to arise from the fitting procedure.
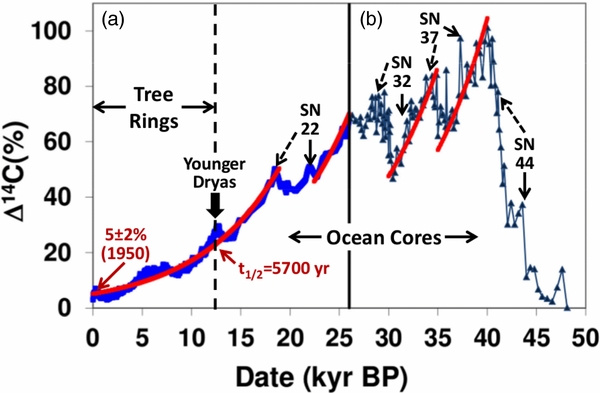
Figure 2. Radiocarbon record for the past 50 kyr. Δ14C(%) data are (a) based on tree ring (12.4–0 cal kyr BP) and corals and foraminifera in ocean cores (26.0–12.4 cal kyr BP), from INTCAL04 (Reimer et al. 2003) and (b) based on the Cariaco Basin ocean core from Hugh et al. (Hughen et al. 2004) (26–50 cal kyr BP). The data from Hugh et al. were renormalized to match the INTCAL04 Δ14C(%) values at 26 cal kyr BP. Relative uncertainties in the data are seen in the scatter of adjacent data points. Four sudden increases in Δ14C(%) are observed 44, 37, 32, and 22 kyr ago, indicated by solid arrows, each followed by broader increases continuing for several kyr, indicated by dashed arrows. These radiocarbon increases are ascribed to SN, and SN22kyrBP has been associated with the Vela SN. The excess 14C produced by each SN decreases with the expected 5730 yr half-life as indicated by the red curves. Decay of 14C during the past 18 kyr establishes an absolute normalization for Δ14C(%)0 in 1950 of 5% ± 2%. An additional increase in Δ14C(%) that occurred 13 kyr ago does not appear to be related to a SN explosion.
Download figure:
Standard image High-resolution image2.1. 26–0 kyr Radiocarbon Data
The quantity of excess radiocarbon, Δ14C(%), appears to decrease exponentially during the period from 18–0 kyr BP, albeit with minor oscillations. This implies that a large pool of excess global radiocarbon has been decaying for a long time. These data can be fit to the exponential decay formula

where the half-life t1/2 = ln (2)/λ and Δ14C(%)0 is the amount of excess radiocarbon in 1950. A least-squares exponential fit to the 18–0 kyr Δ14C(%) data gives t1/2 = 5700 ± 700 yr, which is consistent with the recommended 14C half-life (t1/2 = 5730 ± 40 yr) (Godwin 1962). The fit also gives Δ14C0 = 5% ± 2%, which would be the first determination of an absolute scale for global radiocarbon abundance in 1950.
2.1.1. Earth's Magnetic Field Effects
Small oscillations about the Δ14C(%) decay curve for the past 18 kyr are seen in Figure 2(a) and can be explained by fluctuations in Earth's magnetic field. To test this hypothesis, the variations between the fitted decay curve and the measured Δ14C(%) values are compared with the measured fluctuations in the magnitude of Earth's Virtual Axial Dipole Moment (VADM; McElhinny & Senanayake 1982) in Figure 3. The VADM was independently determined from the remnant magnetism in well dated sediments from the past 12 kyr. The fluctuations in Δ14C(%) are inversely proportional and well correlated with the strength of Earth's magnetic field. This is consistent with the strength of Earth's magnetic field modulating the intensity of cosmic rays that can strike the Earth. The variations in the cosmic ray rate striking the Earth due to oscillations in the magnetic field changes Δ14C(%) by only ±2%, which is small compared to Δ14C(%) = 70%, 26 kyr ago.

Figure 3. Correlation between oscillations in the 14C decay rate and variations in Earth's magnetic field. The differences between Δ14C data and the fitted exponential decay curve for the past 12 kyr are compared with variations in Earth's Virtual Axial Dipole Moment (VADM; McElhinny & Senanayake 1982). Excess radiocarbon varies inversely with the changes in VADM, which is consistent with a weaker magnetic field shielding the Earth less effectively from cosmic rays.
Download figure:
Standard image High-resolution image2.1.2. Detection of the Vela SN
Figure 2(a) shows that a sudden increase in Δ14C(%) occurred 22 kyr ago and was followed by a second, broader increase 20–18 kyr ago. This is consistent with the explosion of a near-Earth SN 22 kyr ago, referred to here as SN22kyrBP, that produced a rapid initial increase in atmospheric radiocarbon from γ-rays emitted at the time of the explosion followed by a prolonged increase in global radiocarbon later from the γ-rays produced by secondary reactions of accelerated hadronic cosmic rays with the accumulated mass in the SNR. The second increase in global 14C is followed by the decay of accumulated 14C with a 5730 yr half-life as described earlier.
The date of SN22kyrBP is consistent with the age of the Vela SN as determined from both its pulsar distance to the SNR (18 ± 9 kyr) (Aschenbach et al. 1995) and SNR size (31 ± 6 kyr) (Chanmugam et al. 1995), but it is inconsistent with the 11 kyr age derived from the pulsar spin-down rate (Strom et al. 1995). The spin-down value may be unreliable due to sudden variations in the magnetic field of a young pulsar (Chanmugam et al. 1995) and is ruled out by the lack of evidence for an SN at that time in the radiocarbon record. Figure 2 also shows that Δ14C(%) was 27% higher 26 kyr ago than immediately before the SN22kyrBP explosion suggesting that additional, earlier near-Earth SNe have contributed to the excess radiocarbon abundance.
2.2. 50–26 kyr Radiocarbon Data
Figure 2(b) shows that radiocarbon abundance was similar to modern times >44 kyr ago. Global radiocarbon suddenly doubled 44–40 kyr BP, presumably from a SN referred to here as SN44kyrBP. This increase was previously ascribed to geomagnetically modulated changes in the cosmic ray flux (Hughen et al. 2004) associated with the Laschamp and Mono Lake geomagnetic excursions (Beck et al. 2001; Masarik & Beer 1999) and/or interruptions in ocean circulation. Those explanations are inadequate because in order for the large pool of global radiocarbon to increase so rapidly it would require a 7-fold increase in the rate of 14C production as shown in Figure 4. That rate greatly exceeds the maximum 2–3-fold increase in the rate of radiocarbon production calculated (Masarik & Beer 1999) assuming Earth's magnetic field were to completely disappear during that entire time. A 3-fold increase in the rate of 14C production would require 16 kyr for Δ14C(%) to double. There is no evidence that Earth's magnetic field has ever disappeared for such a long time. A shutdown of the ocean circulation could temporarily increase the accumulation of radiocarbon in the atmosphere, but when carbon cycling resumed this would rapidly restore radiocarbon to its normal equilibrium as 12% of atmospheric carbon is exchanged annually with the much larger ocean (Schimel 1995) reservoir. After global radiocarbon doubled 44–40 kyr ago it remained continuously high, with modest fluctuations, for many thousands of years indicating that the increase did not simply occur in the small atmospheric radiocarbon reservoir, but in the entire global radiocarbon pool. Similar sudden increases in Δ14C(%) are also seen 37–33 kyr (SN37kyrBP) and 32–28 kyr (SN32kyrBP) ago in Figure 2(b). Each is followed by the decay of excess radiocarbon with the 14C half-life. A total of four near-Earth SNe are proposed to have exploded during the past 50 kyr, which is comparable to the rate expected from historical observations.
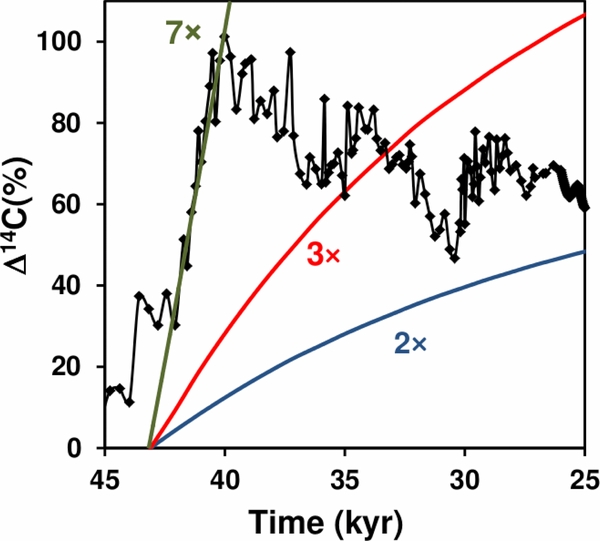
Figure 4. Increase in global radiocarbon for various cosmic ray rate assumptions. The calculated increase in Δ14C(%) assuming sustained 2-fold, 3-fold, and 7-fold increases in the cosmic ray rate at the top of the atmosphere are compared to the observed increase beginning 44 kyr ago. The large increase in Δ14C(%) is consistent with a 7-fold annual increase in the cosmic ray rate but inconsistent with the maximum possible 2–3 fold increases calculated by Masarik and Beer (Masarik & Beer 1999) assuming Earth's magnetic field were to vanish. A 2-fold increase in the cosmic ray rate would require 16 kyr for Δ14C(%) to increase by the amount observed 44–40 kyr ago.
Download figure:
Standard image High-resolution image2.3. Comparison of the Near-Earth SN
The relative increases in Δ14C(%) from the four near-Earth SNe can be compared on a common, renormalized scale. In Figure 5 the decay of 14C from earlier events has been subtracted and total integrated Δ14C(%) renormalized to that of SN44kyrBP. The time scale has been adjusted to t = 0 at the time of each SN explosion. The pattern of Δ14C(%) production for each of the SNe is remarkably similar, as if they were standard candles. Each SN can be described by a sudden increase in Δ14C(%) at the time of the explosion, followed by a quiescent period of ≈1500 yr during which little additional radiocarbon was produced, and culminating with a rapid production of 14C for 2000 yr. Then the excess accumulated 14C decays with a 5730 yr half-life. The most recent SN22kyrBP radiocarbon data have the highest statistical precision, while data from earlier SN have progressively poorer precision as the amount of remaining 14C decreases. The uncertainties in the relative SN Δ14C(%) measurements shown in Figure 5 can be estimated by the fluctuations in adjacent data points.
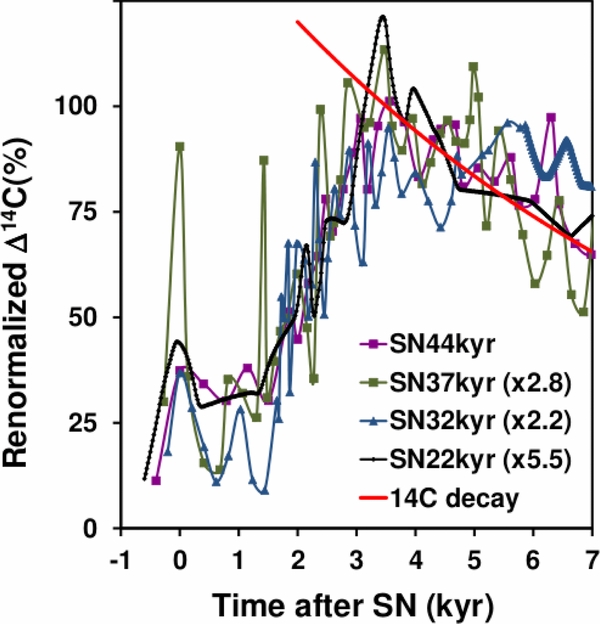
Figure 5. Comparison of radiocarbon production patterns four the four prehistoric SNe. The initial time t = 0 for each event is the time of the initial SN explosion. The Δ14C(%) data have been renormalized to the SN44kyrBP data by a factor shown in the legend. The background of 14C decay from earlier SN has been subtracted. In each case there is a sudden increase in Δ14C(%) from cosmic γ-rays emitted at the time of the SN explosion, followed by a 1500 yr hiatus, and concluding with a steady increase in radiocarbon for 2000 yr from cosmic γ-rays induced by the interaction of cosmic rays produced by diffusive shock acceleration in the SNR and interacting with the accumulated SNR mass. This is followed by a decrease in Δ14C(%) with the 14C half-life (red line). The data for SN22kyrBP are most precise with statistical uncertainties falling within the data points. Statistical uncertainties for the earlier SN are consistent with the scattering of values around the SN22kyrBP data. The pattern of radiocarbon increase for each SN is nearly identical as if they are standard candles.
Download figure:
Standard image High-resolution image2.3.1. Distances of the Near-Earth SNe
The strong similarity in radiocarbon production for the four near-Earth SNe suggests that the distance of each SN from Earth can be estimated assuming that 14C production is inversely proportional to the square of the SN distance from Earth. If SN22kyrBP is the Vela SN that exploded 250 pc from Earth, and each SN emitted comparable γ-ray energy, then the distance of the other SNe can be determined. These assumptions indicate that SN44kyrBP exploded ≈110 pc, SN37kyrBP ≈180 pc, and SN32kyrBP ≈160 pc from Earth. The absolute increases in Δ14C(%) for each SN used to estimate the SN ages are shown in Table 2. The assumption that each SN emitted comparable amounts of γ-ray energy may be arbitrary, requiring further investigation, although any significant variation in luminosity could lead to less reasonable SNe distances.
Table 2. Data for Four Prehistoric Supernovae Observed in the Radiocarbon, 10Be, and NO Records
| Date | Distancea | Δ14Cb | Δ14Cc | NO |
10B/9Bee |
|---|---|---|---|---|---|
| (kyr BP) | (pc) | (%) | (%) | (ppb) | (×10−6) |
| 44 | ≈110 | 100 | 26 | 21 | 1.2 |
| 37 | ≈180 | 36 | 19 | 14 | 3.4 |
| 32 | ≈160 | 45 | 7 | 6 | 2.4 |
| 22 (Vela SN) | 250 ± 30 | 18 | 6 | 9 | 2.2 |
Notes. aCalculated from increases in global 14C assuming 1/r2 dependence on distance with respect to SN22kyrBP. bIncrease in global radiocarbon corrected for decay from 14C produced by previous SN. cIncrease in atmospheric radiocarbon at the time of the SN explosion. dNitrate increase at the time of the SN observed in Antarctic Taylor Dome ice (Mayewski et al. 1996). eIncrease in 10Be/9Be observed at the time of the SN in ocean sediments from the Southeastern margin of New Guinea (Leduc et al. 2006).
Download table as: ASCIITypeset image
2.4. Other Radiocarbon Events
The radiocarbon record is rife with small, sudden increases in 14C of order 1%–2%, as shown for the interval of 1–3 kyr BP in Figure 6. Some of these increases may be associated with more distant SNe, although it is likely that others are due to explosions in the center of the galaxy, γ-ray bursts, solar flares, or other celestial phenomena. Some may be due to interruptions in the global carbon cycle when excess radiocarbon may accumulate in the atmosphere. One such event was previously reported to occur around 774–775 AD, based on the analysis of radiocarbon in Japanese cedar tree rings (Miyake et al. 2012). This event is also seen in the INTCal04 radiocarbon record. It is not clear whether this event is from the explosion of a near-Earth SN, although it may be related to the "red crucifix" seen in Britain's evening sky in 774 AD (Lovett 2012). Atmospheric radiocarbon increased by about 1.2%, which is 1/5 of the increase observed for SN22kyrBP and would correspond to SN774 exploding 560 pc from Earth.
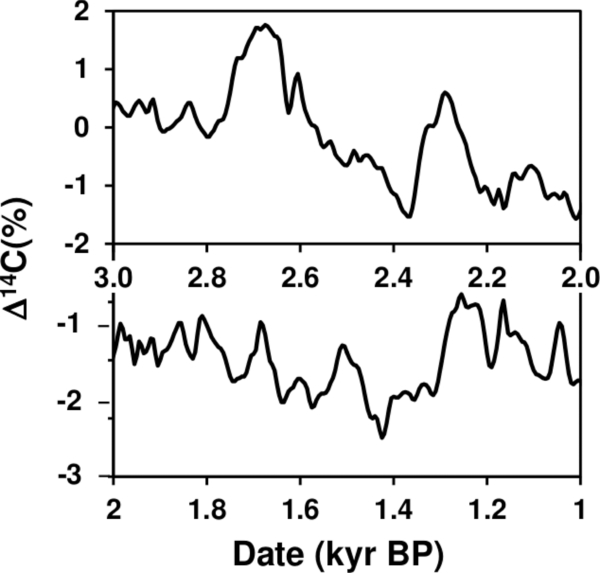
Figure 6. Numerous, additional, small sudden increases in Δ14C are observed throughout the radiocarbon record. For example, at least nine increases of 1%–2% are seen in the interval from 1–3 kyr BP. These events may correspond to more distant SNe, explosions in the center of the galaxy, γ-ray bursts, solar flares, or interruptions to the global carbon cycle.
Download figure:
Standard image High-resolution imageA much larger 6% increase in radiocarbon is seen in Figure 7 about 13 kyr ago near the onset of the Younger Dryas, a 1300 yr period of severe global cooling. Unlike the increases ascribed to earlier SNe, this event is characterized by a steady increase in radiocarbon for ≈500 yr followed by a steady decrease to previous levels. Although this event appears to have increased atmospheric radiocarbon significantly, the increase is not as sudden as for the other SN and it is not followed by a second, large radiocarbon increase from γ-rays produced in a SNR. One possible explanation is that this increase is due to interruption of North Atlantic ocean circulation (Broecker 2006). It has also been proposed that the cause of the Younger Dryas was the impact of a large, fragmented comet (Firestone et al. 2007; Napier 2010). Coincidentally, carbon found in the Younger Dryas impact layer often has very young radiocarbon dates (Firestone 2009), up to several hundred years into the future, that are inconsistent with their stratigraphic origin. It is tempting to conclude that this excess radiocarbon arrived with a comet, although no mechanism for such an event has yet to be established. Additional possibilities such as a disruption of the solar or Earth magnetic fields need to be explored and the explanation of this event will require additional research.
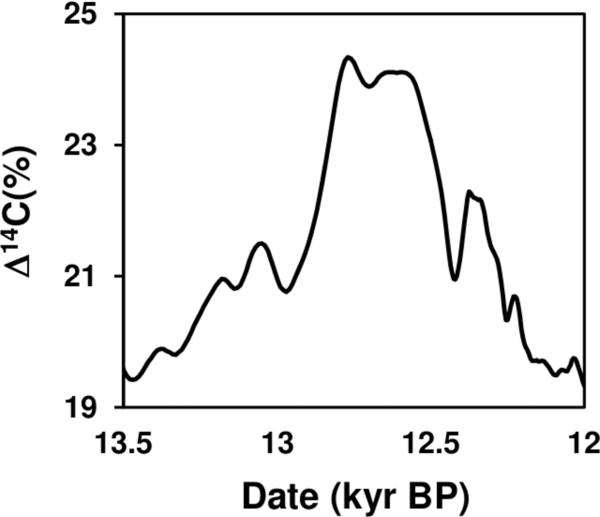
Figure 7. Event at 13 kyr BP increased atmospheric radiocarbon by 6%, comparable to the near-Earth SNe, but doesn't display the signature of other SNe events. The 13 kyr radiocarbon increase coincides with the time of the Younger Dryas cooling event and may be associated with an interruption of North Atlantic ocean circulation (Broecker 2006) or possibly a comet impact at that time (Firestone et al. 2007; Napier 2010).
Download figure:
Standard image High-resolution image3. ADDITIONAL PREHISTORIC SN EVIDENCE
Although radiocarbon provides a detailed record of the influx of cosmic rays from prehistoric, near-Earth SNe, there should also be additional evidence in the geological records from other cosmogenic isotopes. Cosmic γ-rays can also affect atmospheric chemistry by breaking N2 and O2 molecular bonds to form NOx products that are preserved in polar ice cores. These data can provide a general confirmation of the timing of the cosmic ray events but since they are not preserved in a global equilibrium record, as is carbon, they do not provide as strong evidence that they are associated with SNe.
3.1. Cosmogenic 10Be Evidence
10Be is produced by cosmic ray spallation of the atmosphere and has been observed in Gulf of California marine sediments (McHargue et al. 1995) as seen in Figure 8. Rapid increases in 10Be occurred at ≈32- and ≈44-kyr BP. The magnitude of these increases can be affected by the variable influx of dust that is depleted in 10Be. McHargue et al. proposed that the sudden increases in 10Be were due to a sudden change in the cosmic ray flux from nearby SNe events. Later investigators revised this interpretation assuming that these increases were due to decreases in Earth's magnetic field. As I have shown, only modest radiocarbon increases are correlated with variations in Earth's magnetic field. The observed 10Be abundance fluctuations were as large as 5-fold and appear too significant and rapid to be explained by magnetic field fluctuations.
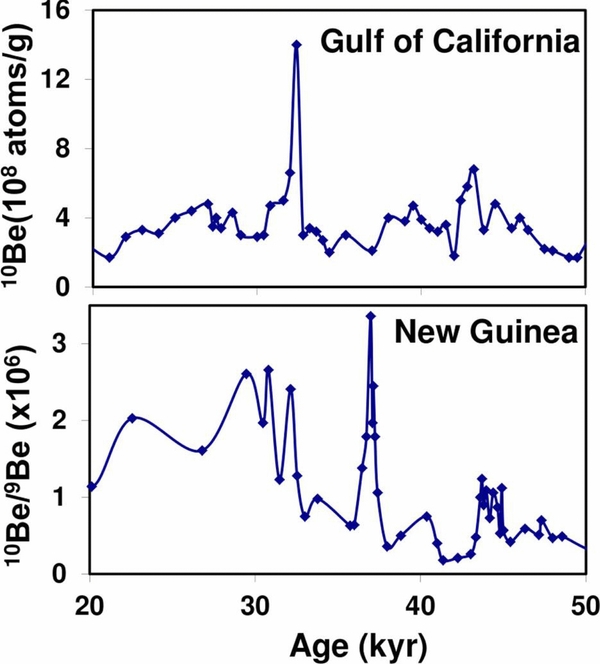
Figure 8. 10Be abundance in marine sediment cores. 10Be is produced by the spallation of oxygen and nitrogen atoms by cosmic rays in the atmosphere and deposited with dust across the Earth. Increases in 10Be abundance in Gulf of California (McHargue et al. 1995) marine sediments are observed 32 and 44 kyr ago and the 10Be/9Be ratios from an ocean core taken off the Southeastern margin of New Guinea (Leduc et al. 2006) increased 44, 37, 32, and possibly 22 kyr ago, coinciding with the radiocarbon dates for the four prehistoric SNe.
Download figure:
Standard image High-resolution imageSimilar increases in the 10Be/9Be ratio found in an ocean core from the Southeastern margin of New Guinea (Leduc et al. 2006) near the times of the 44, 37, 32, and possibly 22 kyr SNe are shown in Figure 8. The 10Be/9Be ratio measurements are a better measure of 10Be enrichment, although they too are subject to dilution from ordinary dust. The magnitudes of these increases in the 10Be/9Be ratios are included in Table 2 and are proportional to the Δ14C(%) increases 37, 32, and 22 kyr ago, although lower 10Be/9Be ratios are seen 44 kyr ago, possibly due to sample dilution from the deposition by large quantities of dust depleted in 10Be. No increase in the 10Be/9Be ratio has been observed near the time of the Younger Dryas event.
3.1.1. Additional SNe in the 10Be Record
Radiocarbon is sensitive to a range of ≈50 kyr because of its relatively short 5730 yr half-life. We expect many similar near-Earth SNe to have occurred before then. These SNe can be observed in earlier 10Be/9Be sediment records because of the much longer 10Be half-life (1.51 × 10⁶ yr) (Hofmann et al. 1987). In addition to the 4 near-Earth SNe during the past 50 kyr 19 additional significant peaks are observed in 10Be/9Be ratio between 50–300 kyr in the marine sedimentary sequence at the Portuguese margin in the Northeast Atlantic (Carcaillet et al. 2004) as shown in Figure 9. Their ages and distances are estimated from their relative magnitudes and are given in Table 3. Although the assignment of these peaks to SNe is more tenuous than those seen in the radiocarbon data, their average frequency is 13 kyr, which is comparable to the historical SN rate. The near-Earth SNe rate for the past 50 kyr is consistent with ≈20 SNe exploding <300 pc from Earth during the 250 kyr interval. This suggests that nearly all, of the peaks in 10Be/9Be are SNe signatures and a total of ≈23 prehistoric, near-Earth SNe have exploded during the past 300 kyr.
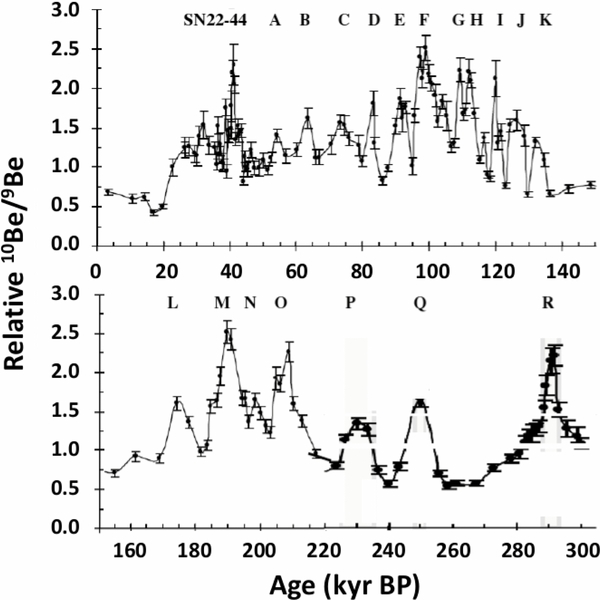
Figure 9. Evidence of earlier near-Earth SNe in the 10Be marine sediment profile. The 300 kyr 10Be/9Be ratio record at the Portuguese margin in the Northeast Atlantic (Carcaillet et al. 2004) shows significant peaks corresponding to the four near-Earth SNe seen in the radiocarbon record. In addition, 19 additional peaks in 10Be/9Be between 50–300 kyr likely correspond to near Earth SNe. These SNe are labeled A–S and their ages and distances are given in Table 3.
Download figure:
Standard image High-resolution imageTable 3. Ages and Estimated Distances of SN Deduced from 10Be/9Be Ratios at the Portuguese Margin in the Northeast Atlantic (Carcaillet et al. 2004) Shown in Figure 9
| SN | Age | Distance | SN | Age | Distance | SN | Age | Distance |
|---|---|---|---|---|---|---|---|---|
| (kyr) | (pc) | (kyr) | (pc) | (kyr) | (pc) | |||
| A | 57 | 220 | H | 110 | 132 | N | 195 | 114 |
| B | 66 | 192 | I | 115 | 125 | O | 203 | 205 |
| C | 79 | 205 | J | 123 | 116 | P | 214 | 125 |
| D | 86 | 153 | K | 129 | 142 | Q | 238 | 162 |
| E | 95 | 145 | L | 135 | 159 | R | 270 | 125 |
| F | 102 | 108 | M | 181 | 159 | S | 295 | 127 |
| G | 107 | 173 |
Download table as: ASCIITypeset image
3.2. Cosmogenic 36Cl and 26Al Evidence
A significant increase in 36Cl(t1/2 = 3.013 × 10⁵ yr) concentration is observed in the Greenland GRIP ice core (Baumgartner et al. 1998) 38 and 43 kyr ago. 36Cl is also observed in pack rat middens (Plummer et al. 1997) with significant peaks occurring 22 and 32 kyr ago, and a remarkably large peak near the time of the Younger Dryas as seen in Figure 10. Significant increases in 36Cl concentration are observed in the Greenland GRIP ice core (Baumgartner et al. 1998; Muscheler et al. 2005) ≈24, ≈32, and ≈40–36 kyr ago. Similar increases in 10Be, 26Al (t1/2 = 7.2 × 10⁵ yr), and 36Cl are reported ≈41 kyr ago in the Greenland GISP2 ice core (Nishiizumi et al. 2005).
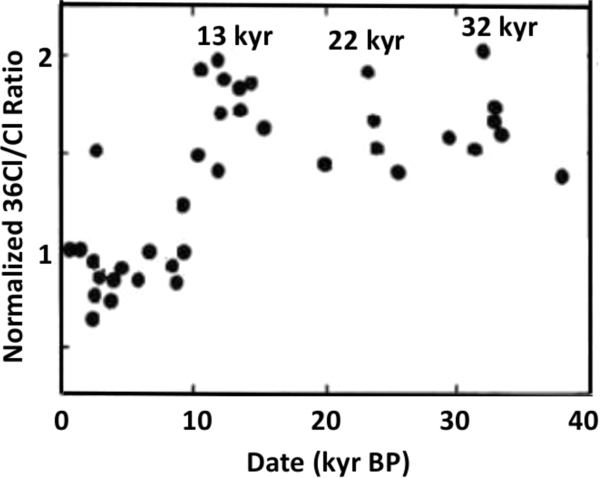
Figure 10. 36Cl/Cl ratios measured in fossil packrat midden urine (Plummer et al. 1997). Distinct increases are observed 22 and 32 kyr ago corresponding to the times of the SNe observed in the radiocarbon calibration data. An additional large increase in 36Cl/Cl occurred ≈13 kyr ago, at the time of the Younger Dryas which remains unexplained although it is coincident with the global 14C increase at that time.
Download figure:
Standard image High-resolution image3.3. Nitrate Accumulation Evidence
The nitrate concentration in the atmosphere increases during strong cosmic ray events due to an increase in the rate of ionization of O2 and N2 leading to the generation of free electrons and ions. These electrons are captured by neutral atoms and in a chain of chemical reactions NO ions are generated. After hydration the NO
 ions precipitate to Earth's surface. Large increases in nitrate accumulation are observed in the East Antarctic ice at Taylor Dome (Mayewski et al. 1996), as shown in Figure 11, coinciding with the times of the four prehistoric SN explosions and they are followed by a second broad NO
 increase consistent with the arrival of SNR cosmic γ-rays. The size of the initial increases in nitrate accumulation at the times of the SN explosions are comparable to the increases in radiocarbon at those times as shown in Table 2.

Figure 11. NO increases corresponding to the near-Earth SNe explosions. Nitrate concentrations measured in East Antarctic Taylor Dome ice (Mayewski et al. 1996) increased significantly following each prehistoric SN. Similar increases in nitrate concentrations have been observed following the historical supernovae (Rood et al. 2003; Dreschhoff & Laird 2006).
Download figure:
Standard image High-resolution image4. GLOBAL RADIOCARBON CALORIMETER
The Earth can be used as a calorimeter to determine the cosmic ray energy released by the nearby SNe. Global radiocarbon is continuously produced by high energy galactic cosmic rays from distant sources. It requires >10 MeV per primary or secondary particle in order to produce neutrons by nuclear reactions with the atmosphere. Lower energy solar energetic particles ordinarily contribute ≈0.25% of total radiocarbon (Kovaltsov et al. 2012). If the distance r to a near-Earth SN is known, then the γ-ray energy released by that SN can be calculated from the energy required to produce the observed increase in global radiocarbon.
4.1. Background Radiocarbon Production
4.1.1. Distribution of Galactic SNe
Assuming that the average interval between SNe less than r = 0.3 kpc from Earth is T(r) = 13 kyr, then the probability P(r) of a SN exploding in the galactic disk near to Earth is given by

If that rate were constant across the 30 kpc diameter galactic plain this would suggest a galactic SN rate of 190 kyr−1, which significantly exceeds the observed rate of 19 ± 11 kyr−1 (Diehl et al. 2006). From Monte Carlo calculations and a galactic model consisting of thin, old, and thick stellar disks, and assuming the historical SNe exploded within the thin disk, it was calculated (Tammann et al. 1994) that the galactic SN rate is 25 ± 6 kyr−1, which is comparable with the observation of Diehl et al. The historical SN rate within ≈3 kpc of Earth is 6 kyr−1 or ≈25% of the galactic rate, even though this region represents only 4% of the area of the galactic disk. This demonstrates that Earth is in a very active region of the galaxy. The SN rate at larger distances from Earth must be substantially lower to account for the total galactic rate.
The dependence of the SNe rate on distance from the Earth can be estimated from the distribution of SNR distances reported in the Chandra Galactic SNR Catalog. Figure 12 shows the binned probability of 118 SNR, 0.25–22 kpc from Earth, normalized to the near-Earth SNe rate. The rate of observed SNR decreases exponentially with distance r from Earth and can be described by the equation

This equation agrees well with the observed historical SN rate P(r = 3.4 kpc) = 1.6(7) × 10−4 kpc−2 yr−1. Integrating Equation (3) over the range of SNR reported in the Chandra catalog gives a galactic SNe rate of 14 ± 3 kyr−1, which is consistent with the observed rate but slightly lower than the calculated rate. This result confirms that the near-Earth SNe rate determined from the radiocarbon and 10Be/9Be data is consistent with the galactic rate, supporting the assignment of these events as SNe and not other cosmic or terrestrial occurrences.

Figure 12. Distribution of SNR from the Chandra Galactic SNR Catalog normalized to the near-Earth SNe rate from this work.
Download figure:
Standard image High-resolution image4.1.2. Modern Radiocarbon Production Rate
The abundance of radiocarbon in 1950 was 14C/C = 1.245 × 10⁻¹² (Roberts & Southon 2007) and the global carbon reservoir is 42.06 × 10¹² metric tons (Schimel 1995), so the size of the modern global 14C pool in 1950 was 52.4 metric tons (52,400 kg). From the radiocarbon decay curve for the past 18 kyr, it was determined that Δ14C1950 = 5% ± 2% in 1950 was from the decay of earlier near-Earth SN explosions. The background global radiocarbon reservoir, defined where Δ14C0 = 0, is produced by distant cosmic sources. The decay rate of the background 14C is in equilibrium with its production rate assuming the distant sources remain constant. The background rate of global radiocarbon production R0 is given by
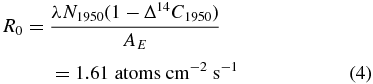
where the 14C decay constant λ = 0.000121 yr−1 (3.83 × 10⁻¹² s−1), the size of the global radiocarbon pool in 1950 was N1950 = 2.25 × 1030 atoms, and the area of Earth's surface is AE = 5.1 × 1018 cm2. This value is consistent with the modern radiocarbon deposition rate of 1.64 atoms cm−2 s−1 calculated (Kovaltsov et al. 2012) using a numerical Monte-Carlo model.
4.1.3. Radiocarbon Production Rate from Cosmic γ-Rays
A significant amount of the background radiocarbon production comes from cosmic γ-rays emitted following the explosions of distant SNe. The yield of radiocarbon produced by a SN exploding at a distance r from Earth is Y = c/r2, where c can be determined from the SN44kyrBP data in Table 2 by

assuming SN44kyrBP exploded r44 kyr = 0.11 kpc from Earth and doubled global radiocarbon so that N44 kyr = N0. The rate of radiocarbon production from distant γ-ray sources,  > 0.3 kpc from Earth, can then be calculated as
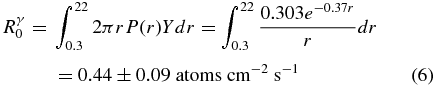
indicating that ≈27% of the modern radiocarbon production rate is produced by cosmic γ-rays from distant SNe.
4.2. Radiocarbon Production at the Time of the Supernova Explosion
The initial increase in radiocarbon seen at the time of the near-Earth SNe explosions occurred in the relatively small, 900 kg, pool of atmospheric radiocarbon before it had time to reach equilibrium with the much larger ocean reservoir (Schimel 1995). Since about 12% of atmospheric radiocarbon exchanges with the ocean annually, this excess atmospheric 14C is completely mixed into the global carbon cycle within 100 yr and global radiocarbon returns to near baseline levels for each SN as seen in Figure 5. The observed increase in atmospheric radiocarbon at the time of each SN explosion is given in Table 2. When SN44kyrBP exploded it increased atmospheric radiocarbon by ≈26%, producing  = 230 kg (9.9 × 1027 atoms of 14C). This increase is comparable to 213 kg that can be calculated for a SN exploding 0.110 kpc from Earth, primarily from cosmic γ-rays with energies <20 GeV (Povinek & Tokar 1979). The neutron yield from cosmic SN γ-rays striking the atmosphere at the time of the explosion has been estimated at ≈1000 neutrons per erg of γ-ray energy (Lingenfelter & Ramaty 1970), with about 65% of these neutrons producing 14C (Damon et al. 1995) so the energy required to produce a 14C atom is
  = 0.0015 erg. If SN44kyrBP exploded r44 kyr = 0.11 kpc = 3.4 × 10¹⁵ km from Earth and Earth's radius is rE = 6371 km then the energy released as γ-rays at the time of the explosion is given by

This energy release is less than 1 × 1050 erg reported for SN1006 (Damon et al. 1995), but it is consistent with the predicted 1047–1050 erg range for hard γ-ray energy release proposed by various authors (Lingenfelter & Ramaty 1970; Chupp 1976; Berezinskii et al. 1990).
4.3. Radiocarbon Production During SNR Cosmic Ray Acceleration
After each prehistoric SN explosion there was a hiatus of ≈1500 yr with no change in Δ14C after which the size of the global radiocarbon pool dramatically increased over a period of ≈2000 yr. The rate of cosmic γ-ray production inferred from the increase in radiocarbon following SN22kyrBP is compared with the calculated cosmic ray production rate (Berezhko et al. 2002) for SN1006 in Figure 13. The agreement is excellent and suggests that the production of cosmic γ-rays coincides with the acceleration of hadronic cosmic rays that then interact with the mass contained within the SNR.

Figure 13. Comparison of the calculated and observed cosmic ray production following a SNe explosion. The rate of cosmic ray production was calculated for SN1006 (Berezhko et al. 2002) and the observed rate of total radiocarbon production is for SN22kyrBP.
Download figure:
Standard image High-resolution imageSN44kryBP doubled the global radiocarbon pool producing 52,400 kg of radiocarbon (2.25 × 1030 atoms of 14C). If it required 0.0015 erg to produce an atom of 14C, as was assumed at the time of the SN explosion, then SN44kyrBP would have emitted a 3.6 × 1051 erg of γ-ray energy. That value is clearly too large as it would require all of the energy emitted by the SN explosion to be converted into γ-ray energy. However, the γ-rays produced in the SNR remnant by the more energetic hadronic cosmic rays will have substantially higher energies and are more efficient in producing radiocarbon when striking Earth's atmosphere. It has been calculated (Kovaltsov et al. 2012) that the 14C yield varies from 4300 atoms erg−1 for a 1 GeV γ-ray to 200,000 atoms erg−1 for a 10 TeV γ-ray, as shown in Figure 14. SNRs are most luminous for <104 yr, emitting γ-rays in the GeV to TeV range, where a ratio of 0.3–3 GeV to 0.3–3 TeV γ-ray flux of ≈5 is representative of young SNR γ-ray emission (Dermer & Powale 2013) so a reasonable average neutron yield would be ≈20,000 erg−1. If  = 0.00005 erg, the total γ-ray energy emitted by the SN44kyrBP SNR is ≈1 × 1050 erg, which would be ≈1/3 of the total energy expected to be released as cosmic rays (Berezhko et al. 2002), although less than ≈4 × 1050 erg reported by Castagnoli et al. for Tyrrhenian Sea thermoluminescence data (Castagnoli et al. 1982). This is comparable to the fraction of cosmic γ-ray energy that was determined to produce background levels of global radiocarbon from distant sources.

Figure 14. Radiocarbon yield as a function of cosmic ray energy. Data are taken from Kovaltsov et al. (2012), calculated for cosmic ray protons, and extrapolated to 20 TeV. It has been assumed here that the yield of 14C from cosmic γ-rays is similar to that from protons.
Download figure:
Standard image High-resolution imageThe near-Earth SNe all followed a similar pattern of radiocarbon production as shown in Figure 5. In each case no excess radiocarbon production was observed after 3500 yr. Type II SNR luminescence has been reported as ≈3 × 1036 erg s−1 (Dermer & Powale 2013), which if sustained for 2000 yr would emit a total of ≈2 ×1047 erg of γ-ray energy. Even if the average γ-ray energy emitted were 100 TeV, it does not appear possible for the near-Earth SNe to have emitted less than ≈1049 erg of γ-ray energy. This discrepancy with previous observations cannot be readily explained here and suggests that a more detailed analysis, beyond the scope of this paper, is necessary.
5. ENVIRONMENTAL CONSIDERATIONS
It has been shown (Ellis & Schramm 1995) that direct heat, increased radiation from γ-rays and cosmic rays, and damage to ozone layer should pose little danger from SNe > 10 pc from Earth. The local SN rate suggests that SNe < 10 pc from Earth occur about once in every 12 million years. When SN44kyrBP exploded life on Earth would have received ≈40 times the modern cosmic radiation dose near the time of the explosion and ≈4 times the normal dose annually for 1500–3500 yr following the explosion. It has been confirmed by evidence from Antarctic lake sediments (Hodgson et al. 2005) that during the late Pleistocene radiation was ≈3 times higher than during the Holocene. Radiation exposure from near-Earth SNe, while not catastrophic, may have led to punctuated increases in global mutation rates and somatic changes following each event. Cancer deaths would have increased by ≈3% at the time of the explosion but only negligibly later (Pierce et al. 1996).
Cosmic rays are also proposed to cause ionization in the atmosphere seeding cloud formation (Stensmark et al. 1997). This implies that if the cosmic ray rate were to increase, the additional cloud formation would increase Earth's albedo radiating more of the Sun's energy into space and leading to global cooling. This hypothesis can be tested with the near-Earth SN data presented in this paper. In Figure 15 I have compared the radiocarbon calibration data for the past 48 kyr with the Pleistocene global temperature variations derived from Δ18O measurements in the Taylor Dome, Antarctica ice core (Steig et al. 2000). Broad temperature increases of ≈3°C–4°C are observed following each SN explosion, continuing through the SNR cosmic ray production phase, and then returning to earlier temperature levels. This correlation appears to contradict the predictions of Stensmark et al. It is likely that a sustained increased in the cosmic ray rate would produce significant amounts of NOx in the stratosphere causing depletion of the ozone layer (Ellis & Schramm 1995). Loss of the ozone layer increases the exposure of the lower atmosphere to ultraviolet radiation which may contribute to global warming (Hartmann et al. 2000). Nitrous oxide (N2O), a greenhouse gas with 300 times the global warming potential of CO2 (Myhre et al. 2013), is also shown in Figure 15 to increase significantly in the EPICA Dome Antarctica ice core (Schilt et al. 2010) at the times of the near-Earth SNe. N2O may be produced directly by both cosmic radiation (Harteck 1955) and coronal discharges associated with cosmic ray induced lightning (Hill et al. 1984). While this may be the cause of the observed temperature increases, global warming is a complex process and further analysis is required to understand these results.

Figure 15. Comparison of the radiocarbon Δ14C and Taylor Dome Antarctica (Steig et al. 2000) temperature data. A strong correlation appears to exist between the explosions of near-Earth SNe and temperature rises of ≈3°C–4°C. The SN44kyr explosion appears ≈2 kyr earlier in the temperature data, based on Δ18O measurements, possibly due to age calibration difficulties. These results contradict predictions that increased cosmic ray intensities should decrease global temperatures (Stensmark et al. 1997). N2O concentrations are also seen to increase near the times of the SNe in EPICA Dome Antarctica ice core data (Schilt et al. 2010) (lower curve) and may account for the observed temperature increases.
Download figure:
Standard image High-resolution image
6. CONCLUSIONS
The radiocarbon record for the past 50 kyr is completely explained by the occurrence of four, powerful, near-Earth (<300 pc) cosmic ray producing events beginning 44, 37, 32, and 22 kyr ago that produced up to 100% increases in size of the global radiocarbon pool. These events showed remarkably identical patterns of radiocarbon production, beginning with a sharp increase in atmospheric radiocarbon, followed by a quiescent period of 1500 yr when little excess radiocarbon was produced, and concluding with a 2000 yr interval of rapid increase in global radiocarbon. Each event was then followed by the decay of excess accumulated radiocarbon with the expected 14C half-life (t1/2 = 5730 yr).
Previously this excess radiocarbon was attributed to variations in Earth's magnetic field, however I have shown that the increases were too rapid and large to be accounted for in this way, even if Earth's magnetic field disappeared for several millennia. Decay of Δ14C for the last 18 kyr with the 14C half-life proves that the entire global radiocarbon pool, not simply the atmospheric component, had increased. Small oscillations of order 2% in the radiocarbon decay curve for the past 12 kyr were shown to correspond directly to known changes in Earth's magnetic field, demonstrating that some other cosmic ray source must be responsible for the large radiocarbon increases.
Solar flares, γ-ray bursts, explosions at the center of the galaxy, and other sudden cosmic events have all been ruled out in this analysis because the near-Earth events produced radiocarbon over an extended, 3500 yr time period. This leaves near-Earth SNe as the only plausible causes of the observed increases in global radiocarbon during the past 50 kyr. Analysis of the radiocarbon record provides the following corroborating evidence that these events are SNe.
- 1.The near-Earth SNe rate is consistent with both the historical and the galactic SNe rate.
- 2.The pattern of cosmic γ-ray production after each SN follows the theoretical predictions.
- 3.The timing of the SNe observed in the radiocarbon record is confirmed in terrestrial cosmogenic isotope records.
- 4.SN22kyrBP can be identified with the Vela SN explosion that exploded 250 ± 30 pc from Earth.
- 5.It was determined that ≈2 × 1049 erg of γ-ray energy were released by the SNe at the time of the explosions which is consistent with expectations.
- 6.It was determined that ≈1050 erg of γ-ray energy was later produced in the SNR which is consistent with calculations of cosmic ray production.
- 7.Approximated 1/3 of the energy emitted as hadronic cosmic rays in the SNR was shown to be converted into γ-rays and a comparable fraction of the background radiocarbon production was attributed to cosmic γ-rays.
This analysis is the first observation of the complete cycle of cosmic γ-ray emission by a SN and its subsequent SNR. The long duration of these events makes the direct observation by traditional astronomical methods impossible. Several surprising results of these observations will require a more detailed analysis in the future.
- 1.The "standard candle" pattern of cosmic γ-ray emission for the four near-Earth SNe observed in the radiocarbon record is unexpected since it seems surprising that each event would be identical.
- 2.The assumption that the distance of each SN from Earth scales by 1/r2 with respect to global radiocarbon production is arbitrary and cannot be proven at this time.
- 3.Possible assignment of SN32kyr BP as the Vela SN cannot be ruled from the uncertainties in the SNR size and pulsar distance ages.
- 4.The observed cosmic γ-ray energy released by the near-Earth SNe is larger than that seen today in SNR, although most modern measurements are in historical SNe, which are in a more quiescent stage of cosmic ray production, or in SNe older than 104 yr, whose cosmic ray production has declined.
- 5.Events observed only in the 10Be/9Be data provide only limited information on cosmic γ-ray production due to the poor resolution of these data. Assignment of all of these events as SNe should be considered tentative at this time.
The radiocarbon record contains considerable information on more distant SNe, as well as solar flares, γ-ray bursts, explosions at the center of the galaxy, and other cosmic events that may be studied in future work. These studies would certainly benefit from higher precision studies of 14C abundance, possibly at various geographical sites that could provide additional information on the location the near-Earth SNe in the galaxy.
7. FUTURE SUPERNOVA EXPLOSIONS
SN1006 exploded with an estimated magnitude of −7.5, which was about 4 times as bright as Venus. SN44kyrBP exploded 14 times closer than SN1006 and would have had a brightness comparable to the moon, remaining in the sky for many months as the radioactive products of nucleosynthesis decayed. Future near-Earth SNe explosions will certainly provide an astounding light show far exceeding the historical observations.
The explosion of a near-Earth SN in the future would not be surprising and appears to be overdue. At least six stars <300 pc from Earth may be considered as SN candidates and are listed in Table 4. IK Pegasi is a binary star system 46 pc from Earth that may evolve into a Type 1a SN. The others should all evolve into Type II SN. None of these potential near-Earth SNe are likely to cause immediate danger to life on Earth, although there appears to be a strong correlation between increased cosmic radiation and global warming that could prove important in modern times should another near-Earth SNe occur.
Table 4. Near-Earth Supernova Explosion Candidates
| Star | Location | Dist. | Mass |
|---|---|---|---|
| (pc) | ⊚ | ||
| IK Pegasi | Pegasus | 46 | 1.65/1.15a |
| Spica | Virgo | 80 | 10.25/7.0a |
| Alpha Lupi | Lupus | 141 | 10.1 |
| Antares | Scorpius | 169 | 12.4/10a |
| Betelgeuse | Orion | 197 | 7.7–20 |
| Rigel | Orion | 264 | 18b |
Notes. aBinary star system. bMultiple star system.
Download table as: ASCIITypeset image
This work was supported, in part, by the U.S. Department of Energy Contract DE-AC02-05CH11231. The author is especially grateful for helpful discussions and suggestions by Allen West (Geoscience Consulting, Dewey, AZ), Jon Hagstrum (USGS, Menlo Park, CA), Spencer Klein (LBNL, Berkeley, CA), Christopher McKee (University of California, Berkeley, Department of Physics), and Mary Firestone (University of California, Berkeley, Department of Environmental Science Policy and Management.