


ABSTRACT
This paper describes the spectral modeling of the surface of Phobos in the wavelength range between 0.25 and 4.0 μm. We use complementary data to cover this spectral range: the OSIRIS (Optical, Spectroscopic, and Infrared Remote Imaging System on board the ESA Rosetta spacecraft) reflectance spectrum that Pajola et al. merged with the VSK-KRFM-ISM (Videospectrometric Camera (VSK)–Combined Radiometer and Photometer for Mars (KRFM)–Imaging Spectrometer for Mars (ISM) on board the USSR Phobos 2 spacecraft) spectra by Murchie & Erard and the IRTF (NASA Infrared Telescope Facility, Hawaii, USA) spectra published by Rivkin et al. The OSIRIS data allow the characterization of an area of Phobos covering from 86 8 N to 90° S in latitude and from 126° W to 286° W in longitude. This corresponds chiefly to the trailing hemisphere, but with a small sampling of the leading hemisphere as well. We compared the OSIRIS results with the Trojan D-type asteroid 624 Hektor and show that the overall slope and curvature of the two bodies over the common wavelength range are very similar. This favors Phobos being a captured D-type asteroid as previously suggested. We modeled the OSIRIS data using two models, the first one with a composition that includes organic carbonaceous material, serpentine, olivine, and basalt glass, and the second one consisting of Tagish Lake meteorite and magnesium-rich pyroxene glass. The results of these models were extended to longer wavelengths to compare the VSK-KRFM-ISM and IRTF data. The overall shape of the second model spectrum between 0.25 and 4.0 μm shows curvature and an albedo level that match both the OSIRIS and Murchie & Erard data and the Rivkin et al. data much better than the first model. The large interval fit is encouraging and adds weight to this model, making it our most promising fit for Phobos. Since Tagish Lake is commonly used as a spectral analog for D-type asteroids, this provides additional support for compositional similarities between Phobos and D-type asteroids.
Export citation and abstract BibTeX RIS
1. INTRODUCTION
In the past 40 yr, Phobos has been observed several times. A complete and detailed description of the data from all previous Phobos near-ultraviolet (NUV), visible (Vis), and near-infrared (NIR) spectrophotometric studies up to the present performed from spacecraft and ground-based telescopes has been presented in Pajola et al. (2012a).
Mariner 9 and Viking Lander II both observed Phobos and the data indicated a dark and flat visible spectrum that was considered to be consistent with a carbonaceous chondrite composition (Pollack et al. 1978; Pang et al. 1980). Phobos 2 observed the leading and trailing regions of the anti-Mars hemisphere and part of the sub-Mars hemisphere (VSK-KRFM-ISM data). These data were used to identify different geological units on Phobos characterized by different color and morphology (Murchie & Erard 1996). The leading Stickney-dominated hemisphere is bluer in color than the areas of the redder trailing hemisphere (Murchie & Erard 1996). Observations using the Hubble Space Telescope (HST) Faint Object Spectrograph (FOS) yielded significantly red Phobos spectra, similar to Phobos 2 (Zellner & Wells 1994). Additional observations of Phobos were performed using the HST Wide-Field Planetary Camera 2 (WFPC2) which showed a weak spectral absorption feature in the satellite reflectance spectrum between 0.95 and 1.04 μm, indicating the possible existence of pyroxene on the surface (Cantor et al. 1999). The spectral behavior of FOS and Phobos 2 data was confirmed by observations with the Imager for Mars Pathfinder (IMP) and it was suggested that the spectral slope of Phobos was comparable to that of D-type asteroids (Thomas et al. 1999). Subsequently, Phobos was observed with the Infrared Telescope Facility and the data confirmed that the leading and trailing sides of Phobos were best matched by T- and D-type asteroids (Rivkin et al. 2002; Lynch et al. 2007). The Mars Express (MEX) spacecraft observed Phobos during several close encounters with Phobos, performing a UV spatially resolved observation of the sub-Mars hemisphere and different VIS and IR hyperspectral cubes of resolved areas located northeast of Stickney crater. The spectra obtained from the resolved areas on the surface of Phobos have different spectral slopes with respect to those obtained by Phobos 2 (Perrier et al. 2004; Gondet et al. 2010). The Mars Reconnaissance Orbiter (MRO) acquired later disk-resolved data of the same area observed by MEX which exhibit spectral trends consistent with the MEX data (Murchie et al. 2007, 2008; Fraeman et al. 2012) in that they have different slopes than the Phobos 2 data.
On 2007 February 24, the Optical, Spectroscopic, and Infrared Remote Imaging System (OSIRIS) WAC, and NAC instruments on board the ESA Rosetta spacecraft observed Phobos from 0.25 to 1.0 μm. These data permitted a compositional analysis of a specific area of the satellite presented in the paper.
2. THE OSIRIS GEOMETRY DURING PHOBOS OBSERVATION
On 2007 February 24, the Rosetta probe approached Mars in order to modify its interplanetary orbit en route to its main target the 67P/Churyumov Gerasimenko comet. Many scientific goals regarding the Martian system were fulfilled, see for example, Pajola et al. (2012b), Moissl et al. (2012), Coradini et al. (2010), and Feldman et al. (2011). During this gravitational assist, multiple sets of OSIRIS observations were dedicated to the determination of the surface mineralogy of Phobos from different distances and phase angles. The data presented in this paper were obtained on 2007 February 24, while the spacecraft was at a distance of 119,000 km from Mars. The geometry of the complete observation of the Martian system is presented in Pajola et al. (2012a).
3. THE OSIRIS WAC AND NAC OBSERVATION
The OSIRIS instrument is the scientific camera on board the ESA Rosetta mission. Its main goal is to observe the nucleus, coma, and tail of the 67P/Churyumov Gerasimenko comet. The NAC and WAC filters are consequently optimized to study the chemical and mineralogical properties of the comet nucleus and the comet coma as a whole, but they have also been suitable for studying the surface mineralogy of asteroid 2867 Steins (Leyrat et al. 2010) and asteroid 21 Lutetia (Magrin et al. 2012). A detailed description of the OSIRIS filters is presented in Keller et al. (2007).
The observational geometry between Rosetta, Phobos, and the Sun allowed OSIRIS to observe an area of the satellite covering from 868 N to 90° S in latitude and from 126° W to 286° W in longitude. This area consists of one third, i.e., from 126° W to 180° W, of the leading hemisphere and two thirds, i.e., from 180° W to 286° W, of the trailing hemisphere. This is shown schematically in Figure 1 where almost the entire part of the observed area belongs to the anti-Mars hemisphere of Phobos, with the exception of a slice which goes from 270° W to 286° W in longitude that falls inside the sub-Mars hemisphere. The Phobos dedicated observation sets that we analyze are presented in Table 1.
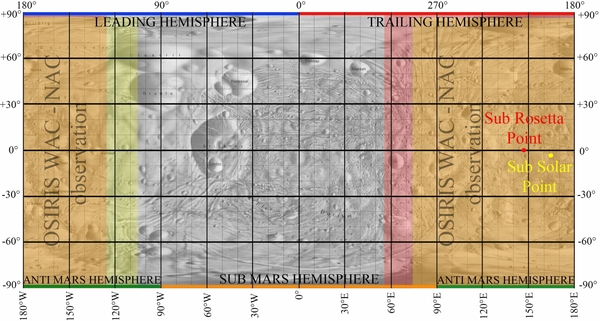
Figure 1. Phobos area observed by OSIRIS WAC and NAC cameras at 22:09 UT, as a result of the mutual position between Rosetta, Phobos, and the Sun. The illuminated area is highlighted in yellow, while the Phobos area observed by Rosetta is in red. The resulting overlap between these two areas gives the illuminated area of Phobos observable by OSIRIS, which is highlighted in orange. The red and yellow dots represent the sub-Rosetta and the sub-solar points, respectively.
Download figure:
Standard image High-resolution imageTable 1. OSIRIS Sets Obtained on 2007 February 24
| OSIRIS Camera | WAC | NAC |
| Observation Time (UT) | 22:09:02.741–22:10:10.956 | 22:09:09.707–22:10:04.149 |
| Distance Range (km) | 114 936–114 416 | 114 882–114 467 |
| Scale Range (km pixel−1) | 11 755–11 702 | 2 166–2 158 |
| Dimensions (pixels) | 768 × 1536 | 2048 × 2048 |
| Number of images | 10 | 11 |
| Sub-Rosetta lat range | −0.05 to − 0.04 | −0.05 to − 0.04 |
| Sub-Rosetta lon range | 146.72 E–145.76 E | 146.62 E–145.85 E |
| Sub-solar lat range | −3.21 to − 3.21 | −3.21 to − 3.21 |
| Sub-solar lon range | 165.33 E–164.45 E | 165.24 E–164.53 E |
| Phase angle (°) | 18.87–18.95 | 18.89–18.94 |
Notes. The OSIRIS camera, the observation time intervals, the spacecraft–Phobos distance ranges, and the respective scales are presented together with the image dimensions and the number of images acquired, the sub-spacecraft latitude and longitude ranges, the sub-solar latitude and longitude ranges, and the observation phase angle.
Download table as: ASCIITypeset image
4. PHOBOS SPECTRAL ANALYSIS
4.1. Data Analysis
During the observations, a set of 10 WAC and 11 NAC images, respectively, were obtained showing a resolved target (see Figure 4 of Pajola et al. 2012a). Due to the limited scale, 11.8 km pixel−1 for WAC and 2.2 km pixel−1 for NAC, it is not possible to discern any feature of the surface of Phobos. Consequently, we decided to integrate all the pixels and create a single spectrum for the entire area observed.
Using the same calibration pipeline as in Magrin et al. (2012), the bias image was subtracted from the raw data, then the resulting image was divided by the flat field image and the background sky was subtracted. We then used the aperture photometry technique to measure the flux, and its error, coming from the target. After checking that no cosmic ray hit the CCD detector, we decided to split the WAC and NAC observations into two parts. With the WAC images, we used a inner radius of 9 pixels centered on the Phobos photocenter in order to get all of the light coming from the target. We then computed the flux of the sky background in an annulus between 19 and 21 pixels from the photocenter of the target. The selection of these values was driven by the fact that we had to be close enough to Phobos to compute the sky background value, but not too close to get light coming from the satellite inside. For the 11 NAC images we used the same technique, but we selected an inner radius of 10 pixels centered on the Phobos photocenter and then we computed the flux of the sky background from an annulus at a distance between 19 and 21 pixels from the center of the observed target. After all these steps were followed, we measured Phobos I/F for both cameras, from 0.25 to 0.61 μm for the WAC and from 0.26 to 0.99 μm for the NAC. The resulting values of Phobos I/F and their respective percentage errors6 are provided in Table 2.
Table 2. NAC and WAC Number, Name, Central Wavelength and the FWHM of the Filters Used During the OSIRIS Phobos Observation on 2007 February 24
| OSIRIS | ID | Filter | Wavelength | FWHM | I/F | I/F |
|---|---|---|---|---|---|---|
| Camera | No. | Name | (nm) | (nm) | Error (%) | |
| WAC | F31 | UV 245 | 245.5 | 13.0 | 0.01305 | 34.5 |
| WAC | F41 | CS | 258.0 | 4.0 | 0.01312 | 22.8 |
| NAC | F15 | FFP-UV Far-UV | 263.5 | 45.0 | 0.01484 | 27.1 |
| WAC | F51 | UV 295 | 295.0 | 10.0 | 0.01489 | 23.4 |
| WAC | F61 | OH-WAC | 308.5 | 3.0 | 0.01699 | 18.5 |
| WAC | F81 | NH | 335.0 | 4.0 | 0.01766 | 15.4 |
| NAC | F16 | FFP-UV Near-UV | 360.0 | 50.0 | 0.02037 | 12.6 |
| WAC | F13 | UV 375 | 374.5 | 9.0 | 0.02137 | 9.3 |
| WAC | F14 | CN | 387.0 | 4.0 | 0.02177 | 2.7 |
| NAC | F84 | Neutral Blue | 480.0 | 72.0 | 0.02641 | 2.7 |
| NAC | F83 | Neutral Green | 535.0 | 61.0 | 0.02769 | 2.8 |
| WAC | F15 | NH2 | 571.0 | 10.0 | 0.02743 | 3.4 |
| WAC | F16 | Na | 589.5 | 3.0 | 0.02732 | 1.8 |
| WAC | F18 | VIS 610 | 611.5 | 9.0 | 0.02835 | 2.1 |
| NAC | F82 | Neutral Orange | 650.5 | 81.0 | 0.03083 | 2.9 |
| NAC | F87 | Neutral Hydra | 700.5 | 21.0 | 0.03316 | 2.9 |
| NAC | F88 | Neutral Red | 742.5 | 61.0 | 0.03499 | 3.7 |
| NAC | F51 | Ortho FFP-IR | 804.5 | 39.0 | 0.03713 | 2.8 |
| NAC | F41 | Near-IR FFP-IR | 882.5 | 65.0 | 0.03940 | 3.1 |
| NAC | F61 | Fe2O3 FFP-IR | 932.0 | 40.0 | 0.04057 | 2.7 |
| NAC | F71 | IR FFP-IR | 992.0 | 44.0 | 0.03880 | 3.9 |
Notes. The values are given in nanometers. OSIRIS Phobos I/F values with their percentage error, which are plotted in Figure 2, are also presented.
Download table as: ASCIITypeset image
Different sets of Phobos data from the literature show different albedo (or I/F) levels. Fraeman et al. (2012) report I/F consistent with an albedo value of 0.07 reported by Simonelli et al. (1998). OSIRIS, OMEGA, and CRISM data show lower I/F levels that differ from each other. Different I/F levels are usually attributed to variations in physical or observational conditions, e.g., composition, grain size, and/or phase angle, therefore differences among the datasets could partly be due to sampling of compositionally distinct geographical regions and/or partly to different observing geometries.
Phase angle has been shown to play an important role in the albedo level of data. As shown by Hiroi et al. (2003) using laboratory spectra of the Tagish Lake meteorite (Brown et al. 2000), changing the phase angle from 0° to 30° decreases the albedo (or reflectance) by more than a factor of two. Since the Phobos observations were all taken during flybys, the phase angles range from a few degrees to several, yielding an average I/F of ∼0.028 at 0.55 μm. The geographic coverage offered by the OSIRIS data overlaps with some of the Fraeman et al. (2012) data on the anti-Mars hemisphere. Simonelli et al. (1998) do not report a significant albedo variability on Phobos. As a result, we scaled the OSIRIS I/F data to match the albedo of Simonelli et al. (1998) at 0.55 μm.
4.1.1. Phobos UV Spectrum
The OSIRIS Phobos UV spectrum is one of the few modern published UV spectra of a small body, with the others being asteroids 2867 Steins (A'Hearn et al. 2010), 21 Lutetia (Weaver et al. 2010; Stern et al. 2011), 1 Ceres (Parker et al. 2002; Li et al. 2006, 2009), and 4 Vesta (Fornasier et al. 2011). In this wavelength region, our understanding of asteroid reflectance spectra is still in its infancy due to limited data in both sensitivity and spectral resolution, and equally limited laboratory studies. Within this frame, the asteroids' UV spectra appear to have a common reflectivity drop shortward 400 nm (Li et al. 2011), which is also visible in all meteoritic samples, such as the carbonaceous chondrites, the ordinary chondrites, the enstatites, and the achondrites (see, for example, RELAB catalog, Copyright 2008, Brown University, Providence, RI; All Rights Reserved).7
The OSIRIS multiband camera samples the spectral range from 245.5 nm to 992.0 nm within 21 filters, and therefore it does not have the spectral resolution that a spectrograph provides. As presented by Leyrat et al. (2010) for 2867 Steins, by Magrin et al. (2012) for 21 Lutetia, and by Fornasier et al. (2011) for 4 Vesta, OSIRIS does not have a deep sampling in the UV range, and the error bars derived from the instrument calibration are wider than the optical and the NIR range, therefore the possible UV reflectivity drop cannot be sampled in greater detail. Nevertheless, the OSIRIS Phobos UV reflectivity decreasing trend is something to be expected considering previous Phobos spectroscopic data from the Mariner 9 UV spectrometer (Masursky et al. 1972; Pang et al. 1980) and the MEX SPICAM spectrometer (Perrier et al. 2004) as presented in Pajola et al. (2012a).
4.2. Phobos Comparison to the Trojan Asteroid 624 Hektor
Various spectral analyses of Phobos have included comparisons to D-type asteroids (Pajola et al. 2012a; Fraeman et al. 2012; Lynch et al. 2007; Rivkin et al. 2002; Murchie 1999). A comparison to 624 Hektor, a D-type Trojan asteroid, is shown in Figure 2 where the albedo of Phobos from OSIRIS data is scaled to match Hektor's (Cruikshank et al. 2001).8 It is apparent that the overall slope and curvature of the two bodies over the common wavelength range are very similar. Also, both Phobos and Hektor lack a 3.0 μm feature that would be indicative of water in some form (Cruikshank et al. 2001; Rivkin et al. 2002).

Figure 2. Phobos scaled OSIRIS data compared to the albedo of 624 Hektor (Cruikshank et al. 2001).
Download figure:
Standard image High-resolution imageThe similarity in spectral slope at wavelengths up to 1.0 μm, along with a lack of a 3.0 μm absorption for both Phobos and Hektor, is consistent with Phobos being a captured D-type asteroid as previously suggested by Pajola et al. (2012a) and Rivkin et al. (2002).
4.3. Spectral Modeling
Previous investigations of the composition of the surface of Phobos made use of spectral matching. In this study, we undertake spectral modeling of Phobos' surface albedo using a radiative transfer code based on the Shkuratov et al. (1999) formulation of the slab approximation. The code calculates the albedo of a powdered surface from the optical constants of candidate materials. The best-fitting models, shown in Figures 3 and 4, were achieved with a simple intimate mixture (salt-and-pepper like) varying the composition, the relative amounts of the components, and the grain sizes to minimize the weighted residual sum of squares (WRSS), where

in which o and m are the observed and model albedos, respectively,  is the percentage error provided in Table 2 multiplied by the I/F in Table 2, and i is the wavelength. Table 3 lists the parameters characterizing the best fitting models and the corresponding WRSS, which was calculated in the wavelength interval between ∼0.25 and 1.0 μm covered by the OSIRIS data.
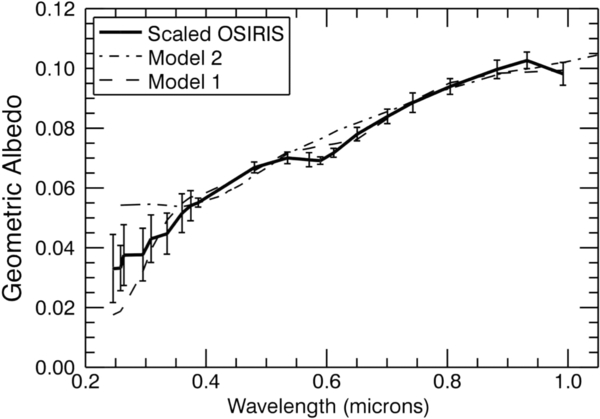
Figure 3. Scaled OSIRIS WAC and NAC data together with the best fitting Models 1 and 2.
Download figure:
Standard image High-resolution image
Figure 4. OSIRIS and Rivkin et al. (2002) data shown with Models 1 and 2. The Rivkin et al. (2002) dataset includes points from Murchie & Erard (1996).
Download figure:
Standard image High-resolution imageTable 3. Summary of All Models for Phobos
| Model | Comp | Amount | Comp | Amount | Comp | Amount | Comp | Amount | WRSS |
|---|---|---|---|---|---|---|---|---|---|
| Grain Size | Grain Size | Grain Size | Grain Size | ||||||
| (μm) | (μm) | (μm) | (μm) | ||||||
| 1 | Oliv1 | 25% | Serp2 | 33% | TTH3 | 12% | Basalt | 30% | 0.14 |
| 5 | 20 | 5 | Glass4 | 250 | |||||
| 2 | Tagish | 80% | PM806 | 20% | 0.30 | ||||
| Lake5 | 11 | 20 |
Notes. Oliv, olivine; Serp, serpentine; TTH, titan tholin; PM80, pyroxene glass (80% Mg in all cases). References. (1) Dorschner et al. 1995; (2) Roush et al. 1990; (3) Imanaka et al. 2005; (4) Lamy 1977; Pollack et al. 1973; (5) Roush 2003; (6) Pyx (glassy) [Mg(0.8) Fe(0.2) SiO(3)] Jaeger et al. 1994; Dorschner et al. 1995.
Download table as: ASCIITypeset image
Model 1 best fits the OSIRIS data (see Table 3 for details) and yields a composition that includes organic carbonaceous material, serpentine, olivine, and basalt glass and is shown in Figure 3. However, the presence of organic material makes this model questionable as it produces a strong absorption at 3.0 μm (see Figure 4) not seen in previously obtained Phobos data (Murchie & Erard 1996; Rivkin et al. 2002). Since the OSIRIS data do not cover longer wavelengths, it is impossible for us to know whether the geographical region covered by this dataset might indeed include organic carbonaceous material, however, we consider this possibility unlikely. It should also be noted that the basalt glass used in the model is only a convenient endmember with a flat spectrum whose composition is consistent with the kinds of mineral found in carbonaceous chondrites and does not reflect a detection of this material on the surface of Phobos.
The OSIRIS Phobos spectrum exhibits a minimum near 0.6 μm which is not matched by our model. This absorption was first noted by Murchie et al. (2008) in the Phobos red unit and was attributed to ferric iron-bearing phyllosilicates on the surface. Fraeman et al. (2013) show that the 0.65 μm feature is present in independent telescopic observations that were centered on the Phobos red unit. Among the various candidates that might give rise to this feature, Fraeman et al. (2013) include carbonaceous materials. Our best attempt at modeling the 0.6 μm feature, at a slightly different wavelength than that mentioned in Fraeman et al. (2013), is illustrated in Model 1, where serpentine yields an absorption at 0.65 μm. Unfortunately, the wavelength of the observed band falls at a slightly shorter wavelength than the one produced in the model, making the fit still imperfect and leaving doubts as to the nature of the material that might be causing the absorption. For this reason, serpentine was not included in the second model.
Hiroi et al. (2001, 2003) in their study of Tagish Lake compare spectra of the meteorite to different kinds of asteroids and conclude on the basis of spectral matching that the best candidates are D-type asteroids. The Tagish Lake meteorite is a very friable carbonaceous chondrite with a complex structure that includes a fine-grained opaque matrix consisting of phyllosilicates, magnetite, siderite, and Fe-Ni sulfides peppered with chondrules, isolated grains of olivine, and nodules of Fe–Mn–Mg–Ca carbonates (Rauf et al. 2010; Izawa et al. 2010).
As a further and more rigorous test of the nature of Phobos, we modeled the OSIRIS data using the Tagish Lake meteorite optical constants (Roush 2003). Our best fitting model in this case (Model 2 in Table 3) consists of Tagish Lake and magnesium-rich pyroxene glass (Mg80) and is shown in Figures 3 and 4. Model 2 has a higher reduced WRSS than Model 1, probably due to a mismatch with the OSIRIS data at shorter wavelengths and lack of a band at ∼0.6 μm. However, the overall shape of the Model 2 spectrum over a large wavelength range shows a curvature and albedo level that match both the OSIRIS and the Murchie & Erard (1996) and Rivkin et al. (2002) data much better than Model 1. Both models contain complex organic molecular material, however, Tagish Lake seems to have a composition and/or molecular structure that yields a better fit, particularly in view of the fact that it is a naturally occurring material rather than a synthetic one like the tholin. This gives weight to this model, making it our most promising fit for Phobos. In Figure 5, we plot the individual components included in the two models considered in this work and presented in Table 3.

Figure 5. Individual components included in the two models considered in this work and presented in Table 3. Bottom panel: materials used in Model 1. Top panel: materials used in Model 2 (best fit). Adopted grain sizes (to match those used in the models): Titan tholin, 5 μm; serpentine, 20 μm; basalt glass, 250 μm; olivine, 5 μm; Tagish Lake, 11 μm; pyroxene glass, 20 μm.
Download figure:
Standard image High-resolution image
5. SUMMARY AND CONCLUSIONS
On 2007 February 24, the OSIRIS-WAC and NAC instruments on board the Rosetta spacecraft observed Phobos. We analyzed OSIRIS data and performed a disk-integrated compositional analysis of the Martian satellite. The area which we studied covers from 126° W to 286° W in longitude and from 868 N to 90° S in latitude and it was observed with a phase angle which ranges from 1887 to 1895.
A comparison of the OSIRIS data scaled to match the D-type Trojan asteroid 624 Hektor shows that the spectral slopes are similar. One notable difference is that the Phobos spectrum exhibits a minimum near 0.6 μm that is not observed in the spectrum of Hektor and that is not matched by any of our models.
After scaling the OSIRIS data to match the Simonelli et al. (1998) albedo, we calculated models making use of the Shkuratov et al. (1999) approximation. We provide spectral modeling of the surface of Phobos in the wavelength range between 0.25 and 4.0 μm. We modeled the OSIRIS data and the results of these models were extended to longer wavelengths to compare to the Murchie & Erard (1996) VSK-KRFM-ISM data and the Rivkin et al. (2002) IRTF results. We provided two models, the first one fitting the OSIRIS data better and yielding a composition that includes organic carbonaceous material, serpentine, olivine, and basalt glass. The presence of organic material makes this model questionable as it produces a strong absorption at 3.0 μm not seen in previously obtained Phobos data. Our second model was fit to the OSIRIS data but extended in wavelength to compare to the Murchie & Erard (1996) and Rivkin et al. (2002) data. It includes the Tagish Lake meteorite and magnesium-rich pyroxene glass. When compared to the first model, the second one clearly presents a better fit at 3 μm.
Since Tagish Lake is commonly used as a spectral analog for D-type asteroids (Hiroi et al. 2001, 2003), this provides additional support for compositional similarities between Phobos and D-type asteroids. All these factors are consistent with Phobos being a captured D-type asteroid as previously suggested by Murchie (1999), Rivkin et al. (2002), and Pajola et al. (2012a), who presented an updated scenario based on the collisional capture mechanism of Phobos.
The authors are grateful to the anonymous referee who helped to improve the quality of the paper. Maurizio Pajola wants to thank the Jet Propulsion Laboratory for hosting him in 2012–2013 as a Visiting Scientist. Maurizio Pajola also wants to thank the California waves for teaching him perseverance and the Hawaiian waves for teaching him patience.
Footnotes
- 6
The error bars used in the spectrophotometric plot refer to the absolute flux calibration values, but the auto consistency of each image used for this analysis has been verified to be of the order of 1.5%–2%.
- 7
- 8
We note that Vernazza et al. (2012) have successfully modeled the mid-IR spectrum of 624 Hektor with a model that is quite consistent with that of Cruikshank et al. (2001), employing mafic silicates and carbon, but showing that the mid-IR region is much more sensitive to specific crystalline phases than the NIR, where the principal modeling criteria of matching the red color and the low albedo were met with a simple mixture of Mg-rich pyroxene and carbon.