


ABSTRACT
The Nuclear Spectroscopic Telescope Array (NuSTAR) mission, launched on 2012 June 13, is the first focusing high-energy X-ray telescope in orbit. NuSTAR operates in the band from 3 to 79 keV, extending the sensitivity of focusing far beyond the ∼10 keV high-energy cutoff achieved by all previous X-ray satellites. The inherently low background associated with concentrating the X-ray light enables NuSTAR to probe the hard X-ray sky with a more than 100-fold improvement in sensitivity over the collimated or coded mask instruments that have operated in this bandpass. Using its unprecedented combination of sensitivity and spatial and spectral resolution, NuSTAR will pursue five primary scientific objectives: (1) probe obscured active galactic nucleus (AGN) activity out to the peak epoch of galaxy assembly in the universe (at z ≲ 2) by surveying selected regions of the sky; (2) study the population of hard X-ray-emitting compact objects in the Galaxy by mapping the central regions of the Milky Way; (3) study the non-thermal radiation in young supernova remnants, both the hard X-ray continuum and the emission from the radioactive element 44Ti; (4) observe blazars contemporaneously with ground-based radio, optical, and TeV telescopes, as well as with Fermi and Swift, to constrain the structure of AGN jets; and (5) observe line and continuum emission from core-collapse supernovae in the Local Group, and from nearby Type Ia events, to constrain explosion models. During its baseline two-year mission, NuSTAR will also undertake a broad program of targeted observations. The observatory consists of two co-aligned grazing-incidence X-ray telescopes pointed at celestial targets by a three-axis stabilized spacecraft. Deployed into a 600 km, near-circular, 6° inclination orbit, the observatory has now completed commissioning, and is performing consistent with pre-launch expectations. NuSTAR is now executing its primary science mission, and with an expected orbit lifetime of 10 yr, we anticipate proposing a guest investigator program, to begin in late 2014.
Export citation and abstract BibTeX RIS
1. INTRODUCTION
The last decade has seen a major technological advance in the ability to efficiently focus hard X-rays/soft gamma rays. This breakthrough has enabled the development of instruments that are orders of magnitude more sensitive compared with the collimators and coded mask cameras previously used to observe the cosmos at the these energies. Focusing instruments achieve large concentration factors, such that their collecting area is significantly larger (by factors of 1000 or greater) than the detector area used to register the signal. In the hard X-ray band, where particle interactions result in high detector backgrounds, large concentration factors result in enormous improvements in the signal-to-background ratio over coded mask cameras, where telescope effective areas are typically less than (∼50%) of the detector area. Focusing telescopes operating at energies above 10 keV have been developed and deployed on the High-Energy Focusing Telescope (HEFT), High-Energy Replicated Optics, and InFOCUS balloon platforms (Harrison et al. 2005; Ramsey et al. 2002; Tueller et al. 2005). These balloon experiments paved the way for NuSTAR, ART-XC (to be deployed on Spectrum-Roentgen-Gamma), and ASTRO-H.
The Nuclear Spectroscopic Telescope Array (NuSTAR) Small Explorer mission is the first astronomical telescope in orbit to utilize the new generation of hard X-ray optics and solid-state detector technologies to carry out high-sensitivity observations at X-ray energies significantly greater than 10 keV. The NuSTAR instrument, which focuses X-rays in the band from 3 to 79 keV, is based in large part on the technologies developed for HEFT. NuSTAR began its detailed design phase in 2008 February and was launched into a near-equatorial, low-Earth orbit just over 4 yr later, on 2012 June 13.
In its 2 yr primary science mission, NuSTAR will undertake a broad range of programs that emphasize its unique combination of hard X-ray sensitivity, subarcminute angular resolution, and sub-keV spectral response. In this paper, we provide an overview of the mission (Section 2), describe the mission and instrument designs (Sections 3 and 4), summarize the key in-flight calibrations and performance (Section 5), describe the ground data systems (Section 6), target of opportunity (ToO) response (Section 7), data analysis approach (Section 8), and education and public outreach program (Section 9). We also describe the motivation for observations to be undertaken as part of the 2 yr baseline science mission.
2. NuSTAR OVERVIEW
The NuSTAR observatory, shown in Figure 1, consists of two co-aligned hard X-ray telescopes which are pointed at celestial targets by a three-axis stabilized spacecraft. The observatory was launched from the Reagan Test Site on the Kwajalein Atoll in the South Pacific in a compact, stowed configuration on a Pegasus XL vehicle. On the ninth day after launch, an extendible mast was deployed to achieve the 10.14 m instrument focal length. Table 1 provides an overview of key mission and orbit parameters. The launch site was chosen in order to deploy into a low-inclination orbit, where passages through the South Atlantic Anomaly (SAA)—a region with a high concentration of trapped particles—are minimized. The observatory has no consumables, with the lifetime limited only by the lack of redundant systems and the orbit decay, which will result in re-entry in about 10 yr.

Figure 1. Diagram of the observatory in the stowed (bottom) and deployed (top) configurations.
Download figure:
Standard image High-resolution imageThe NuSTAR science instrument consists of two depth-graded multilayer-coated Wolter-I conical approximation (Petre & Serlemitsos 1985) X-ray optics, which focus onto two independent solid-state focal plane detectors separated from the optics by a ∼10 m focal length. The optics and detectors are designed to be as identical as possible, so that the focal plane images can be co-added to gain sensitivity. Two benches that support the optics and focal plane systems, respectively, are separated by a deployable composite mast. The mast is not sufficiently stiff to maintain the required relative alignment of the benches on orbit. The NuSTAR instrument therefore incorporates an aspect/metrology system consisting of a star camera mounted to the optics bench as well as two laser metrology units. When combined, the tracker and lasers measure the translation, tip, tilt and clocking between the benches. This information is used to reconstruct the instantaneous instrument alignment and pointing direction. The resulting corrections are applied on the ground to correctly back-project individual X-rays onto the sky.
Figure 2 shows NuSTAR's collecting area as a function of X-ray energy compared to selected focusing missions currently in operation. The combination of the low graze angle X-ray optics and the multilayer coatings enables significant collecting area to be achieved out to 78.4 keV, the location of the Platinum K absorption edge. The angular resolution of the observatory is dominated by the optics, and is 18'' FWHM, with a half power diameter of 58''. NuSTAR's focal plane is designed to achieve good energy resolution in the hard X-ray range, with an FWHM response of 400 eV at 10 keV and 0.9 keV at 60 keV. An active anti-coincidence shield reduces background above 10 keV, so that overall the instrument detection threshold represents more than two orders of magnitude improvement over collimated or coded aperture instruments that have flown in this band. Table 2 summarizes the key performance parameters.

Figure 2. Effective collecting area of NuSTAR compared to selected operating focusing telescopes. For consistency, the CCD imagers on Chandra, XMM, and Suzaku are used for comparison. For Suzaku, the area reflects that of four imaging modules, with the current area being lower due to loss of one backside-illuminated detector plane. NuSTAR provides good overlap with these soft X-ray observatories and extends focusing capability up to 79 keV.
Download figure:
Standard image High-resolution image3. NuSTAR OBSERVATORY AND MISSION DESIGN
The NuSTAR observatory is pointed at predetermined locations on the sky by a three-axis stabilized spacecraft based on Orbital Science's LEOStar bus. NuSTAR is designed for long observations (1 day—weeks in duration). The observatory does not re-orient during periods of Earth occultation, and for a typical celestial source (55° > δ > −55°) the observing efficiency is 55%, including occultations and SAA passages; sources at high latitudes can be observed with close to 90% efficiency.
A four-head star camera system, the Technical University of Denmark's μASC (Jorgensen et al. 2004), is used to determine both instrument and spacecraft attitude. Three of the four units are mounted on or near the spacecraft bus and are combined with other spacecraft sensors to provide attitude control and determination. The fourth unit, mounted to the instrument optics bench, is combined with a laser metrology system to determine instrument pointing and alignment (Section 5.4). As a result of the multi-head tracker design and the lack of thermal constraints, NuSTAR can perform science observations at any given time over more than 80% of the sky. For science targets the primary restrictions are a cone of 39° around the Sun and 14° around the full Moon, with other small regions excluded by the requirement that one spacecraft star tracker be available at all times. NuSTAR can point closer to (or even at) the Sun and Moon; however, pointing reconstruction is degraded due to the lack of availability of the optics bench star camera.
NuSTAR was designed such that one side of the observatory always faces the Sun, and pointing to a celestial target is achieved by rotating the observatory about the Sun–Earth vector. This allows the use of a solar array with a single axis of rotation and simplifies the thermal design. As a consequence, the observatory position angle is restricted to 0°–10° from the Sun at any given point in the year, so that the position angle for a particular target depends on when during the year it is observed. Science target observations are generally performed in an inertial pointing mode, which keeps the position angle fixed. A small slew is performed every few days to keep the solar array optimally pointed at the Sun.
4. THE NuSTAR SCIENCE INSTRUMENT
The two co-aligned hard X-ray grazing incidence telescopes form the core of the NuSTAR instrument. The two optics modules are mounted, along with one of the star tracker heads, to a composite, thermally stable bench (see Figure 1). The shielded focal plane modules are mounted to an aluminum structure that is attached to the spacecraft. The two benches are separated by a mast, which was deployed after launch. The mast consists of 57 rectangular structures made stiff after deployment by diagonal cables that latch as the system is deployed (see Figure 3). Due to thermal conditions that vary over an orbit and with aspect angle relative to the Sun, the alignment of the optics and focal plane benches changes in translation, tip, tilt, and relative rotation during an observation. These changes move the location of the optical axis and also the X-ray spot on the detector by about 3 mm (1') each. This changes the alignment and vignetting functions as a function of time. A laser metrology system, combined with the optics-bench-mounted star tracker, measure the varying translation, tilt and rotation of the optics relative to the detectors. These measurements are combined during data processing on the ground to remove image blurring and determine correct response files. The metrology system is read out at a rate of 16 Hz, and the instrument star tracker head samples at 4 Hz. Liebe et al. (2012) describe the metrology system in detail and Harp et al. (2010) provide details of the instrument alignment and pointing reconstruction.
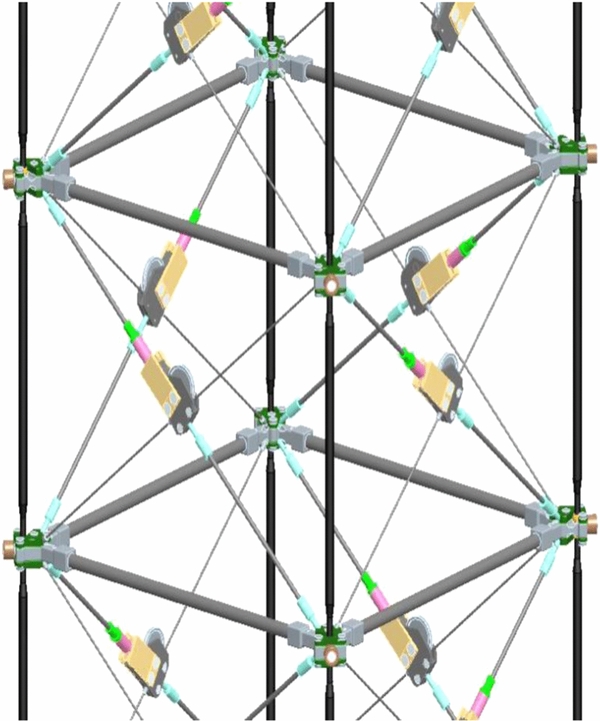
Figure 3. Close-up including one full bay of the NuSTAR mast. Diagonal cables tension and latch during deployment, locking the carbon fiber elements into a stiff structure.
Download figure:
Standard image High-resolution image4.1. Optics
The two NuSTAR optics modules each contain 133 nested multilayer-coated grazing incidence shells in a conical approximation to a Wolter-I geometry. Table 3 provides the key parameters. Each shell is comprised of either 12 or 24 formed glass segments, depending on the radius in the optic. The glass is thin (0.2 mm) sheet glass manufactured by Schott. The optics are coated with depth-graded multilayer structures, which, for energies above ∼15 keV, increase the graze angle for which significant reflectance can be achieved. This increases the field of view (FoV) and high-energy collecting area relative to standard metal coatings. The coating materials and prescriptions vary as a function of graze angle (or, equivalently, shell radius) and have been designed to optimize the broadband energy response and FoV. The inner 89 shells are coated with depth-graded Pt/C multilayers that reflect efficiently below the Pt K-absorption edge at 78.4 keV. The outer 44 shells are coated with depth-grade W/Si multilayers that reflect efficiently below the W K-absorption edge at 69.5 keV.
Table 1. NuSTAR Mission Parameters
| Mission Parameter | Value |
|---|---|
| Mass | 350 kg |
| Power | 600 W |
| Orbit | Low Earth, 650 × 610 km |
| Orbit inclination | 6° |
| Orbit lifetime | ∼10 yr |
Download table as: ASCIITypeset image
Table 2. Key Observatory Performance Parameters
| Parameter | Value |
|---|---|
| Energy range | 3–78.4 keV |
| Angular resolution (HPD) | 58'' |
| Angular resolution (FWHM) | 18'' |
| FoV (50% resp.) at 10 keV | 10' |
| FoV (50% resp.) at 68 keV | 6' |
| Sensitivity (6–10 keV) (106 s, 3σ, ΔE/E = 0.5) | 2 × 10⁻¹⁵ erg cm−2 s−1 |
| Sensitivity (10–30 keV) (106 s, 3σ, ΔE/E = 0.5) | 1 × 10⁻¹⁴ erg cm−2 s−1 |
| Background in HPD (10–30 keV) | 1.1 × 10⁻³ counts s−1 |
| Background in HPD (30–60 keV) | 8.4 × 10⁻⁴ counts s−1 |
| Energy resolution (FWHM) | 400 eV at 10 keV, 900 eV at 68 keV |
| Strong source (>10σ) positioning | 1 5 (1σ) 5 (1σ) |
| Temporal resolution | 2 μs |
| Target of opportunity response | <24 hr |
| Slew rate | 0 06 s−1 06 s−1 |
| Settling time | 200 s (typ) |
Download table as: ASCIITypeset image
Table 3. Optics Parameters
| Optics Parameter | Value | Optics Parameter | Value |
|---|---|---|---|
| Focal length | 10.14 m | Shell length | 22.5 cm |
| No. of shells | 133 | Min. graze angle | 1.34 mrad |
| No. of azimuthal segments | 6 (inner)/12 (outer) | Max. graze angle | 4.7 mrad |
| Inner radius | 5.44 cm | Coatings (inner) | Pt/C |
| Outer radius | 19.1 cm | Coatings (outer) | W/Si |
Download table as: ASCIITypeset image
Compared with soft X-ray telescopes, the optics prescription utilizes smaller graze angles (the angle between an on-axis incident X-ray and the optics shell). This means vignetting losses will become noticeable for off-axis angles above 2'. This factor, when combined with the dependence of the multilayer reflectivity on both the incident angle and energy of the X-ray (higher energy photons have higher reflectivity at shallower graze angles), results in a complex behavior for the effective area of the optic. As illustrated in Figure 4, the optics area as a function of off-axis source position decreases with increasing photon energy. The effective FoV, defined by the furthest off-axis position that has 50% of the on-axis effective area, will therefore decrease with energy: it is 10' at 10 keV and 6' at 68 keV.

Figure 4. Change in effective area as a function of off-axis angle resulting from vignetting in the optics. The curves show the vignetting function for different incident energies. Due to the tightly nested low-graze-angle design and the change in reflectance of the shells as a function of energy, the vignetting is strongly energy dependent above 15 keV.
Download figure:
Standard image High-resolution imageThe optics point-spread function (PSF) is dominated by figure errors inherent in the substrates and in the mounting technique. As a result, unlike Chandra, where the response is dictated by the optical design, for NuSTAR the PSF is not a strong function of off-axis angle. While the detailed shape changes, to first order the area of the encircled energy contours remains approximately constant with off-axis angle.
A detailed description of the optics can be found in Hailey et al. (2010), the coatings are described in Christensen et al. (2011), the substrate production is described in Zhang (2009), and the overall optics fabrication approach is detailed in Craig et al. (2011).
4.2. Focal Plane
Each telescope has its own focal plane module, consisting of a solid state CdZnTe pixel detector (Harrison et al. 2010) surrounded by a CsI anti-coincidence shield. Table 4 provides the key focal plane parameters. A two-by-two array of detectors (Figure 5), each with an array of 32 × 32, 0.6 mm pixels (each pixel subtending 123), provides a 12' FoV. In NuSTAR, each pixel has an independent discriminator and individual X-ray interactions trigger the readout process. On-board processors, one for each telescope, identify the row and column with the largest pulse height and read out pulse height information from this pixel as well as its eight neighbors. The event time is recorded to an accuracy of 2 μs relative to the on-board clock. The event location, energy, and depth of interaction in the detector are computed from the nine-pixel signals (see Rana et al. 2009; Kitaguchi et al. 2011 for details). The depth-of-interaction measurements allow an energy-dependent cut to be made to reduce internal detector background.

Figure 5. Top panel: photograph of a NuSTAR focal plane. The focal plane consists of a 2 × 2 array of CdZnTe pixel detectors, each with 32 × 32 pixels 0.6 mm in size. The detectors are referred to as Det 0–3. Bottom panel: the optical axis nominal location is on Det 0, approximately 1' from the chip gap. In this view, the detector orientation is shown looking down on the focal plane.
Download figure:
Standard image High-resolution imageTable 4. Focal Plane Parameters
| Focal Plane Parameter | Value | Focal Plane Parameter | Value |
|---|---|---|---|
| Pixel size | 0.6 mm/123 |
Max. processing rate | 400 events s−1 module−1 |
| Focal plane size | 12' × 12' | Max. flux meas. rate | 104 counts s−1 |
| Hybrid format | 32 pix × 32 pix | Time resolution (relative) | 2 μs |
| Energy threshold | 2 keV | Dead time fraction (at threshold) | 5% |
Download table as: ASCIITypeset image
Table 5. Level 1 and Priority A NuSTAR Galactic Targets
| Working Group | Target | Exposure Time | Notes |
|---|---|---|---|
| Heliophysics | The Sun | 2 weeks | (2013) |
| Galactic Plane Survey | Galactic center survey | 1.2 Ms | Level 1 target; 2012 Oct+ |
| Sgr A* | 400 ks | Level 1 target; 2012 Jul+ | |
| Limiting Window | 250 ks | ||
| Sgr B2 | 200 ks | (2013) | |
| Norma Survey | 600 ks | ||
| G2 Cloud Infall | 200 ks | (2013) | |
| Young massive clusters | 300 ks | ||
| SNe+ToOs | SN Ia to Virgo | 1 Ms | ToO |
| CC SN in Local Group | 1 Ms | ToO | |
| CC SN shocks | 200 ks | ToO | |
| Tidal disruption flare | 40 ks | ToO | |
| SN 2010jl | 46 ks | 2012 Oct | |
| SNRs+PWNe | SN 1987A | 1.2 Ms | Level 1 target; 2012 Sep+ |
| Cassiopeia A | 1.2 Ms | Level 1 target; 2012 Aug+ | |
| Crab Nebula | ⋅⋅⋅ | Calibration target; 2012 Sep+ | |
| G21.5−0.9 | 300 ks | Calibration target; 2012 Jul | |
| G1.9+03 | 500 ks | ||
| SN 1006 | 500 ks | ||
| MSH 15−52 | 150 ks | ||
| Magnetars | Magnetar ToO | 150 ks | |
| 1E 2259+586 | 170 ks | ||
| 1E 1048−5937 | 400 ks | ||
| AE Aquarii | 126 ks | 2012 Sep | |
| Geminga | 100 ks | 2012 Sep | |
| PSR J1023+0038 | 100 ks | ||
| 1E 1841−045 | 45 ks | 2012 Nov | |
| Binaries | Cen X-4 | 120 ks | |
| Her X-1 | 60 ks | 2012 Sep | |
| Black hole ToO | 200 ks | ||
| Accreting pulsar ToO | 80 ks | ||
| Vela X-1 | 30 ks | 2012 Jul+ | |
| 4U 1820−30 | 60 ks | ||
| V404 Cyg | 150 ks | ||
| IGR J16318−4848 | 50 ks | ||
| IGR J17544−2619 | 48 ks | ||
| SAX J1808.4−3658 | 100 ks | ||
| LS 5039 | 80 ks |
Notes. Exposure time refers to baseline planned on-source integration time. Dates under the notes column refer to when observations were done. For longer observations requiring multiple visits, a plus sign indicates when the observations began. The Priority A target list is subject to change.
Download table as: ASCIITypeset image
Since the detectors do not employ an integrating CCD-style readout, pulse pileup will not occur until source fluxes of ∼105 counts s−1 pixel−1. The processing time per event is 2.5 ms, limiting the rate at which events can be read out to between 300 and 400 events s−1 module−1. For each event, the live time since the previous event is recorded to an accuracy of 1 μs, so that fluxes can be measured to 1% accuracy even for incident count rates of 104 cps. Harrison et al. (2010) give a detailed description of the operation of the custom ASIC readout.
The focal plane detectors are placed inside a CsI anti-coincidence shield. Events resulting in a simultaneous energy deposition in both the surrounding anti-coincidence shield and the detector are rejected on board by a processor as background. The opening angle of the shield is large (15° FWZI), greatly exceeding the sky solid angle blocked by the optics bench; thus, to limit diffuse background impinging on the detector, a series of aperture stops were deployed post-launch simultaneously with the mast. The aperture stops collimate the detector to a 4° FWZI field, which is partially but not completely blocked by the optics bench. This results in some stray light, which dominates the background below 10 keV (Section 5.3).
4.3. The Mast and Metrology System
The NuSTAR mast structure provides the required 10.14 m separation between the optics and the focal plane detectors. The mast was engineered by ATK Space Systems from segments made up of carbon fiber, aluminum, and steel components, designed to be as isothermal as possible in order to minimize structural distortions. The 57 bays (see Figure 3) of the mast were deployed on orbit and locked in place by tensioned steel cables. Although the mast has a low net coefficient of thermal expansion, orbital day/night extremes create residual deflections that result in motion of the optical axis and the X-ray focal point on the focal plane detectors. Thermal modeling of the system pre-launch indicated that the deflection would range from less than 1 mm per orbit in the most favorable orientations to a few mm in the least favorable.
The mast motion is tracked by the combination of a metrology system (Liebe et al. 2012) and the instrument star camera head. The metrology system consists of two IR lasers mounted on the optics bench with their beams focused on two corresponding detectors on the focal plane bench. The lasers are mounted in a temperature-controlled Invar structure rigidly mounted to the optics bench. The star tracker is also mounted to that bench, which was engineered from carbon fiber structural elements to provide less than 2'' of relative deflection with respect to the optics modules during on-orbit thermal conditions.
The laser beam positions are monitored by silicon position-sensitive detectors mounted near the focal plane modules. Filters and baffles mounted at the detectors reject scattered Sun and Earth light and provide for high signal to noise, producing ∼10 μm (01) accuracy for each laser spot position. On-ground analysis of signals from the two detectors, combined with the star tracker quaternion, separates translational and rotational deflections in the positions of the two benches and enables both accurate correction of the position of the X-ray photons on the focal plane modules and construction of the vignetting function appropriate for a given observation.
5. IN-FLIGHT CALIBRATION AND SCIENCE PERFORMANCE
During the first two months on-orbit, the NuSTAR observatory made a series of observations for performance verification, as well as for internal calibration and cross-calibration with other missions. The pre-launch NuSTAR responses were based on ground calibration data, and they have been adjusted to reflect on-orbit measurements. In the case of the response files, required post-launch adjustments are at the 10%–20% level for both the absolute normalization and relative responses. These discrepancies are consistent with the overall accuracy of ground calibration and arise from a combination of statistical and systematic uncertainties in ground measurements and simplified models of complex phenomena associated with high-energy multilayers and the low-energy (E < 10 keV) detector response. The cost constraints of a small explorer precluded extensive ground calibrations, and the final response functions were always planned to be adjusted through in-flight measurements and cross-calibration with other missions. The current responses, corrected using data from the Crab, have residual systematic errors of less than 5%, which is acceptable for scientific analysis. A more detailed calibration paper is in preparation (K. K. Madsen et al. 2013, in preparation). The sections below briefly present results from cross-calibration and performance verification.
5.1. Point-spread Function and Optics Response
The PSF of the telescopes is a convolution of the optics and focal plane detector response combined with residual errors from the metrology system and attitude reconstruction. The dominant contributor is the optics, with residual terms arising from finite detector sampling and imperfect mast motion and attitude reconstruction at the few-arcsecond level. The PSF has been measured in-flight using high signal-to-noise observations of bright point sources. The PSF shape consists of a sharp inner core with a full width at half-maximum (FWHM) of 18'' and a half-power diameter (diameter of a circle enclosing half of the X-ray counts from a point source) of 58''. Figure 6 shows the encircled counts fraction as a function of diameter for a circular extraction region (left panel) as measured for telescope module A (the telescope and focal plane modules are designated by A and B), from an observation of the accreting Galactic binary black hole GRS 1915+105. The right panel of the figure shows a stretched image, demonstrating the azimuthal symmetry of the response. The PSF for module B is within 2'' of that of module A.

Figure 6. Measurement of the on-axis PSF of module A using data from observations of the bright point source GRS 1915+105. The top panel shows the encircled energy as a function of the diameter of a circular extraction region. The bottom panel shows an image stretched so that features from the mounting structure are evident, demonstrating the azimuthal symmetry of the response.
Download figure:
Standard image High-resolution imageThe normalization of the NuSTAR effective area in the 2–10 keV band has been verified in flight by simultaneous observations of the Crab Nebula and its pulsar, and the quasar 3C 273 with XMM-Newton, Suzaku, Swift, and Chandra. Flux measurements in the 5–10 keV band derived for NuSTAR have been compared for the indicated calibration observations, as well as for science targets. We find that the overall normalization in the 5–10 keV band agrees well with the XMM-Newton PN, the Suzaku XIS, and Swift with typical cross-calibration corrections at the 10% level, similar to the cross-calibration factors among the various soft X-ray observatories. The NuSTAR relative response also matches nicely with XMM-Newton PN and MOS, and Suzaku XIS in the 3–10 keV band (see Figure 7). In a joint observation of the active galaxy IC 4329A with NuSTAR and Suzaku, the absolute flux in the 3–10 keV band measured with XIS 0 was (8.30 ± 0.03) × 10−11 erg cm−2 s−1, and for focal plane modules A and B the measured flux was (9.23 ± 0.03) × 10−11 erg cm−2 s−1 and (8.95 ± 0.03) × 10−11 erg cm−2 s−1, where quoted errors represent 90% confidence intervals.

Figure 7. Suzaku XIS and NuSTAR spectra of the AGN IC 4329A in the 2–10 keV band. The green and orange and magenta points are for XIS 0, 1, and 3, respectively. The red and blue points are for NuSTAR focal plane modules A and B, respectively. The top panel shows the spectra, with residuals shown as a ratio on the bottom panel. The same model was used to fit both NuSTAR and Suzaku spectra (see the text for details). The relative calibration of the two instruments is good over this energy range. The absolute cross-normalization agrees to within 10%.
Download figure:
Standard image High-resolution imageThe systematic calibration errors between NuSTAR's A and B telescopes are at the 3% level, with a 10% normalization uncertainty relative to Suzaku. Direct comparisons with INTEGRAL-ISGRI and Suzaku-PIN at higher energies are more difficult, with larger cross-normalization factors and higher uncertainty in the case of the PIN due to challenges with background subtraction. However, these cross-calibrations are ongoing, and will be aided by high count-rate joint observations of Cygnus X-1 and the Crab.
5.2. Spectral and Temporal Resolution
The in-flight spectral response of the NuSTAR focal plane detectors matches well with pre-launch calibration measurements. Each focal plane module is equipped with a radioactive 155Eu calibration source that can be placed in the FoV. Figure 8 shows a spectrum taken during on-orbit commissioning. At energies below ∼50 keV, the resolution is 400 eV FWHM and is constant with energy, being determined by the electronic noise. Above this, the energy resolution broadens due to charge trapping effects in the detector. The FWHM response is 1.0 keV at the 86 keV decay line. The good resolution over a broad energy range enables NuSTAR to perform spectroscopy extending from below the Fe-line range up to 79 keV. Figure 9 shows a spectrum from a 15 ks exposure of the accreting neutron star Vela X-1 taken by NuSTAR during the instrument commissioning phase. Fe lines are well measured, along with the continuum extending up to 79 keV. A clear cyclotron resonance scattering feature can be seen at 55 keV.

Figure 8. Spectrum of the 155Eu flight calibration source for focal plane module A taken during on-orbit commissioning. The FWHM energy resolution is 400 eV below ∼40 keV and increases to 1 keV at 70 keV.
Download figure:
Standard image High-resolution image
Figure 9. Spectrum with 15 ks exposure of Vela X-1 taken by NuSTAR. The red points show data from focal plane module A and the blue points are from module B. The inset shows the Fe-line region. The good broadband response enables NuSTAR to measure both Fe-line fluxes and high-energy continuum. A cyclotron resonance scattering feature (CRSF) is seen with high significance at 55 keV.
Download figure:
Standard image High-resolution imageBecause NuSTAR has a triggered readout (similar to a proportional counter and unlike an integrating CCD), timing analysis is possible on short timescales for sources of moderate count rate (<200 counts module−1). For very bright targets, the 2.5 ms deadtime per event limits the ability to search for features on millisecond timescales. NuSTAR maintains relative stability of event timing to 1–2 ms by correcting the drift of the spacecraft clock on long (day to weeks) timescales. This drift correction is done using the relative spacecraft clock time to UT that is routinely measured during ground station contacts. The absolute time relative to UT is currently only known to 5 ms; however, calibration to the sub-millisecond level using a pulsar with a known ephemeris is planned.
5.3. Background
The NuSTAR background measured on orbit is well within the range predicted by pre-launch Monte Carlo modeling. Background prediction for a well-shielded instrument is difficult due to the poorly characterized input particle spectra, so that pre-launch predictions had uncertainties of a factor of four. Figure 10 shows the background spectrum taken during an observation of the Extended Chandra Deep Field South (ECDFS) in late 2012 September. At low energies (E < 10 keV), the background is dominated by diffuse cosmic flux entering through the aperture stop. This component is not uniform across the FoV, so some care is required in choosing regions for background subtraction at low energies for faint sources. The internal background consists of albedo from Earth's atmosphere and fluorescence lines from the CsI shield, as well as internal activation lines produced largely by particles trapped in the SAA. This component is spatially uniform across a given detector chip, but does vary from detector to detector.

Figure 10. Background spectra for focal plane module A (green) and B (blue) from observations of the Extended Chandra Deep Field South (ECDFS). At low energies the background is dominated by leakage through the aperture stop, while at high energies (E ≳ 10 keV) atmospheric albedo and activation components dominate. Several prominent lines can be seen in the 20–40 keV band, which are a combination of fluorescence from the CsI shield and electron capture to the ground state plus binding energy release from elements with Z = 46–56.
Download figure:
Standard image High-resolution imageThe low inclination of the NuSTAR orbit results in stable background compared with missions that experience a larger range of geomagnetic latitude and more frequent SAA passages. The background increased slowly in the several months after launch as a result of activation components, although it has now largely stabilized. On orbit, the background in the 3–79 keV band varies primarily as a function of geomagnetic latitude, with the exception of the interval from 24 to 26 keV, where two lines with half-lives of less than 1 hr result in variations dependent on time elapsed since an SAA passage. For observations significantly longer than an orbit, these variations average out, leaving systematic uncertainties in background subtraction of <1%.
Two modes of background subtraction have been developed depending on whether or not a source-free background region is available in the FoV. For point sources with background regions available on the same chip, standard procedures employed in soft X-ray focusing telescopes apply. For extended sources where clear background extraction regions do not exist, the background can be scaled from deep survey fields and filtered to match the average geomagnetic cutoff for the observation. Both techniques work well and can be applied to extract spectra at levels well below that of the background.
5.4. Alignment and Absolute Astrometry
The NuSTAR mast, optics bench, and focal plane bench were co-aligned on the ground to within a few millimeters. This ensured that on orbit the deployed benches would be well within the adjustment capability of the mast adjustment mechanism mounted at the tip of the mast. After deployment on orbit, the mast tip was adjusted in two steps to place the optical axis of the telescopes at the desired position on the focal plane detectors. X-ray sources with known positions were then observed to measure the relative positions of the optics, focal plane detectors, laser metrology system, and optics-bench-mounted star tracker.
As described in Section 4.3, the metrology system measures the relative positions of the optics and focal plane benches while the star tracker provides absolute celestial reference. Due to thermal effects, the benches move relative to one another in translation over an orbit that, when combined with the mast tilt, results in motion of the optical axis on the X-ray focal plane detectors by 3–4 mm (1'–1 2; see Figure 11). This relative motion is measured and removed using the metrology system. The absolute orientation of the optics bench is measured by the star tracker.

Figure 11. Left: measured location of the laser beam on the metrology system position sensitive detector (PSD) for module A. The three sets of tracks show 5–6 orbits each for three different celestial targets differing in pointing direction relative to the Sun. The character of the motion changes with thermal conditions, with the maximum amplitude being ∼3 mm. Right: motion of the optical axis (OA) of the X-ray optic on the focal plane detector resulting from the mast motion for module A. The optical axis moves by about 3 mm or 1' over the course of an orbit.
Download figure:
Standard image High-resolution imageFor absolute alignment, we used a set of reference observations to determine the relative alignment of the instrument components. The absolute astrometric positions of bright X-ray sources with known positions were observed to be within ±8'' (90%) using the updated in-orbit alignment data. The systematic astrometry offsets are a function of aspect relative to the Sun, as well as seasonal variations affecting the average illumination during non-occulted viewing periods. Further updates to the alignment parameters that take longer term variations into account are expected to result in a final performance (systematic contribution) of ±3'' (90%), with the error being dominated by the inherent stability and accuracy of the optics-bench-mounted star tracker.
6. GROUND DATA SYSTEMS
The primary NuSTAR ground station is located in Malindi, Kenya, and is operated by the Italian Space Agency (ASI). This station provides 12 min duration contact opportunities every orbit. Malindi provides NuSTAR with four of these contacts per day. For sources with nominal count rates, all data can easily be downlinked. For high-count-rate targets (≳50 cps), additional downlink is required from a station located in Hawaii, operated by the Universal Space Network (USN). Owing to the relatively high latitude of the Hawaii station, only three long-duration (6–8 minute) passes per day are possible. Commands can be sent to the spacecraft via Malindi, USN Hawaii, or via the Tracking and Data Relay Satellite System (TDRSS). This enables almost continuous command capability, so that the time for responding to ToOs can be quite short (a few hours).
From Malindi, data are sent via internet to NASA JSC and then relayed to the Mission Operations Center (MOC) at UCB. After being unpacked and entered in a database, the Level 0 data are sent by internet to the Science Operations Center (SOC) located at Caltech, where they are processed into higher level products. This process is typically completed within an hour of a ground station pass, so that data can be quickly assessed for quality and provided to the science team.
Science planning takes place at the SOC, where observation sequences are prepared and sent via a messaging system to the MOC. The MOC converts the observation sequence into an absolute time sequence file that is uploaded to the spacecraft for execution.
7. TARGET OF OPPORTUNITY RESPONSE
NuSTAR's science program includes a number of ToO observations that require repointing the observatory at new or variable phenomena on a timescale of hours to days. The response time to a ToO is guaranteed to be <24 hr and can be considerably less for high priority targets. After receipt of a ToO request, the SOC must create a message file in order to reorient the observatory. This typically can be completed in 1–2 hr, and validation of the request and preparation for uplink accomplished in an additional 1–2 hr. If urgent, a TDRSS uplink can be scheduled and executed with an additional few hour latency. After the observatory receives the new pointing request, slews take place at 006 s−1, so that a full 180° reorientation takes less than an hour. So, at best a ToO can take place on a 3–4 hr timescale, with 12–24 hr being more typical.
The NuSTAR team monitors supernova (SN) alerts as well as other astrophysical alerts daily. Other targets monitored for potential ToO triggers include unusual X-ray binary activity, magnetar flares, tidal disruption flares, SN X-ray shocks, and exceptionally energetic gamma-ray bursts.
8. DATA ANALYSIS
The NuSTAR Data Analysis Software (NuSTARDAS) consists of a set of general FITS file utility programs and mission-specific data analysis tools designed to process the NuSTAR FITS-formatted telemetry data and generate high-level scientific data products, including cleaned and calibrated event files, sky images, energy spectra, light curves, and exposure maps.
The NuSTARDAS software modules, jointly developed by the ASI Science Data Center (Frascati, Italy) and the California Institute of Technology (Caltech, Pasadena USA), are written in FTOOLS style (the FTOOL protocol was developed by the High Energy Archive Science Research Center, or HEASARC, at NASA GSFC). The whole package is fully compatible with the HEASoft software, maintained and distributed by the HEASARC, where it will be officially integrated. The NuSTARDAS input and output files are in FITS format and fully comply with the NASA/GSFC Office of Guest Investigator Programs FITS standard conventions. The NuSTAR software tasks retrieve the calibration files structured in HEASARC's calibration database system.
The software is designed as a collection of modules, each dedicated to a single function. The input of the NuSTARDAS package is the NuSTAR FITS-formatted telemetry data (Level 1) produced at the NuSTAR Science Operation Center in Caltech. The NuSTARDAS data processing is organized in three distinct stages:
- 1.Data calibration. Processing of the FITS-formatted telemetry to produce Level 1a calibrated event files. This step includes the event energy and gain corrections, the search for and flagging of hot/bad pixels, the assignment of NuSTAR grades, the transformation from raw to sky coordinates, and the metrology data processing.
- 2.Data screening. Filtering of the calibrated event files by applying cleaning criteria on specified attitude/orbital/instrument parameters and event properties to produce Level 2 cleaned event files.
- 3.Product extraction. Generation of Level 3 scientific data products (light curves, energy spectra, sky images, ancillary response files, and redistribution matrix files).
The package also includes a main script, the NuSTAR pipeline (named "nupipeline"), allowing the user to run automatically in sequence all the tasks for the data processing. The package has also been designed to allow users to reproduce any stage of the data processing that is necessary, for example, because of improved calibration information and/or updated software modules, or because the user wishes to use a non-standard data processing procedure. To this end, the "nupipeline" script is the main interface for users.
9. EDUCATION AND PUBLIC OUTREACH
The main purpose of the NuSTAR Education and Public Outreach (E/PO) program is to increase student and public understanding of the science of the high-energy universe. We have developed a multi-faceted program that capitalizes on the synergy of existing high-energy astrophysics E/PO programs to support the mission's scientific objectives. Our education and public engagement goals are to facilitate understanding of the nature of collapsed objects, develop awareness of the role of SNe in creating the chemical elements, and to facilitate understanding of the physical properties of the extreme universe. The E/PO program has additional, more general goals, including increasing the diversity of students in the science, technology, engineering, and mathematics (STEM) pipeline, and increasing public awareness and understanding of the NuSTAR science and technology program.
We are implementing a program that includes elements in higher education, elementary and secondary education, informal education, and public engagement. These elements include educator workshops through NASA's Astrophysics Educator Ambassador program, a technology education unit for formal educators, articles for Physics Teacher and/or Science Scope magazines, and work with informal educators on a museum exhibit that includes a model of NuSTAR and describes the mission's science objectives. Extensive outreach is also underway by members of the science team, who are working with high school students, undergraduates, and graduate students. We are also developing printed materials that describe the mission and special workshops for girls at public libraries in order to improve the STEM pipeline.
10. THE BASELINE NuSTAR SCIENCE PROGRAM
The baseline NuSTAR science program began on 2012 August 1, and extends for 25 months, until 2014 September 30. During this time, the NuSTAR science team is planning and executing a series of observations aimed at addressing five key scientific goals, described in detail below, that were the basis for NuSTAR's selection through NASA's Explorer Program competition. In addition to these large projects, the NuSTAR science team has designed and planned a series of observations to be completed during the primary mission phase. Tables 5 and 6 summarize the highest priority observations that NuSTAR will undertake during its baseline mission, with the key programs designated as "Level 1" targets. A number of the observations are coordinated with XMM, Suzaku, Chandra, Swift, or INTEGRAL. In addition, for every NuSTAR field, the Swift XRT is taking a 1 ks exposure, in order to constrain the low-energy source properties. A Guest Investigator (GI) program will be proposed to NASA, with the aim of extending the mission to allow for broad participation of the community and an expansion of the scientific scope beyond that of the baseline mission, as well as the additional high priority (Priority A) observations.
Table 6. Level 1 and Priority A NuSTAR Extragalactic Targets
| Working Group | Target | Exposure Time | Notes |
|---|---|---|---|
| ULXs | NGC 1313 | 220 ks | Joint XMM-Newton |
| IC 342 | 250 ks | 2012 Aug, joint XMM-Newton | |
| NGC 5204 | 260 ks | Joint XMM-Newton | |
| M81-X9 (Holmberg IX–XI) | 200 ks | 2012 Oct+, joint XMM-Newton | |
| Extragalactic surveys | ECDFS | 3.7 Ms | Level 1 survey; 2012 Sep+ |
| COSMOS | 3.7 Ms | Level 1 survey; 2012 Nov+ | |
| Swift/BAT Survey | 1.6 Ms | Level 1 survey; 100 targets, 16 ks each + 7 ks Swift XRT | |
| Blazars+radio galaxies | Mkn 421 | 300 ks | Monitoring with MAGIC, Veritas, Swift |
| BL Lac | 20 ks | Multiwavelength campaign | |
| 3C454.3 | 300 ks | Multiwavelength campaign | |
| PKS 2155−304 | 300 k | Multiwavelength campaign | |
| B2 1023+25 | 50 ks | ||
| AGN physics | 3C 273 | 300 ks | Calibration target; 2012 Jul |
| MCG 6-30-15 | 180 ks | Joint XMM-Newton | |
| Ark 120 | 90 ks | Joint XMM-Newton | |
| 3C 120 | 180 ks | Joint XMM-Newton | |
| Swift J2127.4+5654 | 180 ks | 2012 Nov+, joint XMM-Newton | |
| NGC 4151 | 150 ks | 2012 Nov, joint Suzaku | |
| IC 4329A | 185 ks | 2012 Aug, joint Suzaku | |
| NGC 3783 | 300 ks | ||
| MCG 5-23-16 | 300 ks | ||
| Obscured AGNs | NGC 1365 | 360 ks | Joint XMM-Newton |
| NGC 1068 | 300 ks | ||
| NGC 4945 | 150 ks | ||
| Circinus | 120 ks | ||
| WISE AGNs | 80 ks | 4 targets, 20 ks each; 2012 Oct+ | |
| BALQSOs | 140 ks | PG 1004+130, PG 1700+518; 2012 Sep+ | |
| Mrk 231 | 50 ks | 2012 Aug | |
| Arp 220 | 66 ks | ||
| Mrk 273 | 66 ks | ||
| IRAS 05189−2524 | 33 ks | ||
| Super Antennae | 66 ks | ||
| ULIRG Shallow Survey | 100 ks | 5 targets, 20 ks each | |
| IC 2560 | 50 ks | ||
| SDSS type 2 QS0s | 40 ks | 2 targets, 20 ks each; 2012 Oct+ | |
| Galaxy clusters+relics | Bullet Cluster | 250 ks | 2012 Oct+ |
| A2256 | 250 ks | ||
| Starburst galaxies | NGC 253 | 540 ks | 2012 Sep+ |
| M82 | 100 ks | ||
| NGC 3310 | 30 ks | ||
| Arp 299 | 180 ks | ||
| M83 | 180 ks |
Notes. Exposure time refers to baseline planned on-source integration time. Dates under the notes column refer to when observations were done. For longer observations requiring multiple visits, a plus sign indicates when the observations began. The Priority A target list is subject to change.
Download table as: ASCIITypeset image
The sections below describe the motivation for the key science programs defined in the original NuSTAR proposal to NASA's Explorer Program.
10.1. Extragalactic Surveys: Probing AGN Activity over Cosmic Time
Resolving the sources that make up the cosmic X-ray background (XRB) has been a primary driver for X-ray astronomy over the last 50 yr. Huge strides have been made with sensitive surveys undertaken by the Chandra and XMM-Newton observatories (e.g., Alexander et al. 2003; Harrison et al. 2003; Luo et al. 2008; Elvis et al. 2009; Laird et al. 2009). These surveys have resolved 70%–90% of the 0.5–10 keV XRB (e.g., Worsley et al. 2005; Hickox & Markevitch 2006; Xue et al. 2011), revealing obscured and unobscured AGNs out to z ∼ 5–6 (e.g., Tozzi et al. 2006; Brusa et al. 2009; see Brandt & Alexander 2010 for a recent review). However, Chandra and XMM-Newton are only sensitive to sources emitting below 10 keV, far from the ∼20–30 keV peak and therefore leaving significant uncertainties on the properties of the sources that dominate (e.g., Ajello et al. 2008; Ballantyne et al. 2011). By contrast, the directly resolved fraction of the XRB at the 20–30 keV peak from current >10 keV surveys is only ∼2% (e.g., Krivonos et al. 2007; Ajello et al. 2008), and while the sources detected in Chandra and XMM-Newton surveys must resolve at least an order of magnitude more, no direct observational constraints are currently available.
The NuSTAR extragalactic survey will provide a significant breakthrough in revealing the composition of the XRB at the 20–30 keV peak, achieving individual source detection limits approximately two orders of magnitude fainter than those previously obtained at >10 keV (e.g., Bird et al. 2010; Tueller et al. 2005; Ajello et al. 2012). This will provide a clean obscuration-independent selection of AGN activity (at least out to NH ≈ 1024 cm−2), required to test claims from Chandra and XMM-Newton surveys that the fraction of obscured AGNs increases with redshift (e.g., La Franca et al. 2008; Treister & Urry 2006). The NuSTAR extragalactic survey (Table 7) has three primary components: (1) a deep (∼200–800 ks) small-area (∼0.3 deg2) survey of the ECDFS, (2) a medium (∼50–100 ks) wider-area (1–2 deg2) survey of the COSMOS field, and (3) a shallow (∼15 ks) serendipitous survey (∼3 deg2), achieved by targeting 100 Swift-BAT AGNs. With this multilayered approach, the NuSTAR extragalactic survey will cover a broad range of the flux-solid angle plane and is expected to directly resolve 30%–50% of the 10–30 keV background from individual source detections alone (e.g., Ballantyne et al. 2011). Sensitive average constraints on the composition of the XRB will also be obtained by stacking the NuSTAR data of the faint X-ray sources detected at E < 10 keV by Chandra and XMM-Newton in the ECDFS and COSMOS fields.
Table 7. Extragalactic Survey Fields
| Exposure | Depth (10–30 keV) | Area | ||
|---|---|---|---|---|
| Survey | Field | (ks) | (erg cm−2 s−1) | (deg2) |
| Deep | ECDFS | 200–800 | ∼2 × 10⁻¹⁴ | 0.3 |
| Medium | COSMOS | 50–200 | ∼4 × 10⁻¹⁴ | 1–2 |
| Shallow | Centered on 100 Swift-BAT AGNs | 15 | ∼1.5 × 10⁻¹³ | 3 |
Download table as: ASCIITypeset image
Figure 12 shows the expected luminosity–redshift distribution for the different NuSTAR extragalactic surveys, derived using the methodology in Ballantyne et al. (2011), along with the positions in this diagram for the first seven NuSTAR serendipitously detected AGNs (D. M. Alexander et al. 2013, in preparation). We predict ∼160–200 NuSTAR-detected sources (∼65–80 at 10–30 keV) from the medium and deep NuSTAR survey components, the majority at redshifts between 0.5 and 2 with X-ray luminosities in the range of LX ∼ 1043–1045 erg s−1. These ranges in redshift and luminosity correspond to the peak epoch in the black hole accretion history of the universe and the knee of the X-ray luminosity function (e.g., Ueda et al. 2003; La Franca et al. 2008; Aird et al. 2010); thus, NuSTAR should detect the AGN source population that dominates the cosmic growth of black holes. The shallow serendipitious survey will achieve two principal aims: (1) provide the identification of serendipitous sources to trace the bright end of the >10 keV XRB population and (2) provide the best global characterization of the high-energy component of the nearby AGN population (e.g., absorption, reflection strength, and high-energy cutoff), to allow for the more accurate modeling of the XRB source populations. We predict ∼100 NuSTAR-detected sources in the serendipitous survey (∼30 at 10–30 keV), the majority at z < 1 with LX ∼ 1043–1045 erg s−1.

Figure 12. Expected luminosity–redshift distribution for the different NuSTAR Extragalactic surveys. The black diamonds show the distribution of Swift-BAT AGNs, the red squares show the expected distribution of serendipitous sources in BAT fields, the pink stars show expected results from COSMOS, and the green stars from ECDFS. The large blue circles show the luminosities and redshifts for the first seven serendipitous sources discovered in NuSTAR extragalactic fields.
Download figure:
Standard image High-resolution image
10.2. Galactic Surveys: Studying Compact Objects in the Milky Way
NuSTAR's Galactic surveys will extend hard X-ray studies to fainter levels with the aim of detecting large numbers of compact objects (black holes, neutron stars, and white dwarfs), determining the hard X-ray morphology of the diffuse emission in the central few dozen parsecs of the Galaxy, monitoring the temporal and spectral properties of the supermassive black hole (SMBH) Sgr A*, and determining the origin of the Galactic diffuse XRB.
The Galactic center and Galactic bulge contain large numbers of compact objects (X-ray binaries and cataclysmic variables, CVs) of interest for accretion studies, as well as highly magnetized or rapidly rotating neutron stars (NS). By detecting compact stellar remnants in hard X-rays, we can elucidate how populations evolve from groups of single and binary high-mass and low-mass stars to reach the ends of their lives as compact objects. Chandra has previously uncovered in excess of 6000 sources in a 2° × 08 region (Muno et al. 2009). There is evidence that CVs are the largest component of this population. However their nature, whether magnetic or non-magnetic, and their classification remain uncertain. Determining hard X-ray spectral and timing properties will provide important constraints.
NuSTAR will perform a deep survey of a 2° × 08 region around the Galactic center and, depending on spectral hardness of the source population, should detect up to 100 compact objects. In addition to the CVs, there are also 30 X-ray sources that have been identified as massive stars (Mauerhan et al. 2010), indicating the presence of a significant younger population. INTEGRAL observations of this region are extremely source-confused, and NuSTAR's vastly better PSF is required to determine which sources have hard X-ray counterparts. It is also unclear from the Chandra observations whether the massive stars are single or binary and whether any binaries harbor compact objects. There are currently only about 100 high-mass X-ray binaries (HMXBs) known in the entire Galaxy, and NuSTAR (via hard X-ray spectral and timing properties) can determine whether more HMXBs are present in this region.
NuSTAR will also look at other regions of the Galaxy with populations of different ages. A major open question in Galactic dynamics is the relative evolutionary states of the different spiral arms. It is thought that the Carina arm (Smith & Brooks 2007) is much less evolved than the Norma arm, which, in turn, is less evolved than the Galactic center region; however, this has not been demonstrated unambiguously. While the number of known HMXBs has increased with INTEGRAL, it is still likely that the HMXB population is being significantly undercounted. If it is true that the Norma region population is significantly younger than the Galactic center population, then one would expect NuSTAR to find a much higher HMXB-to-CV fraction.
NuSTAR will survey the 2° × 08 region in Norma covered by Chandra (Muno et al. 2009). While Chandra provides subarcsecond source positions and soft X-ray information, a NuSTAR survey of the same region will expand our understanding of the source populations. For example, INTEGRAL results suggest that there may be a large number of low-luminosity HMXBs, an important consideration when the HMXB luminosity function is used as a star formation rate indicator in distant galaxies (Grimm et al. 2003). Furthermore, understanding HMXB evolution (as well as the overall number of HMXBs) will help constrain the relative numbers of NS/NS, NS/BH, and BH/BH binaries (Tauris & van den Heuvel 2006).
The Galactic surveys are also elucidating the morphology of the central few tens of parsecs around the Galactic center. This region contains X-ray emission from the SMBH Sgr A*, numerous pulsar wind nebulae, supernova remnants (SNRs), and molecular clouds (Baganoff et al. 2003). Of particular interest for NuSTAR are the flares from Sgr A*. These flares, seen about once per day, have been detected from radio wavelengths all the way to the soft X-ray band, but only hard X-ray upper limits existed until NuSTAR observed a large flare in 2012 July. The NuSTAR data, in conjunction with observations at lower energies, put tight constraints on emission mechanisms (Barrière et al. 2013). Further campaigns are planned for next year, to be coordinated with Chandra, XMM, and Keck. INTEGRAL has observed this region extensively (Bélanger et al. 2006); however, it is severely source-confused given the 12' FWHM PSF. With subarcminute angular resolution and ∼3'' localizations, NuSTAR is searching for hard X-ray sources and mapping the complex diffuse emission surrounding Sgr A* out to ∼50 keV.
NuSTAR will also map diffuse hard X-ray emission from molecular clouds. In particular, Sgr B2 has recently attracted much attention, since its diffuse Fe–K and continuum X-ray emission are time correlated, as would be expected if the emission is in response to intense flaring activity of some bright source, possibly Sgr A*, in the past (Sunyaev & Churazov 1998). A less likely alternative is injection of cosmic rays into the cloud (Yusef-Zadeh et al. 2007) with subsequent X-ray emission. These processes predict distinct morphological differences in the hard X-ray continuum emission, enabling us to distinguish between the two models; furthermore, by measuring the strength of the inverse Compton continuum emission, we can constrain the density of the cloud and therefore the required input energy (Ponti et al. 2012).
The 2° × 08 Sgr A* survey when combined with the observation of the low column density Limiting Window, NuSTAR should also be able to resolve the nature of the Galactic diffuse high-energy XRBs. Likely due to unresolved point sources (Revnivtsev et al. 2009; Hong 2012), it is not clear what fraction is due to magnetic CVs versus coronally active giants, which would have relatively soft spectra. NuSTAR's ability to measure hard X-ray spectral properties should settle this issue.
10.3. Broadband Observations of Blazars and the Nature of Relativistic Jets
Many active galaxies possess prominent relativistic jets, and if they point close to our line of sight, jet emission can dominate the radiative output of the object from radio to very energetic γ-rays. Termed "blazars", the emission from these sources is highly variable, by up to factors of 100 in the optical (see, e.g., Wagner & Witzel 1995) and 1000 in γ-ray (see, e.g., Ackermann et al. 2010; Wehrle et al. 2012). Blazar spectral energy distributions generally consist of two prominent, broad humps, one peaking in the millimeter-to-X-ray spectral range and the other in the hard X-ray-to-high-energy γ-ray range. Synchrotron emission is responsible for the low-energy peak, while inverse Compton produces the gamma-ray hump. General coincidence of variability patterns in the far-IR to optical band with the γ-ray band suggests that the two processes are likely to originate from the same population of highly relativistic electrons, with Lorentz factors γel reaching 106 or higher. The situation in the X-ray band is less clear, since the variability is only modestly correlated with that in the optical and γ-ray bands (see, e.g., Bonning et al. 2009; Hayashida et al. 2012).
Hard X-ray measurements are important diagnostics of the content of the jet, as well as of the processes responsible for the acceleration of particles to the very highest energies. In luminous blazars—often associated with powerful quasars—the X-ray spectra are generally hard, suggesting that the X-ray band represents the onset of the inverse Compton component (see, e.g., Kubo et al. 1998). The low-energy end of the Compton component is produced by particles with the highest energies, since the particle spectrum falls steeply with energy so that X-ray observations constrain the total particle content of the jet (see, e.g., Sikora & Madejski 2000). Conversely, in the low-luminosity objects, the X-ray band is thought to be the high-energy end of the synchrotron component, and is therefore produced by the most energetic "tail" of the electron spectrum (cf. Takahashi et al. 1996). Hard X-ray observations conducted jointly with the TeV γ-ray observations probe electrons with most extreme energies. This is especially important for the most energetic TeV emitters, which reach the highest apparent values of γel, since they become radiatively inefficient in the Klein–Nishina regime. Measuring the most energetic synchrotron emission allows one to distinguish between intrinsic and extrinsic cutoff mechanisms, and sets clear constraints on γel. NuSTAR's large bandwidth provides a unique tool for such investigations.
The extreme variability of blazars provides an opportunity to study the evolution of the radiating particles' energy distribution, from the acceleration stage through their luminous emission. Broadband studies can probe the conversion of jet bulk kinetic energy to ultrarelativistic electrons and subsequently to photons. The relative temporal variability in different spectral bands, from radio through TeV, provides an important handle on the location of the energy dissipation as a function of distance from the central black hole (Sikora et al. 2009).
As the main component of its blazar program, NuSTAR will participate in large multiwavelength campaigns of two luminous blazars showing quasar-like behavior, and two low-luminosity sources in an active state. Extreme activity is unpredictable (see, e.g., Wagner & Witzel 1995; Abdo et al. 2010), so that targets must be chosen by monitoring activity in the Fermi band. In the quasar class, 3C279 (z = 0.524) and 3C454.3 (z = 0.859) are the most promising targets. Both have shown extreme variability in Fermi on a timescale of ∼3 days (Abdo et al. 2010). NuSTAR will observe with a daily cadence of 10 ks pointings with facilities from radio to γ-ray with sampling as simultaneously as possible.
The best candidates for low-luminosity blazars are Mkn 421 and PKS 2155−304. The most extreme variability for these is seen in the TeV band, on timescales of an hour or less (see, e.g., Aharonian et al. 2009; Galante 2011). Assuming these stay active, NuSTAR will observe simultaneously with MAGIC and Veritas (for Mkn 421), and H.E.S.S. (for PKS 2155−304) for several nights each month during the TeV telescopes' observing seasons. The continuous pointings will be strictly simultaneous (modulo Earth occultations). Preliminary data obtained for Mkn 421 during the NuSTAR calibration phase already indicate that such measurements of time-resolved spectra with NuSTAR are feasible, where a ∼15 ks observation demonstrably samples the spectrum to 50 keV.
NuSTAR will also make shorter observations of several blazars with particularly unusual properties. Candidates include 1ES 0229+200, where hard X-ray and TeV γ-ray emission have interesting implications for the intergalactic magnetic field (see Kaufmann et al. 2011; Vovk et al. 2012), and AO 0235+164 (see Ackermann et al. 2012; Agudo et al. 2011). The scheduling of these targets will depend on them entering an active state as determined by Fermi.
10.4. Non-thermal Radiation in Young Supernova Remnants
Young (τ ≲ 1000 yr old) SNRs are priority targets for NuSTAR, which will provide the first sensitive imaging observations of non-thermal emission above 10 keV. X-ray synchrotron emission is known to extend to high energies in several young remnants (see Reynolds 2008; Vink 2012 for reviews) and possibly in others; its characterization addresses questions of particle acceleration and the origin of cosmic rays (e.g., Reynolds 1998; Warren et al. 2005). Remnants younger than 1000 yr may also show evidence of relatively long-lived radioactive nuclides, primarily 44Ti, which is of importance in understanding explosion mechanisms (Arnett et al. 1989; Timmes et al. 1996; Magkotsios et al. 2010).
The primary remnants for these studies are Cas A, SN 1987A, and G1.9+03—objects where 44Ti emission has been detected, and which are also interesting for studying the hard synchrotron continuum. 44Ti (mean life 85 yr) decays by electron capture to 44Sc, leaving an inner-shell vacancy which can be filled by a transition producing a 4.1 keV X-ray. Nuclear de-excitation lines at 68 and 78 keV and 1.157 MeV are also produced. So far, the gamma-ray lines have been seen only from Cas A, by BeppoSAX (Vink et al. 2001) and IBIS/ISGRI on INTEGRAL (Renaud et al. 2006), and recently from SN 1987A by IBIS/ISGRI (Grebenev et al. 2012). The 44Sc X-ray line has been seen only in the youngest Galactic remnant G1.9+0.3 (Borkowski et al. 2010), whose age is about 100 yr (Carlton et al. 2011).
Theoretical predictions for the initial synthesized mass of 44Ti in core-collapse SNe are in the range of (0.1–3) × 10−4 M☉ (Timmes et al. 1996; Thielemann et al. 1990; Woosley & Hoffman 1991; Young et al. 2006). In Cas A, the inferred yield is about 2 × 10⁻⁴ M☉ of 44Ti, at the upper end of the range of expectations. The yield in SN 1987A is also surprisingly high, (3.1 ± 0.8) × 10−4 M☉ (Grebenev et al. 2012). NuSTAR is executing several long observations of Cas A, with over 1.2 Ms of total exposure will make the first spatial maps of the remnant in 44Ti. The asymmetry of the emitting region will provide strong constraints on the asymmetry of the explosion. Similarly in SN 1987A, assuming the INTEGRAL detection is robust, NuSTAR's 1.2 Ms integration will significantly improve the yield measurement and will constrain the line width as well as search for hard X-ray emission from any compact object.
The very high expansion velocities detected spectroscopically from G1.9+0.3 (>12,000 km s−1), a century after the explosion, argue fairly strongly for a Type Ia origin, supporting arguments derived from the remnant morphology and the absence of a pulsar wind nebula (PWN; Reynolds 2008). However, the SN-type question is still open. The 44Sc 4.1 keV line intensity detected from G1.9+0.3 (Borkowski et al. 2010) implies about 10−5 M☉ of 44Ti (for an assumed age of 100 yr). The predicted fluxes in the 68 and 78 keV lines are about 4 × 10⁻⁶ ph cm−2 s−1 each. A detection of 44Ti from a firmly classified Type Ia remnant will be a very important constraint on explosion models. If G1.9+0.3 turns out to be a core-collapse remnant, having another example alongside Cas A and SN 1987A will be important in isolating the important variables determining 44Ti production.
All Galactic SNRs less than 2000 yr old, and some older examples, show evidence of synchrotron X-ray emission (Reynolds 2008; Allen et al. 2001). In all observed cases, the intensity is below the extrapolation of the radio synchrotron spectrum (Reynolds & Keohane 1999), indicating that some processes (radiative losses, finite remnant age or size, or particle escape) are beginning to cut off the electron acceleration process at high energies. Considerably more information on particle acceleration is encoded in the detailed shape of the spectral steepening than in the power-law portion of the spectrum at lower energies. Most inferences to date are based on observations below about 8 keV, where power laws are indistinguishable from more detailed models. Both Cas A and G1.9+0.3 have strong X-ray synchrotron components; in the case of Cas A, spatially integrated observations to 80 keV have been performed (Favata et al. 1997; Allen et al. 2001; Maeda et al. 2009). NuSTAR will provide spatially resolved maps. The integrated spectrum of G1.9+0.3 is dominated by non-thermal emission below about 7 keV (Reynolds 2008), but no observations have been done at higher energies. Since G1.9+0.3 is the only Galactic SNR currently growing brighter (Carlton et al. 2011), the behavior of its spectrum at higher energies is of great interest. For SN 1987A, X-ray emission below 10 keV is composed of two thermal components (e.g., Sturm et al. 2010), but our long observation to search for 68 keV line emission should be able to detect or constrain any non-thermal continuum at higher energies.
10.5. Dynamics in Core Collapse and Ia Explosions: Target of Opportunity Observations of Supernovae
NuSTAR will provide new insights into SN explosions in our local universe by studying the hard X-ray emission from SN Ia explosions out to the Virgo cluster (∼14 Mpc) and core-collapse SNe in the Local Group (∼4 Mpc). This emission arises from the Compton downscatter of 56Ni decay gamma rays, and both the light curve and spectrum emerging from the SNe at hard X-rays is sensitive to the mass and abundance distributions in the explosion. Detailed simulations of SNe Ia have shown that this hard X-ray emission is a strong diagnostic of the surface composition and flame propagation, and larger 56Ni mass produces higher hard X-ray flux levels that peak at earlier times (Maeda et al. 2012). Typical peaking times are expected to be between 10 and 30 days for SNe Ia and between 150 and 250 days for core-collapse SNe. Our primary criteria for triggering an SN ToO is to have a spectroscopically confirmed SN identified before peak within the NuSTAR sensitivity distances.
10.6. Additional Priority Science Observations
NuSTAR will pursue a range of science objectives significantly broader than the key projects described above. The sections below detail additional science objectives and describe which targets will be observed during the baseline mission. Fully exploiting the range of opportunities will require a GI program, to be proposed to NASA as an extension to the baseline mission. Approximately 70% of the total observing time in the baseline mission is allocated to the Priority A targets plus the key (Level 1) programs; the remaining time (30%) is kept in reserve for followup of unanticipated discoveries, as well as additional ToO observations.
10.6.1. Ultraluminous X-Ray Sources
Ultraluminous X-ray source (ULX) luminosities (0.5–10 keV) exceed ∼3 × 1039 erg s−1 (extending up to 1042 erg s−1; Farrell et al. 2009), significantly above the isotropic Eddington luminosity for stellar mass accretors. Hypotheses are that ULXs contain stellar mass black holes in an extreme version of the very high state of Galactic black holes—the "ultraluminous" or wind-dominated state (Gladstone et al. 2009). In this state, sources can radiate above the Eddington limit and exhibit a soft spectrum cutting off just below 10 keV. Alternatively, the emission may display some anisotropy due to geometrically thick disks that act as a funnel for X-ray photons produced in the inner disk region (King 2009). Most intriguing is the idea that ULXs—in particular, the very luminous ones—harbor intermediate-mass black holes (102–105 M☉; IMBHs) accreting at sub-Eddington rates. The existence of IMBHs is vitally important to establish, because they may provide seeds that form supermassive black holes via mergers or accretion episodes (e.g., Micic et al. 2007).
NuSTAR is observing a sample of bright ULXs simultaneous with XMM-Newton as part of approved AO-11 and -12 programs. Working together, XMM-Newton and NuSTAR can provide powerful observations aimed at elucidating the nature of ULXs. XMM-Newton covers the spectral region where the accretion disk shines (peaking at ∼1 keV), and NuSTAR will explore whether Comptonization of soft photons on hot electrons occurs, and will enable searches for signatures of relativistic beaming. In Galactic binaries, contemporaneous broadband spectroscopy and relative hard/soft band variability has been a powerful tool for understanding accretion physics and the nature of the compact object. It will likewise be the case for ULXs. In addition, NuSTAR is observing NGC 1365 and M82 as part of the obscured AGN and starburst galaxy programs.
10.6.2. Accretion Physics in Active Galactic Nuclei
NuSTAR will make numerous contributions to understanding the physical mechanisms at work in radio-quiet AGNs by addressing three long-standing and hotly debated issues.
Is relativistic reflection the right model? In radio-quiet AGNs, the primary X-ray emission is reflected off the accretion disk. This reprocessing results in a "Compton hump"—a continuum excess peaking in the NuSTAR band at around 30 keV (George & Fabian 1991; Matt et al. 1991), as well as several fluorescent lines, the most prominent being the iron Kα (Reynolds et al. 1995). Matter velocities are high, and general and special relativistic effects are very strong in the vicinity of the black hole, modifying emission line profiles (Fabian et al. 1989; see Fabian et al. 2000; Miller 2007 for reviews). This results in two asymmetric peaks (the bluest being the brightest) and an extended red wing.
ASCA's discovery of a prominent red tail in the iron line profile of the Seyfert 1 galaxy MCG-6-30-15 (Tanaka et al. 1995)—later confirmed in this and other objects (e.g., Nandra et al. 2007; de la Calle Perez et al. 2010; Brenneman et al. 2011)—seems to validate this model. However, this red wing may not be intrinsic, but due to the presence of ionized absorbers partially covering the primary X-ray source (Turner & Miller 2009). Clear-cut observational proof is still missing. NuSTAR is providing definitive observations validating the reflection model (Risaliti et al. 2013). While the two models are largely degenerate below 10 keV, they make very different predictions in hard X-rays.
The spin of the black hole. Assuming that the relativistic reflection model is the correct one, NuSTAR, in coordination with XMM-Newton and Suzaku, can determine the spin of the black hole, a key parameter in understanding the evolution of AGNs and the history of black hole growth (Berti & Volonteri 2008; Volonteri et al. 2012). The black hole spin can be estimated as a consequence of its effect on the innermost disk radius (e.g., Laor 1991), which can be measured by fitting the iron line profile, and in particular the low-energy extension of the red wing. While XMM-Newton and Suzaku observations alone already provide precise measurements from the statistical point of view (e.g., Brenneman et al. 2011), systematic uncertainties are still problematic. NuSTAR has already begun a program of observations with XMM-Newton and Suzaku that will provide much tighter constraints on the emission continuum, allowing significantly more precise spin measurements.
The temperature of the hot corona. There is consensus that the primary X-ray emission is due to Comptonization of UV/soft X-ray accretion disk photons in a hot corona, the properties of the corona, and the values of its two main parameters, the temperature and the optical depth, are largely unknown. This ignorance hampers our understanding of fundamental properties such as the relation between the corona, accretion disk, and the energy budget of AGNs. Previous studies (e.g., Perola et al. 2002) indicate coronal temperatures in the 50–200 keV range, as derived from the measurement of high-energy cutoffs observed in the power-law continua of several AGNs. However, the quality of the measurements obtained with non-focusing hard X-ray telescopes (BeppoSAX, INTEGRAL, and Suzaku) is too poor to ensure that the spectral complexity was dealt with properly and the cutoff energy correctly estimated.
NuSTAR observations will allow us to reliably determine the properties of the hot emitting corona for the first time. Simulations indicate that the coronal temperatures can be estimated with errors of only 10% for the brightest AGNs if the temperatures are not higher than 100 keV, and with errors of 20%–30% for temperatures as large as 200 keV.
10.6.3. Galaxy Clusters and Radio Relics
Due to the limitations in sensitivity and angular resolution of previous hard X-ray missions, there are few constraining observations of galaxy clusters above 10 keV. Many merging clusters contain hot gas with temperatures that can only be poorly constrained by data below 10 keV. NuSTAR's unprecedented sensitivity in the 10–20 keV energy band will allow us to provide significant constraints on the hot thermal emission expected, and sometimes observed, in merging systems. The first NuSTAR observation of a galaxy cluster has recently been conducted on the Bullet Cluster; this well-known system hosts hot thermal emission (Markevitch & Vikhlinin 2007).
In addition, NuSTAR can map non-thermal emission associated with populations of relativistic electrons in clusters from which radio synchrotron emission has been detected. These detections have a rather controversial history (Wik et al. 2012), with measurements of "hard tails" having been made by some authors and challenged by others. If the claims are true, the high sensitivity and low background of the NuSTAR mission will afford robust, high-significance detections. If, conversely, the claims are false, NuSTAR observations will provide tighter upper limits and, possibly, some detections.
10.6.4. Nearby Star-forming Galaxies
The NuSTAR starburst program has two principal components: (1) an intensive program on NGC 253 (d = 2.6 Mpc) for 500 ks in three 165 ks observations with coordinated Chandra, Very Long Baseline Array (VLBA), and (automatic) 1–2 ks Swift-XRT visits (completed 2012 November) and (2) a survey of five additional nearby (4–40 Mpc) galaxies with 30–180 ks exposures to build up a statistical sample. Unless all X-ray binaries in these galaxies are unexpectedly very soft, we expect to detect all of the galaxies out to energies of ∼20 keV.
Given the relatively high specific star-formation rate of NGC 253, its X-ray binary population is expected to be primarily HMXBs, in contrast to the low-mass X-ray binaries that are the dominant population in the Milky Way. Our monitoring consisted of three observational periods, which included 20 ks with Chandra and 28 ks with the VLBA. The monitoring was designed to (1) sensitively isolate the locations of X-ray binaries, (2) determine the nature of the accreting compact objects via their 0.5–30 keV spectral properties, and (3) identify interesting flaring X-ray/radio sources as they make spectral state transitions due to variability in their accretion.
As part of the baseline program, NuSTAR will survey five additional normal/starburst galaxies: M82, M83, NGC 3256, NGC 3310, and Arp 299. The NuSTAR observation of M82 is likely to be dominated by the "famous" ULX M82 X-1 (Kaaret et al. 2006). The exposure times for these five galaxies range from 30 to 180 ks, driven by the goal of producing a 5σ 10–20 keV detection under conservative assumptions (moderately soft spectral shape). It is expected that these observations will result in strong detections of at least the brightest several sources in each galaxy. The main goals of the survey program are (1) to characterize the typical starburst spectrum above 10 keV, (2) to identify the nature of individually detected X-ray sources (neutron star versus black hole candidate), and (3) to look for short-term (hours to weeks) variability and establish a baseline for long-term variability studies (weeks to years)
10.6.5. Magnetars and Rotation-powered Pulsars
NuSTAR will observe a sample of rotation-powered pulsars (RPPs) and magnetars, weighted toward the magnetars given the surprising high-energy turnover in their X-ray spectra discovered by INTEGRAL and RXTE (Kuiper et al. 2006). This emission is both unpredicted and not understood, though some models have been suggested (e.g., Heyl & Hernquist 2005; Baring & Harding 2007; Beloborodov & Thompson 2007; Beloborodov 2013) and some intriguing correlations noted (Kaspi & Boydstun 2010; Enoto et al. 2011). Specifically, among the Priority A magnetar targets is 1E 2259+586, only marginally detected in the hard X-ray band by RXTE and INTEGRAL. NuSTAR will provide the first high-quality broadband X-ray spectrum for this target, which has the most extreme spectral turnover yet seen in any magnetar. In addition, will observe 1E 1048−5937, the lone "classical," regularly monitored magnetar for which no hard X-ray emission has yet been detectable. NuSTAR will also observe 1E 1841−045, the magnetar located at the center of the SNR Kes 73 which is among the first magnetars detected as a hard X-ray emitter (Kuiper et al. 2006). With a relatively short exposure, NuSTAR can measure an exquisitely precise spectrum, clearly defining the turnover region as well as the pulsed fraction as a function of energy. Finally, NuSTAR plans a ToO observation of a magnetar in outburst and its subsequent relaxation, with the goal of monitoring simultaneously the behavior of the soft and hard X-ray components to see whether they vary in concert.
For RPPs, NuSTAR will observe the Geminga pulsar, among the very brightest gamma-ray sources known, which shows relatively faint, mainly thermal X-ray emission (e.g., Kargaltsev et al. 2005) and is an archetype for X-ray faint/gamma-ray bright RPPs. In addition, NuSTAR will observe the millisecond pulsar PSR J1023+0038. This pulsar is a unique transition object between the millisecond pulsar and low-mass X-ray binary evolutionary phases. X-ray emission observed with XMM and Chandra (Archibald et al. 2010; Bogdanov et al. 2011) shows a hard power-law tail, suggesting detectability well above 10 keV with NuSTAR.
10.6.6. Pulsar Wind Nebulae
PWNe exhibit radiation from extremely energetic particles produced by pulsars and processed through a relativistic wind termination shock. The nature of magnetospheric acceleration, the behavior of the cold relativistic wind interior to the termination shock, and the particle-acceleration properties of the relativistic shock are all important open issues. Even the composition of the wind is unknown, although it represents a major part of the pulsar's energy loss.
As part of the in-flight calibration program, NuSTAR will observe the most famous PWN, the Crab Nebula, as well as G21.5−0.9. For the Crab Nebula, the integrated spectrum is well known through the NuSTAR bandpass (though there may remain some disagreements among instruments; Kuiper et al. 2001; Jourdain & Roques 2009). However, no high-quality images of the nebula have been made above 10 keV. A slow decrease in the effective size of the nebula with X-ray energy is predicted by the model of Kennel & Coroniti (1984). NuSTAR will test this prediction with much greater sophistication than possible with scanning collimator and occultation measurements. High-resolution Chandra and XMM-Newton observations of the Crab Nebula and other young PWNe typically show a "jet-torus" structure on arcminute or smaller scales (see Gaensler & Slane 2006 for a review). Below 10 keV, the Crab Nebula torus has a harder spectrum than the rest of the nebula (Mori et al. 2004), so changes in morphology as a function of X-ray energy above 10 keV are expected. Similarly, in G21.5−0.9 NuSTAR can determine the integrated spectrum to high accuracy, measure the evolution of the PWN size as a function of energy, and search for X-ray pulsations from the central neutron star. A third PWN, SNR MSH 15–52, will also be observed as part of the baseline science program.
10.6.7. Obscured AGNs
The existence of Compton-thick AGNs (CTAGNs), with their telltale 10–13 keV reflection hump, has been invoked regularly as a major component to explain the steep shape and 30 keV peak of the cosmic XRB (e.g., Comastri et al. 1995; Gilli et al. 2007). Despite their importance, however, prior to the launch of NuSTAR, only a handful of CTAGNs were directly detected above 10 keV, most of which are only weakly Compton thick. While this was sufficient to confirm their existence, physical constraints generally are remarkably poor, and the complex range of expected spectral features (Murphy & Yaqoob 2009) remains largely untested. Furthermore, only half the such known sources belong to flux-limited surveys, all at z ⩽ 0.015, and thus have very modest intrinsic luminosities.
NuSTAR plans a comprehensive program studying CTAGNs. One aspect of this program is deep observations of famous, bright sources such as NGC 1068 and NGC 1365, which span a range of obscurations. These data will provide detailed high-energy spectra, including measurements of the reflection humps, covering fractions, and variability. Shallower observations of fainter sources will investigate the range of obscured AGN properties. The latter category includes well-known ultraluminous infrared galaxies (Risaliti et al. 2000; Teng et al. 2005), a few optically bright, broad absorption line quasars (BALQSOs) with surprisingly faint soft X-ray fluxes (Gallagher et al. 1999; Saez et al. 2012), optically selected type 2 quasars identified from the Sloan Digital Sky Survey (Zakamska et al. 2004), and heavily obscured AGN candidates recently identified by the Wide-field Infrared Survey Explorer (Eisenhardt et al. 2012).
10.6.8. Galactic Binaries
Hard X-ray observations of accreting black holes provide a probe of the inner regions of the accretion disk where strong gravity prevails (Remillard & McClintock 2006; Psaltis 2008). NS are exotic objects where densities, magnetic fields, and gravitational fields are all extreme (Lattimer & Prakash 2004, 2007; Truemper et al. 1978; Coburn et al. 2002). Studies of X-ray binaries are important for understanding accretion disks and determining how relativistic jets, which are seen from X-ray binaries as well as from SMBHs (Fender 2006), are produced. Constraining the properties of the compact objects themselves has implications for gravitational and nuclear physics.
For faint X-ray binaries, NuSTAR will provide the first hard X-ray studies of black hole and neutron star X-ray transients at their lowest mass accretion rates, providing a new window on accretion processes and emission mechanisms in quiescence. NuSTAR will investigate the origin of the hard X-ray emission from the neutron star transient Centaurus X-4 (Rutledge et al. 2001; Cackett et al. 2010) and from the black hole transient V404 Cyg (Narayan et al. 1997; Bradley et al. 2007; Corbel et al. 2008).
NuSTAR's spectroscopic capabilities will be used for studies of bright X-ray binaries. Cyclotron resonance scattering features appear as "cyclotron lines" at energies of 10–100 keV, providing the only direct measurement of an accreting neutron star's magnetic field strength. The most advanced theoretical model for these lines (Schönherr et al. 2007) will be applied to NuSTAR spectra of HMXBs such as Hercules X-1, Vela X-1, and accreting pulsar transients; we will also search for cyclotron lines from members of newly discovered classes of HMXBs (Walter et al. 2006; Negueruela et al. 2006). In addition, NuSTAR will target accreting black hole systems, such as Cygnus X-1, and transient black hole systems in order to study the Compton reflection component (Magdziarz & Zdziarski 1995). Both the strength of this component and the level of relativistic distortion in the emission lines and absorption edges provide constraints on the geometry of the inner accretion disk and on the black hole spin (Miller 2007). Another NuSTAR project will be to study NS that exhibit X-ray bursts that occur when accreted material undergoes a thermonuclear runaway (Lewin et al. 1993). NuSTAR will observe 4U 1820–30 when it is actively producing X-ray bursts to search for absorption edges that have been tentatively detected with lower resolution hard X-ray detectors ((in't Zand & Weinberg 2010). Such edges have the potential to provide detailed information about the nuclear burning sequence, burst ignition, and the conditions near the NS surface.
NuSTAR observations are planned with timing as the primary goal. SAX J1808.4−3658 is a transient accreting millisecond pulsar that exhibits 400 Hz pulsations during outbursts (Wijnands & van der Klis 1998). However, as the mass accretion rate drops, it is predicted that the "propeller effect" (Illarionov & Sunyaev 1975) will eventually cause the accretion onto the magnetic poles to cease due to the centrifugal barrier, and NuSTAR will test this by observing SAX J1808.4−3658 at the end of an outburst. Timing will also be important for carrying out phase-resolved spectroscopy of the cyclotron line studies. Finally, NuSTAR plans to target the gamma-ray binary LS 5039 to search for pulsations and to measure how the hard X-ray spectrum changes with orbital phase.
10.6.9. Solar Physics
The NuSTAR spacecraft and instrument are capable of pointing at the Sun, an unusual ability in a space telescope designed for astrophysical observations. NuSTAR will be able to detect hard X-rays from solar activity at levels 200 times fainter than permitted by the background-limited sensitivity of RHESSI, another NASA Small Explorer and the state of the art for a solar hard X-ray mission. The solar program during the primary mission is planned as three weeks of pointings, both to active regions and quiet parts of the solar disk and limb, with two principal science goals: the search for hard X-rays from very small events (nanoflares) and the study of faint hard X-ray sources high in the solar corona associated with both large and small flares. These observations will take place near the end of the NuSTAR primary mission.
11. SUMMARY
The NuSTAR observatory, launched in 2012 June, is operating nominally on-orbit, with performance fully consistent with pre-launch predictions. Completion of the initial calibration indicates that the cross-normalization and relative response agree well with other soft X-ray telescopes below 10 keV. The science program for the 2 yr baseline science mission includes both key projects and a diverse set of investigations designed to provide a broad scientific scope. The mission life is limited by the orbit altitude and single-string design; however, with the >600 km near-circular orbit the NuSTAR could continue operations for up to 10 yr. After completion of the baseline program, the NuSTAR team will propose an extended mission that emphasizes a GI program, along with continued extragalactic and Galactic surveys. This will provide opportunities to expand the multifaceted program through dedicated NuSTAR pointings, to follow up on discoveries, and for further joint programs with XMM and Chandra, as well as a broader ToO program.
This work was supported under NASA No. NNG08FD60C and made use of data from the Nuclear Spectroscopic Telescope Array (NuSTAR) mission, a project led by Caltech, managed by the Jet Propulsion Laboratory, and funded by the National Aeronautics and Space Administration. Additional support for development was provided by the National Space Institute, Technical University of Denmark. The Malindi ground station is provided by the Italian Space Agency (ASI) and support for science software development by the ASI Science Data Center (ASDC). Science team members acknowledge support from Centre National d'Etudes Spatiales (CNES) (D.B., M.B.), the NASA Postdoctoral Program (D.R.W.), Leverhulme Research Fellowship and Science and Technology Facilities Council (D.M.A), NSF AST (D.R.B.), U.S. DOE/LLNL (W.W.C., M.P., J.V.), NSERC, CIFAR, FQRNT, and Killam Research Fellowship (V.K.). We thank David Burrows (PSU) for useful comments which improved the quality of the manuscript.