


ABSTRACT
We have investigated a coronal jet observed near the limb on 2010 June 27 by the Hinode/X-Ray Telescope (XRT), EUV Imaging Spectrograph (EIS), and Solar Optical Telescope (SOT), and by the Solar Dynamics Observatory (SDO)/Atmospheric Imaging Assembly (AIA), and on the disk by STEREO-A/EUVI. From EUV (AIA and EIS) and soft X-ray (XRT) images we have identified both cool and hot jets. There was a small loop eruption seen in Ca ii images of the SOT before the jet eruption. We found that the hot jet preceded its associated cool jet by about 2 minutes. The cool jet showed helical-like structures during the rising period which was supported by the spectroscopic analysis of the jet's emission. The STEREO observation, which enabled us to observe the jet projected against the disk, showed dimming at 195 Å along a large loop connected to the jet. We measured a propagation speed of ∼800 km s−1 for the dimming front. This is comparable to the Alfvén speed in the loop computed from a magnetic field extrapolation of the photospheric field measured five days earlier by the SDO/Helioseismic and Magnetic Imager, and the loop densities obtained from EIS Fe xiv λ264.79/274.20 line ratios. We interpret the dimming as indicating the presence of Alfvénic waves initiated by reconnection in the upper chromosphere.
Export citation and abstract BibTeX RIS
1. INTRODUCTION
Solar coronal jets are columnar eruptions that are magnetically rooted in the photosphere and shoot up into the corona. According to the nominal temperature of the ejected plasma, they are classified into X-ray jets (∼4 × 10⁶ K), EUV jets (∼105 K), and Hα surges (∼104 K). Several observations (Shibata et al. 1992; Canfield et al. 1996; Chae et al. 1999; Jibben & Canfield 2004; Jiang et al. 2007) have shown that cool surges and hot jets are closely related in space and time, but their physical relationship has not been well established. Therefore, multi-wavelength observational studies of coronal jets with high time cadence and spatial resolution are needed to investigate their interrelationships. Recently, several multi-wavelength observational studies of jets using Hinode and Solar Dynamics Observatory (SDO) high spatial and temporal resolution images have been reported (Culhane et al. 2007a; Liu et al. 2011; Madjarska 2011; Shen et al. 2011).
To explain the observational properties of both X-ray jets and Hα surges, two-dimensional magnetohydrodynamic (MHD) simulations of reconnection between emerging flux and a uniform coronal field have been performed by Yokoyama & Shibata (1995, 1996). Nishizuka et al. (2008) also studied the connection between cool and hot jets observed with Hinode by quantitatively comparing their observations with simulations. According to their comparison, reconnection in the upper chromosphere led to the acceleration of both cool and hot jets.
The range of apparent velocities and the average velocity of X-ray jets from the statistical study using Yohkoh observations are 10–1000 km s−1 and 200 km s−1, respectively (Shimojo et al. 1996). Cirtain et al. (2007) observed many jets in the open field polar coronal hole region that show two velocity components: one close to the Alfvén speed (800 km s−1) and one close to the sound speed (200 km s−1). They interpreted the high-velocity jets as evidence for material being ejected with the Alfvén speed during the relaxation of the magnetic field after reconnection or as an Alfvén wave generated during a burst of reconnection. In the closed field region, Shimojo et al. (2007) observed a fast (∼680 km s−1) X-ray jet that propagated along a large-scale loop, heating the loop to X-ray temperatures and reflecting from the footpoint at the far end of the loop. Recently, Pariat et al. (2009) proposed a three-dimensional (3D) MHD model for these high-speed jets in which the jets are driven by Alfvén waves.
Coronal dimmings associated with much smaller jets are reported by several researchers (Innes et al. 2010; Hong et al. 2011). Innes et al. (2010) observed coronal dimmings before jet-like chromospheric eruptions in coronal holes. They interpreted the dimmings as the opening up of the coronal magnetic fields at the start of the eruptions. Hong et al. (2011) also observed a coronal dimming in a blow-out EUV jet (Moore et al. 2010).
STEREO observations allow us to investigate the 3D structure of solar jets (Patsourakos et al. 2008; Kamio et al. 2010). Patsourakos et al. (2008) and Kamio et al. (2010) demonstrated the existence of helical motions thanks to multi-viewpoint observations. Their results are also consistent with the 3D models of polar jets proposed by Moreno-Insertis et al. (2008) and Pariat et al. (2009). Helical motions in macrospicules or surges associated with X-ray or EUV jets have also been reported (Canfield et al. 1996; Jibben & Canfield 2004; Jiang et al. 2007).
In this study, we investigate a coronal jet observed by the X-Ray Telescope (XRT), the EUV Imaging Spectrograph (EIS), and the Solar Optical Telescope (SOT) on Hinode, the Atmospheric Imaging Assembly (AIA) on SDO, and the Extreme Ultraviolet Imager (EUVI) on STEREO. Using these observations, we inspect the jet structure and temporal evolution at multiple wavelengths and determine its spectroscopic properties. Noticeably, we observe the active region environment of the jet by taking advantage of the stereoscopic view. Observations from the Helioseismic and Magnetic Imager (HMI) on SDO of the region's magnetic field when it was on the disk are used to obtain the magnetic topology.
The paper is organized as follows. We describe the Hinode, SDO, and STEREO observations of the jet in Section 2. In Section 3, we present the structure and evolution of the jet. The discussion and a brief summary are given in Section 4.
2. OBSERVATIONS
For this study, we investigate a coronal jet seen on the northwest limb of the Sun, observed on 2010 June 27. The jet was observed by Hinode (XRT, EIS, and SOT), SDO (AIA), and STEREO (EUVI) simultaneously. XRT (Golub et al. 2007), EIS (Culhane et al. 2007b), and SOT (Tsuneta et al. 2008) on board Hinode provide us with high spatial resolution (0 2–2'') images from optical to X-ray wavelengths and EUV spectroscopic information.
AIA (Lemen et al. 2012) on SDO provides excellent temporal (∼12 s) and spatial resolution (∼12) images in 10 wavelength channels centered on lines formed over a wide range in temperature. We use the AIA "aia_lev1" images with 12 s time cadence and 12 spatial resolution. To investigate the evolution of the jet at multiple wavelengths, we select 304 Å and 193 Å images, which respond to chromospheric and coronal temperatures, respectively (Table 1).
Table 1. List of Multi-wavelength Observations in the Present Study
| Instrument | Wavelength (Filter) | Region of Atmosphere | log Tmax |
|---|---|---|---|
| (K) | |||
| XRT | Al_mesh | Flaring regions | 6.7 |
| SOT | Ca ii H | Chromosphere | 4.0 |
| EIS | Fe xv 284.16 | Active region corona | 6.3 |
| Fe xiv 264.79 | Active region corona | 6.3 | |
| Fe xiv 274.20 | Active region corona | 6.3 | |
| Fe xiii 256.42 | Corona | 6.2 | |
| Fe xii 256.41 | Corona | 6.1 | |
| Fe xii 195.12 | Corona | 6.1 | |
| Si x 256.37 | Corona | 6.1 | |
| Fe x 256.40 | Corona | 6.0 | |
| Al ix 284.03 | Corona | 6.0 | |
| Si vii 275.35 | Transition region | 5.8 | |
| Si vii 274.18 | Transition region | 5.8 | |
| He ii 256.32 | Chromosphere | 4.7 | |
| SDO | Fe xiv 211 Å | Active region corona | 6.3 |
| Fe xii 193 Å | Corona | 6.1 | |
| He ii 304 Å | Chromosphere | 4.7 | |
| STEREO | Fe xii 195 Å | Corona | 6.1 |
Download table as: ASCIITypeset image
We also use Ca ii H images from SOT to show the characteristics near the base of the jet at temperatures cooler than the plasma responsible for the 304 Å emission (Table 1). The spatial and time resolution of the SOT is about 02 and 32 s, respectively. The field of view (FOV) of SOT was south of the main jet but captured a small loop expansion and some small ejections associated with the jet when the jet occurred.
To investigate the X-ray jet structures, we use XRT images taken through the Al_mesh filter which is sensitive to hotter plasma (∼2 MK) and has less background coronal emission than the EUV filters (Figure 1). There are two peaks in Al_mesh filter response at 8 × 10⁵ K and 8 × 10⁶ K. The sensitivity at 8 × 10⁵ K is five times lower than the high-temperature peak. Without additional filter images the temperature of the observed plasma is nevertheless ambiguous, so we checked the base-difference and running-difference movies of the AIA 171 Å emission (Figure 2; movies 1 and 2). Since the movies do not show a corresponding jet structure at the time of the X-ray jet, we think that the jet structure seen through the Al_mesh filter is caused by high-temperature plasma emission. The time cadence of the XRT is about 80 s and its pixel resolution is about 1''. To remove the spacecraft jitter, we applied the solarsoft routine "xrt_jitter.pro."

Figure 1. Time sequence of Hinode/XRT Al_mesh filter images showing an X-ray jet. The black solid line and the dashed box in panel (c) denote the position of the EIS slit and the field of view of the Hinode/SOT shown in Figure 4, respectively. The dashed line in panel (d) corresponds to the main axis of the jet. The white arrow in panel (b) and black arrows in panel (e) point at the strands of the X-ray jet.(An animation of this figure are available in the online journal.)
Download figure:
Standard image High-resolution image
Figure 2. SDO/AIA 171 Å images of the active region related to the jet: (a) base difference and (b) running difference images. The solid lines in panels (a) and (b) indicate the location of the solar limb.(Animations (a and b) of this figure are available in the online journal.)
Download figure:
Standard image High-resolution imageThe EIS slit was located outside the northwest limb and observations were made in the sit and stare mode over a period of 1 hr from 01:59 UT. An exposure time of 90 s and the 2'' slit were used. The observed spectral lines are reported in Table 1. To derive the Doppler velocity distribution from EIS observations, we determined the central positions of the spectral line at every spatial pixel using observations before the jet eruption, and then set a rest wavelength. We apply "eis_wave_corr.pro" to correct two major instrumental effects on the spectra: the tilt of the slit on the CCD and the sinusoidal drift of the lines on the detector due to orbital changes (Mariska et al. 2007; Brown et al. 2007).
The EUVI/SECCHI telescope on STEREO-A (Howard et al. 2008) provides 195 Å images of the jet from a different perspective. At the time of the observations, the separation angle between the STEREO-A and Earth is about 75°. Therefore, STEREO-A images allow us to investigate the active region structure from above, against the face of the Sun. The STEREO observations have a spatial resolution of 32 and a temporal resolution of 2.5 minutes. The images have been de-rotated to a reference time of 03:00:30 UT.
We used the SDO/HMI longitudinal magnetograms to obtain information on the active region magnetic field configuration at the site of the jet. The spatial resolution of the HMI is about 1''. Near the limb, it is difficult to measure the magnetic field structure due to projection. We use the magnetograms taken when the region was near the disk center, five days before the jet occurred to obtain the active region magnetic structure at the jet site.
The co-alignment of EIS, SOT, and XRT was done by aligning the XRT to AIA 193 Å and the SOT and EIS to the AIA 304 Å images. Figure 1(c) shows the XRT image with the location of the EIS slit (a black solid line) and the FOV of the SOT (a dashed box).
3. RESULTS AND DISCUSSION
In the XRT images, the coronal jet shows typical jet features: collimated ejection with an inverted "Y" shape at the base and a small coronal bright point (BP; Figure 1). Its associated cool jet can be seen in the AIA 304 Å images (Figure 3(b)). The simultaneous spectroscopic and stereoscopic observations of the jet's evolution seen in XRT, EIS, SOT, AIA, and EUVI images are described in detail in the following subsections.

Figure 3. Time sequences of SDO/AIA (a) 193 Å and (b) 304 Å images. The black solid line indicates the position of the EIS slit and the dashed line corresponds to the main axis of the jet, which is the same as that in Figure 1. The black and white arrows point at the strands of the jet. The red boxes indicate the regions of quiet region (QR), jet, active region (AR) over the limb for the density measurements in Figure 11.(Animations (a and b) of this figure are available in the online journal.)
Download figure:
Standard image High-resolution image3.1. Temporal Evolution of the Jet
Figures 1, 3, and 4 (movies 3–6) respectively show the morphological evolution as seen in XRT, AIA (193 Å and 304 Å), and SOT images. First, a small loop eruption started around 02:14 UT. This eruption was observed as emission at He ii 304 Å and in absorption in the other AIA channels. Second, 3.5 minutes later (02:17:30 UT), a weak and narrow jet appeared in the XRT images (white arrow in Figure 1(b)). At this time, the eruption in the AIA images was growing and an associated loop at the base of the jet appeared in the Ca ii H image from SOT (the image at 02:17 UT in Figures 2 and 4(a)). Third, the X-ray jet and BP, which may be a miniature flare arcade, clearly appeared at 02:22:58 UT. Fourth, 2.5 minutes later, a cool plasma jet associated the X-ray jet appeared in the AIA 304 Å images. The X-ray jet opened up and formed two crossed strands, probably indicating helical structure in the jet. Fifth, the X-ray jet disappears at 02:31 UT but the BP persisted. Around this time, the jet features seen in the AIA hotter filter images changed from emission to absorption. In the 304 Å images, the jet grew in length and, mimicking the earlier X-ray jet morphology, formed crossed strands indicating helical structure. The length of the He ii jet grew until 02:38 UT. Then it started to fall back (Figure 3(b)). All jet structures had disappeared by 02:58 UT. The X-ray BP also disappeared at 03:17 UT. However, we do not know the exact time of the disappearance of the BP because there are no XRT images during the period from 02:43 UT to 03:17 UT.

Figure 4. Time sequence of Hinode/SOT Ca ii images. The vertical solid line indicates the position of the EIS slit.(An animation of this figure are available in the online journal.)
Download figure:
Standard image High-resolution imageAt the start of the jet, a cool Ca ii loop is seen to emerge. The size and ascending velocity of the loop are ∼35'' and ∼45 km s−1, respectively. The size of the loop is similar to the typical size of a supergranule. The morphology of the erupting loop changed abruptly after 02:22:03 UT (see Figures 4(c) and (d)) when the loop broke and material was ejected. Similar Ca ii loop eruptions with X-ray jets have been reported by He et al. (2010) and Madjarska (2011). He et al. (2010) estimated the upward speed of a supergranular-size erupting loop at the early stage of a jet to be 20 km s−1. Madjarska (2011) also reported erupting cool loop structures with X-ray jets, and suggested that they correspond to either a pre-existing or newly reconnected loop. It is hard to judge whether the erupting loop seen in our observation comes from emergence of a pre-existing loop or a newly formed loop. However, we think it is more likely to be an emergence, because the velocity of our loop is faster than that of typical post flare loops (less than 10 km s−1; Romano et al. 2009; Cheng et al. 2010).
Overlying the Ca ii loop eruption are hot and cool jets seen in the XRT and AIA images. The hot X-ray jet precedes its associated cool jet (He ii 304 Å) by about 2 minutes. We have made time–distance diagrams along the jet's main axis (dashed lines in Figures 1 and 2) to estimate its apparent velocity. Figure 5 shows the time–distance diagrams from XRT and AIA images. The jet onset occurred within about two XRT frames (∼3 minutes). We estimate the speed of the jet by measuring the change of the jet length over these two frames. Dashed lines showing the estimated speed are shown in Figure 5. The AIA images resolve the cooler jet onset. Again the jet speed has been obtained by inspection of the spacetime images. We find that the velocity of the hot X-ray jet is about 250–280 km s−1 while the AIA jet has two velocity components: 70–80 km s−1 (304 Å) and 220–340 km s−1 (304 and 193 Å). This result is consistent with Nishizuka et al. (2008). They interpreted the delay of the cool jet as being caused by the different Alfvén velocities in the hot (low-density) and cool (high-density) plasmas, not by a cooling effect. Comparing their simulation with our observation, we conjecture that our jets are caused by reconnection of emerging flux in the transition region or upper chromosphere. The loop emergence seen in the Ca ii H images supports such an interpretation.

Figure 5. Time–distance diagrams obtained from the cuts along the jet's main axis (the dashed lines in Figures 1 and 2): (a) XRT—the black lines span the slowest (∼260 km s−1) and fastest (∼280 km s−1) XRT speed, (b) AIA 193 Å—the green line shows the upward velocity of ∼340 km s−1, and (c) 304 Å—the white lines span the upward velocity of the jets (∼70 km s−1, ∼80 km s−1) and the downward flows (∼ − 90 km s−1, ∼ − 110 km s−1) and the green lines span the upward velocity (∼220 km s−1, ∼340 km s−1).
Download figure:
Standard image High-resolution imageAfter the He ii jet reached its maximum length of about 130'' (∼ 9.3 × 10⁴ km) at 02:38 UT, it falls back over a period of 20 minutes to the solar surface with a speed of 90–110 km s−1 (Figures 3(b) and 5(c)). The He ii emission at the bottom of the jet is enhanced when the plasma falls back. This may indicate a density increase due to falling-back cool plasma because the radiance enhancement is not seen at higher temperatures. Falling-back cool plasma has been reported in other jet observations. Culhane et al. (2007a) showed a post-jet enhancement in the cooler coronal lines using slot observations from EIS. Recently, Shen et al. (2011) also showed falling motions in a polar jet observed by SDO at 304 Å.
The EIS observations also detect jet emission in several lines. The top panel in Figure 6 shows the intensity maps of the EIS He ii 256.32 Å, Si vii 275.35 Å, Fe xii 195.12 Å, and Fe xv 284.16 Å. To investigate the temporal evolution of the jet, we plot the intensity variation of different lines in the region crossed by the jet (Figure 7). For comparison, we also make a plot of the time profile of the intensity in a region of quiet corona 25'' north of the jet. The intensities are obtained from the averaged spectra by spatial binning of 25 pixel along the slit. The regions of the jet and quiet corona that we analyzed are indicated in Figure 6. We note that the intensity of the jet in Fe xv 284.16 Å starts to increase at 02:17:55 UT which is the time that the jet was seen in the XRT images. At the same time, there is no intensity increase in other spectral lines at the position of the jet or on the quiet corona. From the comparison with the Fe xii 195.12 Å, we think that the emission of the Fe xv shows hot plasma even though the Fe xv 284.16 Å is blended with the Al ix (log T = 6.0) at 284.03 Å. The cooler emissions, Si vii 275.35 Å and He ii 256.32 Å, have sharp intensity enhancements at 02:25:33 UT when the cool jet reached the EIS slit. The temporal variations of intensities of the EIS spectra are consistent with the XRT and AIA observations.
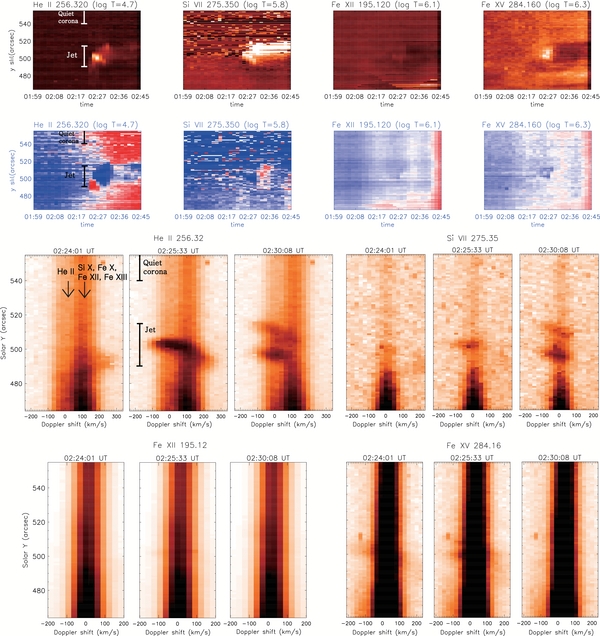
Figure 6. Top: intensity maps of the EIS He ii 256.32 Å, Si vii 275.35 Å, Fe xii 195.12 Å, and Fe xv 284.16 Å lines. Middle: Doppler velocity maps of the same EIS lines in the top panel. Bottom: He ii 256.32 Å, Si vii 275.35 Å, Fe xii 195.12 Å, and Fe xv 284.16 Å spectra along the EIS slit when the He ii jet occurred. The regions of the jet and quiet corona where the intensity profile is measured in Figure 7 are marked by the solid lines.
Download figure:
Standard image High-resolution image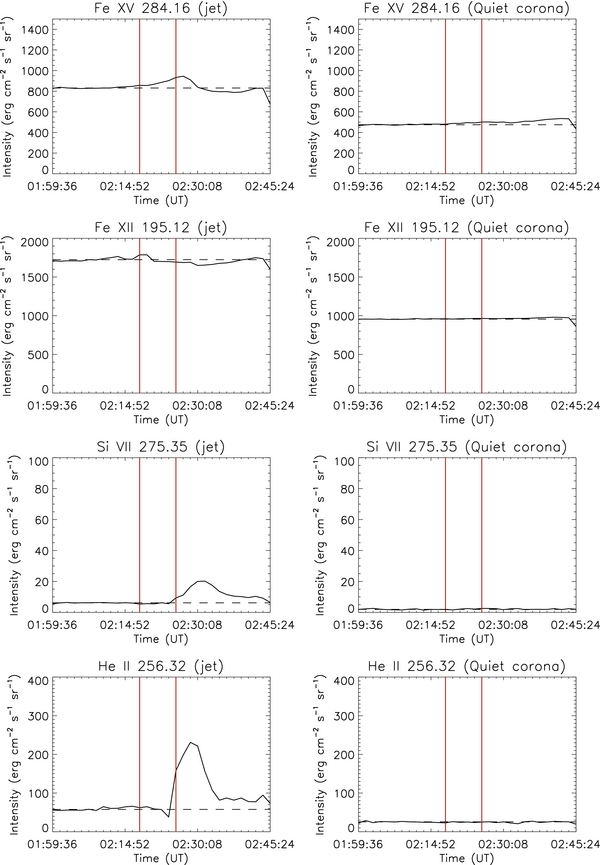
Figure 7. Time profiles of the intensity of EIS spectra of the jet and the quiet corona. Two vertical lines indicate the observing times when the X-ray jet (02:17:55 UT) and He ii jet (02:25:33 UT) start to pass the EIS slit, respectively. The dashed horizontal line represents the average intensity before the jet (from 01:59:36 UT to 02:13:20 UT).
Download figure:
Standard image High-resolution image3.2. Stereoscopic View of the Jet
The novel aspect of this study is the 3D view of the jet using STEREO observations. The separation angle between the Earth and STEREO A was about 75° when the jet was observed. Therefore, we can see the jet located on the limb in the SDO and Hinode observations, and on the disk in the STEREO observations at the same time (Figure 8). To inspect its intensity variation in STEREO/EUVI images, we make base-difference images by subtracting the pre-event image (01:30:30 UT) from each image. Figure 8 shows the sequence of 195 Å intensity and base-difference images from EUVI. The temporal evolution of the EUVI observations is consistent with the evolution of the jet in X-ray and He ii emission. In the base-difference images, first, we find dark strands when the X-ray jet starts. Later, the dark strands are transformed into a large dim loop structure and there is a bright jet-like structure coming from the footpoint of the darkened loop which seems to coincide with the He ii and EUV jets. However, the bright jet disappears in the EUVI images at roughly the same time (∼02: 31 UT) as the X-ray jet and before the He ii jet. The EUVI also showed re-brightening at the footpoint when the radiance enhancement due to falling-back plasma was seen in 304 Å.

Figure 8. STEREO/EUVI 195 Å images of the active region related to the jet: (a) and (b) intensity and (c)–(f) base difference images. The solid lines in panels (a) and (b) indicate the location of the solar limb. The arrows with A and B represent the X-ray jet (dark strands) and He ii jet (bright jet), respectively. The arrows with C and D indicate the position of a footpoint of the jet and a footpoint on the other side of the loop (far side). Boxes indicate the dimming regions for the intensity profiles in Figure 9. FP1, FP2, and LT represent footpoint1, footpoint2, and looptop, respectively.
Download figure:
Standard image High-resolution imageEUVI shows that the jet structure is along a large loop, which is consistent with a model of flux emergence into a large overlying loop instead of the standard open magnetic field (Shibata et al. 1992; Shimojo et al. 2007). Figure 8 shows that the projected size of the dim loop (∼230'') is about twice the length of the jet in XRT images (∼120''). So it is reasonable to assume that the length of the XRT jet gives the loop height and that the loop is a semi-circle. The dimming of the loop propagates from one footpoint to the other. We roughly estimate the propagation speed of the dimming using the slit-time images in Figure 9. The distance between the footpoints on the disk (FP1 and FP2) is about 159 Mm. When we assume the semi-circular loop, the length of the dim loop is about 250 Mm. Figure 9(d) shows the time–intensity profile at the dimming regions. The dimming at the FP2 occurred 5 minutes later than the dimming at FP1. Therefore, the apparent speed of the dimming is about 830 km s−1 along the loop.

Figure 9. Time–distance diagrams obtained from the slits at the (a) FP1, (b) FP2, and (c) LT in Figure 8. Panel (d) shows the time–intensity profile of the dimming regions which were indicated by red-dashed lines in panels (a)–(c). The vertical lines in panel (d) indicate observing times, which are 02:15:30 UT, 02:20:30 UT, 02:25:30 UT, and 02:55:30 UT.
Download figure:
Standard image High-resolution imageTo understand the coronal connections, we also made potential field extrapolation of the SDO/HMI line-of-sight magnetogram of the active region related to the jet when it was on the disk on 2010 June 22 (Figure 10). Although this method is a rough approximation of the field configuration, it can give us an idea of the active region magnetic structure at the jet site. We also compared the AIA 193 Å image observed on 2010 June 22 with the EUVI 195 Å image on June 27. The EUV intensity images look similar. We also checked daily images from HMI and AIA 193 Å between June 22 until June 26. Throughout the large loop, footpoints are rooted in the positive and negative field and although the field evolution is difficult to follow as the region approaches the limb, these two patches seem to have been stable. It shows the large loop structure that was seen as an EUV dimming. Therefore, we used the extrapolation to interpret the magnetic configuration on June 27 and determine the magnetic field strength for the jet region. In Figure 10(c), the red lines indicate the dimming loop. The plot of coronal magnetic field strength along the loop (Figure 10(d)) gives typical field strengths of 4–10 G at ∼60'' which is the height of the EIS slit. This is relevant because using the EIS Fe xiv line ratios, it is possible to derive the plasma density and hence the Alfvén speed.

Figure 10. (a) SDO/AIA 193 Å observation on 2010 June 22, which is the same AR in panel (b). (b) The STEREO/EUVI 195 Å observation of the AR related to the jet on 2010 June 27. (c) The potential field extrapolation obtained from the HMI magnetogram on 2010 June 22. The white and black solid lines indicate open and closed magnetic field, respectively. The red lines correspond to the large overlying loop. (d) Magnetic field strength as a function of height along the loops marked by red solid lines in (c). The dashed line shows the height of the EIS slit.
Download figure:
Standard image High-resolution imageThe Alfvén speed is given by  , where B is the magnetic field strength and ρ is the plasma density. We determine electron densities using the Fe xiv λ264.79/λ274.20 line ratios for the loops at the height and position where EIS observed the jet, the quiet corona, and the active region above the limb (Figure 11). The intensity of each region is averaged over 25 pixels along the slit. We converted the 1σ error bars on the line intensities to errors on the derived densities. First, we obtained the 1σ error of each line intensity. Second, we estimated the 1σ error of the ratio of the line intensities, which is given as

where I1 and I2 indicate the line intensities for the density measurement, R is the ratio of these two intensities, σI1, σI2, and σR are the 1σ errors of the line intensities, and the ratio, respectively. Then, we determine the lower limit and upper limit of the densities from the ratio of the intensity with the errors. The average density of the loop at the position of the EIS observations is about 3 × 108 cm−3. Since the magnetic field strength of the loop at the height, ∼60'', of the slit is between 4 and 10 G, the Alfvén speed in the loop is ∼480–1200 km s−1.

Figure 11. Electron densities determined from the Fe xiv λ264.79/λ274.20 ratio. The diamond, asterisk, and cross represent the density in the loop, a quiet region, and an active region over the limb, respectively. The error bars (vertical lines) on the density come from the 1σ error bars on the line intensities.
Download figure:
Standard image High-resolution image3.3. Helical Motion in the Jet
From the intensity images, we deduced helical motions of the cool jet in He ii 304 Å. The He ii 304 Å jet shows counterclockwise helical motions, while the X-ray jet shows only radial motions (movies 3 and 5). At the position of the black arrows in the AIA 193 Å image, there are two strands at 02:27 UT (Figure 3). These two strands show a kink-like shape. Then, the jet expands with unwinding motions in He ii 304 Å and fades in the Fe xii 193 Å images. Figure 12 shows spacetime diagrams along cuts perpendicular to the jet axis. The diagrams show plane-of-sky velocities, ∼60 km s−1 (top panel) and ∼30 km s−1 (bottom panel), that were decreasing with increasing height. The direction of twist can be deduced from the Doppler shift pattern observed by EIS.

Figure 12. Intensity images of 304 Å (left) with lines showing the position of time-distance images shown on the right. The middle images are intensity and those on the far right, running difference. The black arrows indicate the direction of blue-to-red Doppler flow in EIS spectra.
Download figure:
Standard image High-resolution image
Figure 6 shows intensity and Doppler velocity maps of the EIS He ii 256.32 Å, Si vii 275.35 Å, Fe xii 195.12 Å, and Fe xv 284.16 Å and their spectra along the slit. The EIS spectra at He ii 256.32 Å and Si vii 275.35 Å show both redshift and blueshift components in the jet. We note that the red wing of He ii 256.32 Å in off-limb spectra is often dominated by coronal emission from Si x 256.37 Å, Fe xii 256.41 Å, and Fe xiii 256.42 Å; however, since there is no significant second velocity component in the coronal emission at other wavelengths (e.g., Fe xii 195 Å), we think that the Doppler velocity pattern was caused by the He ii (cool plasma) motion. For confirmation, we show the Si vii line profiles in Figure 6. The blueshifts and redshifts derived from a double Gaussian fit of the Si vii 275.35 Å line correspond to ∼ − 72 km s−1 and ∼8 km s−1, respectively. These shifts could have been caused by the untwisting motion seen in the 304 Å AIA images or by up- and down-flows in the jet. Blueshifts at the top and redshifts below would be consistent with counterclockwise rotation. Up and down flows on the other hand may be expected to show a red-to-blueshift change with time at the same pixel position. We therefore favor the helical flow interpretation.
Helical motions in jets have already been reported in several studies (Canfield et al. 1996; Jiang et al. 2007; Patsourakos et al. 2008; Kamio et al. 2010; Shen et al. 2011). Canfield et al. (1996) and Kamio et al. (2010) observed blueshifts and redshifts on opposite sides of a macrospicule and surges, which are interpreted as rotating motions. Kamio et al. (2010) noted that the macrospicule shows rotating motions while the X-ray jet shows radial outflows, which is consistent with our observation. They also determined the 3D orientation and velocities of the macrospicule using STEREO observations and confirmed such helical motions. They suggested that the coronal jet and the macrospicule have different structures; the coronal jet consists of outflowing hot plasma, while the macrospicule is formed by cool plasma with rotating motions.
4. SUMMARY AND CONCLUSION
We have investigated a coronal jet observed simultaneously by Hinode, SDO, and STEREO and deduced its temporal evolution over a broad range of temperatures, as well as its stereoscopic structure and spectroscopic characteristics. The main results are summarized as follows. (1) We observed the coexistence of hot and cool jets. The hot jet has a typical X-ray jet morphology which includes a collimated ejection with inverted "Y" shape as well as a small coronal BP (Shibata et al. 1992). The apparent velocity of the hot jet is about 250–280 km s−1, while the cool jet has two velocity components: 70–80 km s−1 and 220–340 km s−1. (2) From the SOT observations, we found that a loop emerged with the jet. The size and ascending speed of the loop are ∼35'' and ∼45 km s−1, respectively. This loop may be emerging flux. (3) For the cool jet, the erupting plasma falls back along the path of the jet with a velocity of 90–110 km s−1. We can also see an enhancement of the He ii emission at the bottom of the jet, which may due to a density increase caused by falling-back plasma. (4) From the STEREO observation, we found a large loop that dimmed in EUV 195 Å emission both along the loop and at its footpoints. This loop structure corresponds to the hot jet which implies the dimming may have been caused by heating. According to the emerging flux reconnection model, jets propagate along the open magnetic field or, in this case, a large-scale overlying loop. This is the first report of simultaneous limb and disk views of a jet. (5) We have measured the dimming propagation speed (∼830 km s−1) which is much faster than the apparent speed of the hot and cool jets. This speed is comparable to the Alfvén speed (480–1200 km s−1) derived from the magnetic field strength and density of the loop. The difference between our observation and previous studies of such fast jets (Strong et al. 1992; Cirtain et al. 2007; Shimojo et al. 2007) is that we observe an EUV dimming and they observed X-ray emission. (6) The AIA and EIS observations show that the cool jet has rotating motions. In the AIA He ii images, we see helical motions. We estimated the line-of-sight velocity using the EIS spectra. There are two different Doppler velocities (∼ − 72 km s−1 and ∼8 km s−1), which can be interpreted to be counterclockwise helical motions.
Overall, the observations from different instruments (the loop emergence at the low atmosphere, the apparent velocities of the hot and cool jet, and magnetic field configuration) are consistent with magnetic reconnection models for hot and cool jets (Yokoyama & Shibata 1995, 1996; Nishizuka et al. 2008; Moreno-Insertis et al. 2008) produced by magnetic reconnection between the emerging flux and an overlying coronal field in the transition region or upper chromosphere. Other observational aspects such as the helical structure in the cool and dense plasma and the EUV dimming propagating with Alfvén speed, are consistent with the 3D MHD model by Pariat et al. (2009). They developed a 3D MHD model which produced massive, high-speed jets driven by nonlinear Alfvén waves. They showed that magnetic stress is built up by axisymmetric twisting motions until an ideal instability breaks the symmetry and leads to an explosive release of energy via reconnection. Then the closed field lines become open and high-density plasma flow emerges with the helical structure.
The most interesting finding from the present study is the EUV dimming propagating along the loop with the Alfvén speed. The EUV dimming may be due to a density decrease or heating/cooling out of the EUV filter band. In our observation, the X-ray jet and dimming are seen before the cool and dense helical jet and the dimming propagates with Alfvén speed. If we compare our observational results to the Pariat et al. (2009) and Nishizuka et al. (2008) simulations, the coronal X-ray jet may be caused by acceleration and heating at a magnetic reconnection site in the upper chromosphere so that a cool chromospheric jet is accelerated later with lower velocity. Then, the field opening and nonlinear torsional Alfvén waves may produce the EUV dimming with a fast propagation speed reported in this paper.
We thank the referee for valuable suggestions and comments. This work has been supported by the WCU program (No. R31-10016) through the National Research Foundation of Korea funded by the Ministry of Education, Science and Technology and by the Korea Research Foundation Grant funded by the Korean Government (MOEHRD, Basic Research Promotion Fund; KRF-2008-314-C00158, 20090071744 and 20100014501). We also acknowledge the support of the Korea Meteorological Administration/National Meteorological Satellite Center. This work was partially supported by the Construction of the Korean Space Weather Center, the project of KASI. Hinode is a Japanese mission developed and launched by ISAS/JAXA, with NAOJ as domestic partner and NASA and STFC (UK) as international partners. It is operated by these agencies in cooperation with ESA and the NSC (Norway). STEREO is a project of NASA and SDO is a mission for NASA's Living With a Star (LWS) program.