


ABSTRACT
We report our observations of the new pulsating hydrogen atmosphere white dwarf SDSS J132350.28+010304.22. We discovered periodic photometric variations in frequency and amplitude that are commensurate with nonradial g-mode pulsations in ZZ Ceti stars. This, along with estimates for the star's temperature and gravity, establishes it as a massive ZZ Ceti star. We used time-series photometric observations with the 4.1 m SOAR Telescope, complemented by contemporary McDonald Observatory 2.1 m data, to discover the photometric variability. The light curve of SDSS J132350.28+010304.22 shows at least nine detectable frequencies. We used these frequencies to make an asteroseismic determination of the total mass and effective temperature of the star: M⋆ = 0.88 ± 0.02 M☉ and Teff = 12, 100 ± 140 K. These values are consistent with those derived from the optical spectra and photometric colors.
Export citation and abstract BibTeX RIS
1. INTRODUCTION
Roughly 97% of all stars born have main-sequence masses less than 8–10 M☉; these stars will evolve to become white dwarf stars (e.g., Weidemann 2000). This is in agreement with Podsiadlowski et al. (2004), who estimate 11 ± 1 M☉ as the lower limit for stars that evolve to neutron stars. White dwarf stars are therefore records of stellar evolution history (Fontaine & Brassard 2008; Winget & Kepler 2008; Althaus et al. 2010b). Because of their compact nature and high internal temperatures, they are also useful as probes of high energy density physics (e.g., Kepler et al. 2005; Isern et al. 2010). Spectroscopically, more than 80% of all white dwarf stars show only hydrogen lines and are classified as spectral type DA (e.g., Kepler et al. 2007; Bergeron et al. 2011). As DAs cool below an effective temperature ∼13, 000 K, they develop a partial ionization zone near the surface that results in surface convection. As the convection zone becomes deep enough, near 12,200 K, depending on the mass of the star, most if not all DA white dwarf stars start to pulsate in non-radial g-mode pulsations (e.g., Castanheira et al. 2010). We report the discovery of pulsations in the higher than average mass DA SDSS J132350.28+010304.22.
We fit the two existing Sloan Digital Sky Survey (SDSS) spectra of this star with synthetic spectra, based on atmosphere models, using ML2/α = 0.6 (e.g., Bergeron et al. 1995) mixing length convection parameterization, and Tremblay et al. (2010) non-ideal Stark broadening (Koester et al. 2009; Koester 2010). Each SDSS spectra can be uniquely identified by a Plate-Modified Julian Date-Fiber number. The two spectra, with Plate-Modified Julian Date-Fiber = 0297-51959-332 and S/N = 14, yield a fit of Teff = 11, 780 ± 160 K and log g = 8.56 ± 0.06, and M = 0.94 ± 0.03 M☉ (Figure 1), while 0297-51663-324, with S/N = 11, yields a fit of Teff = 11, 900 ± 230 K and log g = 8.45 ± 0.08, and M = 0.88 ± 0.05 M☉; the masses were obtained using the evolutionary models of Althaus et al. (2010a). Tremblay et al. (2011) independently fit the same SDSS spectra with their α = 0.8 models and find similar values: Teff = 11, 680 ± 200 K and log g = 8.59 ± 0.07, and a mass M = 0.98 ± 0.05 M☉.
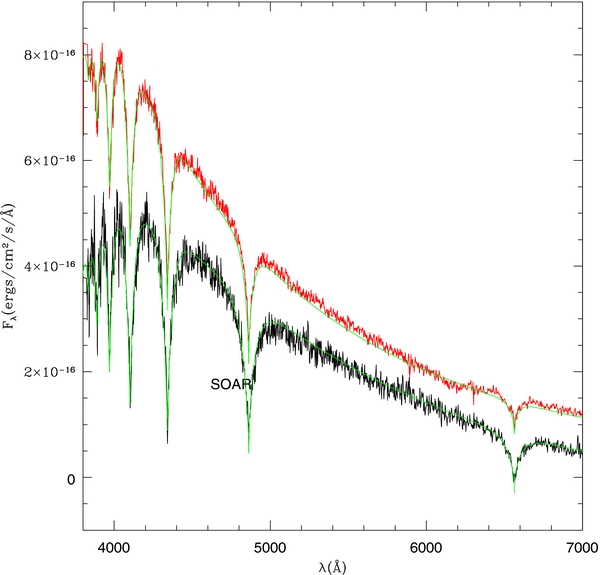
Figure 1. Highest S/N spectra, PMF = 0297-51959-332, spectra from SDSS (upper: red) and Soar (lower: black).
Download figure:
Standard image High-resolution imageCastanheira et al. (2010) discuss the 148 DAVs known to date and none have reported magnetic field determinations. Wickramasinghe & Ferrario (2005) quote a mean mass of 0.93 M☉ for magnetic white dwarfs, compared with 0.6 M☉ for normal white dwarfs, based on Liebert et al. (2003) determinations. As magnetic field broadening of the lines can be mistaken as higher gravity, we need to determine if the mass estimated from the spectra is affected by a magnetic field.
We report higher signal-to-noise (S/N) spectra and polarization measurements showing no clear evidence that SDSS J132350.28+010304.22 is magnetic to our detection limit around 1 MG.
2. OBSERVATIONS: PHOTOMETRIC AND SPECTROSCOPIC
We obtained time series of 30 s images with the B filter on the night of 2011 April 28, using the SOAR Optical Imager attached to the SOAR 4.1 m telescope, detecting ZZ Ceti-type pulsations in SDSS J132350.28+010304.22 for the first time. We obtained follow-up observations at SOAR on the night of 2011 May 6 and contemporaneously at the McDonald 2.1 m Struve telescope using the Argos prime focus camera on the nights of 2011 May 6 and 7, with 15 s exposures, and a BG 40 filter, confirming this object as a new DAV (Figure 2). The standard reduction procedures and weighted aperture photometry of a total of 600 × 30 s and 1584 × 15 s images were performed as described in Kanaan et al. (2000). The Fourier transform of combined two-site light curve (Figure 3) shows nine periodicities (Table 1) to a 99.9% confidence level of 3.4 millimodulation amplitude (mma). The confidence level was calculated by randomizing the light curve as described by Costa et al. (1999).

Figure 2. Light curve of SDSS J132350.28+010304.22 obtained at the 4.1 m SOAR telescope and the 2.1 m Struve Telescope at McDonald Observatory. The black line shows the sum of nine sinusoids with the amplitude and phases obtained from a nonlinear least-squares fit to the whole time series.
Download figure:
Standard image High-resolution image
Figure 3. Fourier transform of the total light curve in the top panel, showing the largest periodicity at 612 s, with 12.2 millimodulation amplitude. The inset shows the spectral window, the transform of a single sinusoid with the same sampling as the light curve. The lower panels show the step-by-step Fourier transforms after prewhitening by the largest peaks in the preceding panel. The amplitude scale of each panel is different and the (red) dashed line shows the 1/1000 false alarm probability estimated for that panel.
Download figure:
Standard image High-resolution imageTable 1. Multisinusoidal Fit
| fi | Frequency | Period | Amplitude |
|---|---|---|---|
| (μHz) | (s) | (mma) | |
| f1 | 1633.37 ± 0.05 | 612.23 ± 0.02 | 11.9 ± 0.7 |
| f2 | 1818.83 ± 0.06 | 549.81 ± 0.02 | 6.7 ± 0.7 |
| f3 | 1694.54 ± 0.08 | 590.13 ± 0.03 | 7.1 ± 0.7 |
| f4 | 1571.37 ± 0.12 | 636.39 ± 0.05 | 4.8 ± 0.7 |
| f5 | 1431.35 ± 0.10 | 698.64 ± 0.05 | 4.3 ± 0.7 |
| f6 | 1490.18 ± 0.11 | 671.06 ± 0.05 | 4.4 ± 0.7 |
| f7 | 1203.28 ± 0.10 | 831.06 ± 0.07 | 4.6 ± 0.7 |
| f8 | 2018.39 ± 0.10 | 495.44 ± 0.03 | 4.1 ± 0.7 |
| f9 | 1131.00 ± 0.11 | 884.17 ± 0.09 | 4.1 ± 0.7 |
Download table as: ASCIITypeset image
We have also carried out spectroscopic observations using the SOAR Goodman High Throughput Spectrograph to refine our spectroscopic mass determinations. The spectrograph was configured with a 3 arcsec wide slit and using a volume phase holographic 1200 l mm−1 grating centered around Hα on the night of 2011 May 12, and using a 2100 l mm−1 grating around Hβ on the nights of 2011 June 1–3. The spectroscopic reduction procedures of a total of 3 × 1800 s around Hα, 6 × 1224 s and 9 × 612 s, both around Hβ, were performed using standard IRAF routines, which include: bias subtraction, flat-fielding, cosmic-ray cleaning, and flux and wavelength calibration. The combined spectrum shown in Figure 4 has an S/N of ≃ 20.

Figure 4. Spectra from SOAR 4.1 m telescope around Hα. The upper line shows the PMF = 0297-51959-332 SDSS spectrum.
Download figure:
Standard image High-resolution imageIn an attempt to search for magnetic fields, we obtained spectropolarimetry with FORS2 on ESO's Very Large Telescope (VLT), using the GRISM 300V+10 setup and the λ/2 retarder plate, on June 30 and July 1. We acquired 4 × 1500 s exposures with the ± 45 deg circular polarizer setup. Figure 5 shows the spectropolarimetric measurements, showing no evidence of magnetic fields, but with a low S/N in Stokes V/I. Figure 6 follows the low-field approach of Bagnulo et al. (2002, 2012) to test for a magnetic field. The lack of significant inclination of the line is consistent with zero longitudinal field. We also detect no quadratic Zeeman displacements of the line centers, even for the higher Balmer lines.

Figure 5. Spectropolarimetric measurements from ESO's VLT 8.2 m telescope. The upper plot shows the flux spectra, while the lower plot shows the observed V/I, compared to expected circular polarization for a 1 MG field, at viewing angles of 0 deg (pole on the line of sight), 45 deg, and 90 deg (Külebi et al. 2009).
Download figure:
Standard image High-resolution image
Figure 6. Circular polarization Stokes parameters V/I plotted vs. λ2(1/I)(dI/dλ), so the slope of the data points is directly the magnetic field (Bagnulo et al. 2002). For magnetic fields smaller than B ≃ 300 kG, all the Zeeman components are linear in relation to this parameter. The red points show a 1 MG model. For such a field, the higher Balmer lines should show significant quadratic contributions, as ΔλQ∝n4.
Download figure:
Standard image High-resolution image
3. RESULTS
Schmidt & Smith (1995) discuss that circular polarization cannot be detected for equator on line-of-sight fields, and we used their formula to estimate the probability of not detecting a field due to inclination, p = 2.5 Blim./Bd = 50% for Blim. = 200 kG and Bd = 1 MG (Figure 5). To test for a magnetic field with the equatorial plane close to the line of sight, it will be necessary to measure linear polarization.
The high S/N ESO spectra, also shown in Figure 5, fit a lower temperature, Teff = 11, 300 ± 50 K, log g = 8.73 ± 0.02, and M = 1.049 ± 0.011 M☉, if we fit the whole spectra, but Teff = 11, 980 ± 10 K, log g = 8.56 ± 0.01, and M = 0.956 ± 0.005 M☉, if we fit only the line profiles. The line profile fit is more reliable because the flux calibration did not include the retarder plate or a redetermination of the extinction after the 2011 Puyehue volcano explosion. The low-resolution spectrum shows no evidence of a magnetic field.
Assuming that the nine periodicities detected in the light curve are normal g-modes, we made an amplitude-weighted fit of the observed periods to those computed from the full evolutionary models of Althaus et al. (2010a), the LAPLATA models, following Romero et al. (2012). The results of seismology are: M* = 0.88 ± 0.02 M☉, Teff = 12, 100 ± 140 K, MH = (4.0 ± 3.3) × 10−7 M*, MHe = (2.6 ± 0.3) × 10−3 M*, log (L/L☉) = −2.79 ± 0.05, log (R/R☉) = −2.038 ± 0.025, log g = 8.46 ± 0.07, XC = 0.37 ± 0.01, XO = 0.62 ± 0.01, progenitor mass Minitial = 5.0 ± 0.5 M☉, and ϕ = 2.15 s, the average of the differences between theoretical and observed periods (Table 2). We estimate that the uncertainties in the physics, such as the uncertainty in the cross section of the C(α, γ)O reaction, overshooting, thermal pulses, and mass loss, introduce uncertainties of the order of 1 s in the theoretical periods, so differences in ϕ ≃ 1 s represent good agreement (e.g., Bischoff-Kim et al. 2008). The model has not crystallized at this temperature. It starts to crystallize at Teff ≃ 10, 500 K if we use the spindle diagram of Segretain & Chabrier (1993) or at Teff ≃ 9600 K if we use the azeotropic phase diagram of Horowitz et al. (2010; see also Althaus et al. 2012).
Table 2. Seismological Fit with the LAPLATA Models
| Pobs | Ptheo | ℓ | k | δ |
|---|---|---|---|---|
| 612.23 | 610.35 | 1 | 14 | 1.88 |
| 589.68 | 591.70 | 2 | 25 | 2.02 |
| 549.80 | 551.80 | 2 | 23 | 2.00 |
| 636.32 | 636.02 | 2 | 27 | 0.30 |
| 704.34 | 704.00 | 1 | 17 | 0.34 |
| 671.05 | 671.46 | 1 | 16 | 0.41 |
| 839.14 | 832.59 | 2 | 36 | 6.56 |
| 495.43 | 490.59 | 1 | 11 | 4.88 |
| 884.18 | 885.10 | 1 | 22 | 0.92 |
Download table as: ASCIITypeset image
We also used the simpler models described in Castanheira & Kepler (2008), which assume C/O = 50%, but allow the helium and the hydrogen layer mass to vary, to do another seismological fit, with the results shown in Table 3. From the averages of the minima of various families of solutions, we obtained, Teff = 11, 900 ± 200 K, M* = 0.88 ± 0.08 M☉, MH = 10−4.5 ± 0.4 M*, and MHe = 10−2.3 ± 0.5 M*. The large difference in MH of the two results may be due to the core-envelope symmetry studied by Montgomery et al. (2003) and the simple C/O profile used in Castanheira & Kepler (2008) models.
Table 3. Seismological Fit Following Castanheira & Kepler (2008), C/O = 50%
| Teff | M | −log MH | −log MHe | Φ (s) | Modes (ℓ, k) |
|---|---|---|---|---|---|
| 11,800 | 0.84 | 4 | 2 | 2.7 | 485.12(1,10), 550.03(1,12), 583.76(1,13), |
| 612.69(1,14), 642.75(1,15), 675.10(1,16), | |||||
| 705.57(1,17), 834.17(1,21), 897.42 (1,23) | |||||
| 11,700 | 0.88 | 4.5 | 2 | 2.9 | 482.73(1,11), 550.25(1,13), 582.94(1,14), |
| 612.21(1,15), 642.98(1,16), 673.45(1,17), | |||||
| 707.15(1,18), 833.59(1,22), 897.18 (1,24) | |||||
| 12,200 | 0.93 | 5 | 3 | 2.8 | 489.20(1,11), 549.50(1,13), 585.51(1,14) |
| 613.20(1,15), 643.45(1,16), 678.86(1,17), | |||||
| 710.05(1,18), 834.98(1,22), 897.13(1,24) |
Download table as: ASCIITypeset image
To assure that the prewhitening was not introducing uncertainties in the seismological solution, one of us independently measured the periodicities in the observed light curve by prewhitening; he obtained a period of 831 s for the smallest amplitude period measured, and measured another periodicity, at 525 s, with an amplitude of 3.6 ± 0.7 mma. The uncertainties quoted for the periods are the internal uncertainties of the fits; they do not take into account the possibility that the selected period is a sidelobe of the real period, caused by the presence of gaps in the data. For the low amplitude modes, selection of which sidelobe to prewhiten is sometimes ambiguous. We searched for independent seismological solutions but it resulted in the same model quoted above, with the smallest amplitude modes fitting the model periodicities of 832.59 s and 534.47 s. Therefore, we conclude that the detected periodicities and the seismological solution are robust.
4. DISCUSSION
Dolez & Vauclair (1981) and Winget et al. (1982) demonstrated that the surface partial ionization drives the observed pulsations in ZZ Ceti stars, and Brickhill (1990) demonstrated that convective driving is important.
Schmidt & Grauer (1997) and Valyavin et al. (2006) established only upper limits of a few kG for the handful of pulsating white dwarf stars they observed with spectropolarimetry. There has been no direct spectroscopic, spectropolarimetric, or polarimetric evidence for magnetic fields, of any strength, in the DBV or DAV stars. Fontaine et al. (1973) estimated that equipartition between magnetic energy and convection kinetic energy occurs for field strengths in the range 10–100 kG. Furthermore, applying the formalism of Gough & Tayler (1966), we expect magnetic fields with vertical components in this range to effectively suppress convection.
SDSS J132350.28+010304.22 has a mass higher than the average mass of DAs (Kepler et al. 2007; Tremblay et al. 2010), has an effective temperature close the blue edge of the ZZ Ceti instability strip, even though the blue edge is mass dependent, and has long pulsation periods. Kepler et al. (1983), Handler et al. (2002), and Dolez et al. (2006), for example, used rotational splittings observed in some ZZ Ceti stars to estimate rotation periods of order of 1 day. We do not detect multiplets from rotational or magnetic splitting in this star, but such detections require longer and denser observations than reported here.
The seismological mass agrees with the spectral determination, indicating a mass close to 0.88–0.9 M☉. Comparing the SDSS colors to the theoretical photometry of Holberg & Bergeron (2006) results in Teff = 12, 330 ± 160 K and log g = 8.13 ± 0.22. The relatively low log g from the colors is incompatible with the spectroscopic and seismological results, but its large uncertainty prevent its effective use.
The initial-to-final mass relation of Williams et al. (2009) indicates a mass of the progenitor of (4.17 ± 0.25) M☉, consistent with the seismological progenitor mass.
The lack of reported magnetic fields among the 148 known ZZ Ceti stars suggests the possibility that there may be a difference in the ratio of magnetic to non-magnetic stars in and out of the instability strip. This makes it important to investigate if magnetic fields have been missed in the known DAVs or if there is an observational effect selecting against them.
This work is based on observations at the SOuthern Astrophysical Research telescope, a collaboration between CNPq-Brazil, NOAO, UNC, and MSU, and on observations made with the ESO VLT telescopes at the Paranal Observatory under program ID 287.D-5037(A). SOAR proposals SO2011A-002, SO2011A-007, and SO2011A-027. ESO proposal 287.D-5037(A). S.O.K., J.E.S.C., I.P., and V.P. are supported by CNPq and FAPERGS/Pronex. D.E.W. and M.H.M. gratefully acknowledge the support of the US National Science Foundation under grant AST-0909107 and the Norman Hackerman Advanced Research Program under grant 003658-0252-2009. B.K. is supported by the MICINN grant AYA08-1839/ESP, by the ESF EUROCORES Program EuroGENESIS (MICINN grant EUI2009-04170), by the 2009SGR315 of the Generalitat de Catalunya and EU-FEDER funds. A.K. is supported by CNPq. A.H.C., A.D.R., and L.G.A. acknowledge AGENCIA through the Programa de Modernización Tecnológica BID 1728/OC-AR, and the PIP 112-200801-00940 grant from CONICET.